Event Listener class
The BIG-IP Telemetry Streaming Event Listener collects event logs it receives on the specified port from configured BIG-IP sources, including LTM, ASM, AFM, APM, and AVR.
Note
Each Telemetry_Event_Listener opens 3 ports: TCP (dual stack - IPv4 and IPv6), UDPv4, and UDPv6
If two or more Event Listeners use same port, all of them receive same events, but you can still use filters for each listener individually.
To use the Event Listener, you must:
- Configure the sources of log/event data. You can do this by either POSTing a single BIG-IP AS3 declaration or you can use TMSH or the GUI to configure individual modules.
- Post a telemetry declaration with the Telemetry_Listener class, as shown in the following minimal example of an Event Listener:
"My_Listener": {
   "class": "Telemetry_Listener",
   "port": 6514
}
Tracing can also can be optionally enabled for each BIG-IP Telemetry Streaming Listener, using the trace property.
By default, tracing is disabled (the trace property defaults to false), but can be enabled by setting the property to true, or to a string value representing a valid operating system path (for example: /var/telemetry/myTraceFile.json). When tracing is enabled, the Listener will write the data it receives (after BIG-IP Telemetry Streaming has processed and normalized the data) to disk. BIG-IP Telemetry Streaming 1.20.0 and later also includes the ability to trace the raw input data (before BIG-IP Telemetry Streaming has processed the data). For more information and instructions, see Trace.
IMPORTANT:
- The following configuration examples assume that BIG-IP TS is running on the same BIG-IP that is being monitored, and that the listener is using default port 6514.
- When BIG-IP TS is not a local listener, the corresponding configurations should be adjusted to reflect remote addresses.
Note
See this troubleshooting entry for information on how to write an Event Listener’s incoming raw data to a trace file to assist with troubleshooting.
Configuring Logging Sources
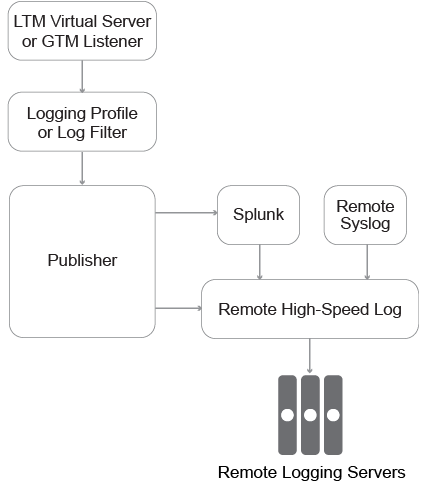
General workflow to configure a logging source:
- Define a local virtual address and specify the Event Listener port (this enables BIG-IP TS to act as a local, on-box listener)
- Define a pool of logging servers
- Create an unformatted high speed logging destination that references the pool
- Create a formatted destination
- Create a log publisher which is referenced by a logging profile
- Associate the logging profile with the relevant virtual server
The following diagram shows the relationship of the objects that are configured:
Configure Logging Using BIG-IP AS3
You can use the following declaration with F5 BIG-IP Application Services Extension (BIG-IP AS3) 3.10.0 or later for a standard BIG-IP system. For more information, see AS3 documentation.
You can also configure logging using TMSH, see Configure Logging Using TMSH.
Note
Some profiles are not supported in BIG-IP AS3 and therefore must be configured using TMSH.
IMPORTANT: This declaration has been updated with the BIG-IP TS 1.18 release to include LTM response logging (highlighted in yellow).
{
    "class": "ADC",
    "schemaVersion": "3.10.0",
    "remark": "Example depicting creation of BIG-IP module log profiles",
    "Common": {
    	"class": "Tenant",
        "Shared": {
            "class": "Application",
            "template": "shared",
            "telemetry_local_rule": {
                "remark": "Only required when TS is a local listener",
                "class": "iRule",
                "iRule": "when CLIENT_ACCEPTED {\n  node 127.0.0.1 6514\n}"
            },
            "some_service": {
                "class": "Service_Generic",
                "remark": "Sample service to monitor",
                "virtualAddresses": [
                    "192.168.10.11"
                ],
                "virtualPort": 443,
                "profileTrafficLog": {
                    "use": "telemetry_traffic_log_profile"
                },
                "securityLogProfiles": [
                    {
                        "use": "telemetry_asm_security_log_profile"
                    },
                    {
                        "use": "telemetry_afm_security_log_profile"
                    }
                ]
            },
            "telemetry_local": {
                "remark": "Only required when TS is a local listener",
                "class": "Service_TCP",
                "virtualAddresses": [
                    "255.255.255.254"
                ],
                "virtualPort": 6514,
                "iRules": [
                    "telemetry_local_rule"
                ]
            },
            "telemetry": {
                "class": "Pool",
                "members": [
                    {
                        "enable": true,
                        "serverAddresses": [
                            "255.255.255.254"
                        ],
                        "servicePort": 6514
                    }
                ],
                "monitors": [
                    {
                        "bigip": "/Common/tcp"
                    }
                ]
            },
            "telemetry_hsl": {
                "class": "Log_Destination",
                "type": "remote-high-speed-log",
                "protocol": "tcp",
                "pool": {
                    "use": "telemetry"
                }
            },
            "telemetry_formatted": {
                "class": "Log_Destination",
                "type": "splunk",
                "forwardTo": {
                    "use": "telemetry_hsl"
                }
            },
            "telemetry_publisher": {
                "class": "Log_Publisher",
                "destinations": [
                    {
                        "use": "telemetry_formatted"
                    }
                ]
            },
            "telemetry_traffic_log_profile": {
                "class": "Traffic_Log_Profile",
                "requestSettings": {
                    "requestEnabled": true,
                    "requestProtocol": "mds-tcp",
                    "requestPool": {
                        "use": "telemetry"
                    },
                    "requestTemplate": "event_source=\"request_logging\",hostname=\"$BIGIP_HOSTNAME\",client_ip=\"$CLIENT_IP\",server_ip=\"$SERVER_IP\",http_method=\"$HTTP_METHOD\",http_uri=\"$HTTP_URI\",virtual_name=\"$VIRTUAL_NAME\",event_timestamp=\"$DATE_HTTP\""
                },
                "responseSettings": {
                    "responseEnabled": true,
                    "responseProtocol": "mds-tcp",
                    "responsePool": {
                        "use": "telemetry"
                    },
                    "responseTemplate": "event_source=\"response_logging\",hostname=\"$BIGIP_HOSTNAME\",client_ip=\"$CLIENT_IP\",server_ip=\"$SERVER_IP\",http_method=\"$HTTP_METHOD\",http_uri=\"$HTTP_URI\",virtual_name=\"$VIRTUAL_NAME\",event_timestamp=\"$DATE_HTTP\",http_statcode=\"$HTTP_STATCODE\",http_status=\"$HTTP_STATUS\",response_ms=\"$RESPONSE_MSECS\""
                }
            },
            "telemetry_afm_security_log_profile": {
                "class": "Security_Log_Profile",
                "application": {
                    "localStorage": false,
                    "remoteStorage": "splunk",
                    "protocol": "tcp",
                    "servers": [
                        {
                            "address": "255.255.255.254",
                            "port": "6514"
                        }
                    ],
                    "storageFilter": {
                        "requestType": "illegal-including-staged-signatures"
                    }
                },
                "network": {
                    "publisher": {
                        "use": "telemetry_publisher"
                    },
                    "logRuleMatchAccepts": false,
                    "logRuleMatchRejects": true,
                    "logRuleMatchDrops": true,
                    "logIpErrors": true,
                    "logTcpErrors": true,
                    "logTcpEvents": true
                }
            },
            "telemetry_asm_security_log_profile": {
                "class": "Security_Log_Profile",
                "application": {
                    "localStorage": false,
                    "remoteStorage": "splunk",
                    "servers": [
                        {
                            "address": "255.255.255.254",
                            "port": "6514"
                        }
                    ],
                    "storageFilter": {
                        "requestType": "all"
                    }
                }
            }
        }
    }
}
Configure Logging Using TMSH
This section describes how to configuring logging using TMSH.
The first steps depend on which type of BIG-IP system you are using: a standard BIG-IP system or a Per-App BIG-IP VE (Virtual Edition).
Use only one of the following procedures for the initial configuration.
Initial configuration for Per-App BIG-IP VE
The configuration for a Per-App VE is different because it limits the number of virtual servers (one virtual IP address and three virtual servers).
If you are using a Per-App VE, to avoid creating the virtual server for the local listener, you can point the pool directly at the TMM link-local IPv6 address, using the following guidance:
From the BIG-IP Command line, type the following command:
ip -6 a s tmm scope link.
You see the system return something similar to the following:tmm: <BROADCAST,MULTICAST,UP,LOWER_UP> mtu 1500 state UP qlen 1000 inet6 fe80::298:76ff:fe54:3210/64 scope link valid_lft forever preferred_lft forever
Copy the IPv6 address starting after inet6, beginning with fe80, and without any mask. In our example, we copy fe80::298:76ff:fe54:3210
Create a pool using the following command (replace the IPv6 link-local address with the one returned from the BIG-IP in the first step):
tmsh create ltm pool telemetry members replace-all-with { fe80::298:76ff:fe54:3210.6514 }Continue with Configuring the rest of the logging components.
Initial configuration for a standard BIG-IP system
If you are using a standard BIG-IP system (one that does not have restrictions on the number of virtual servers like the Per-App VE), use the following guidance to initially configure the system.
Create an iRule (localhost forwarder).
create ltm rule telemetry_local_rule
And insert the following iRule code:
when CLIENT_ACCEPTED {
    node 127.0.0.1 6514
}
See K05413010: After an upgrade, iRules using the loopback address may fail and log TCL errors for more information.
Create the virtual server for the local listener.
create ltm virtual telemetry_local destination 255.255.255.254:6514 rules { telemetry_local_rule } profiles replace-all-with { f5-tcp-progressive } source-address-translation { type automap } persist replace-all-with { source_addr { default yes }}
Create the pool.
create ltm pool telemetry monitor tcp members replace-all-with { 255.255.255.254:6514 }
Continue with Configuring the rest of the logging components.
Important
Post-upgrade to version 15.1.6.x or 16.1.2 and up, /var/log will start filling up with TCL errors.
- TCL errors appear to indicate an invalid iRule configuration that worked in the previous code.
- Virtual server using the iRule will fail.
Example of logs:
TCL error: /Common/telemetry_local_rule <CLIENT_ACCEPTED> - disallow self or loopback connection (line 1)TCL error (line 1) (line 1) invoked from within "node 127.0.0.1 6514"
There is a functional code change in 15.1.6.x and 16.1.2 and up:
Database variable tmm.tcl.rule.node.allow_loopback_addresses was created to toggle whether or not to allow loopback addresses for iRule node command.
Workaround:
The actions or steps required to address iRules using the loopback address may fail and log TCL errors.
To disable this variable:
tmsh modify sys db tmm.tcl.rule.node.allow_loopback_addresses value true
tmsh save sys config
Note
See K05413010: After an upgrade, iRules using the loopback address may fail and log TCL errors for more information.
Configuring the rest of the logging components
In this section, you configure the remaining objects for logging, no matter which initial configuration method you used.
Create the Log Destination (Remote HSL):
create sys log-config destination remote-high-speed-log telemetry_hsl protocol tcp pool-name telemetry
Create the Log Destination (Format):
create sys log-config destination splunk telemetry_formatted forward-to telemetry_hsl
Create the Log Publisher:
create sys log-config publisher telemetry_publisher destinations replace-all-with { telemetry_formatted }
Create the Log Profile(s) then attach to the appropriate virtual server (see Logging Profiles for the options):
Example virtual server definition:
create ltm virtual some_service destination 192.168.10.11:443 mask 255.255.255.255
Logging Profiles
You can use the following procedures to create different types of logging profiles.
- LTM Request Log profile
- Configuring CGNAT logging
- AFM Request Log profile
- ASM Log
- APM Log
- AVR Log
- System Log
LTM Request Log profile
The Request Logging profile gives you the ability to configure data within a log file for HTTP requests and responses, in accordance with specified parameters.
Note
Step 1 has been updated to include LTM response logging.
To configure an LTM request profile, use the following TMSH commands:
Note
All keys should be in lower case to enable classification (tenant/application).
Create an LTM Request Log Profile using the following TMSH command. Note: If you are creating the profile in the user interface, the
\are not required.
IMPORTANT: This step has been updated with the TS 1.18 release to include LTM response logging.create ltm profile request-log telemetry_traffic_log_profile request-log-pool telemetry request-log-protocol mds-tcp request-log-template event_source=\"request_logging\",hostname=\"$BIGIP_HOSTNAME\",client_ip=\"$CLIENT_IP\",server_ip=\"$SERVER_IP\",http_method=\"$HTTP_METHOD\",http_uri=\"$HTTP_URI\",virtual_name=\"$VIRTUAL_NAME\",event_timestamp=\"$DATE_HTTP\" request-logging enabled response-log-pool telemetry response-log-protocol mds-tcp response-log-template event_source=\"response_logging\",hostname=\"$BIGIP_HOSTNAME\",client_ip=\"$CLIENT_IP\",server_ip=\"$SERVER_IP\",http_method=\"$HTTP_METHOD\",http_uri=\"$HTTP_URI\",virtual_name=\"$VIRTUAL_NAME\",event_timestamp=\"$DATE_HTTP\",http_statcode=\"$HTTP_STATCODE\",http_status=\"$HTTP_STATUS\",response_ms=\"$RESPONSE_MSECS\" response-logging enabled
Attach the profile to the virtual server, for example:
modify ltm virtual some_service profiles add { telemetry_traffic_log_profile { context all } }
Example Output from BIG-IP Telemetry Streaming:
{
    "event_source":"request_logging",
    "event_timestamp":"2019-01-01:01:01.000Z",
    "hostname":"hostname",
    "client_ip":"192.168.2.42",
    "server_ip":"",
    "http_method":"GET",
    "http_uri":"/",
    "virtual_name":"/Common/app.app/app_vs",
    "tenant":"Common",
    "application":"app.app",
    "telemetryEventCategory": "LTM"
}
Configuring CGNAT logging
To configure carrier-grade network address translation (CGNAT), use the following guidance. For more information on CGNAT, see BIG-IP CGNAT: Implementations.
Note
You must have Carrier Grade NAT licensed and enabled to use CGNAT features.
- Configure the BIG-IP to send log messages about CGNAT processes. For instructions, see the CGNAT Implementations guide chapter on logging for your BIG-IP version. For example, for BIG-IP 14.0, see BIG-IP CGNAT: Implementations. Make sure of the following:
- The Large Scale NAT (LSN) Pool must use the BIG-IP Telemetry Streaming Log Publisher you created (telemetry_publisher if you used the BIG-IP AS3 example to configure BIG-IP TS logging).
If you have an existing pool, update the pool to use the BIG-IP TS Log Publisher:- TMSH:
modify ltm lsn-pool cgnat_lsn_pool log-publisher telemetry_publisher - GUI:
Carrier Grade NAT > LSN Pools > LSN Pools List
- TMSH:
- Create and attach a new CGNAT Logging Profile to the LSN pool. This determines what types of logs you wish to receive (optional).
- TMSH-create:
create ltm lsn-log-profile telemetry_lsn_log_profile { start-inbound-session { action enabled } } - TMSH-attach:
modify ltm lsn-pool cgnat_lsn_pool log-profile telemetry_lsn_log_profile - GUI:
Carrier Grade NAT -> Logging Profiles -> LSN
- TMSH-create:
- The Large Scale NAT (LSN) Pool must use the BIG-IP Telemetry Streaming Log Publisher you created (telemetry_publisher if you used the BIG-IP AS3 example to configure BIG-IP TS logging).
Example output:
{
     "ip_protocol":"TCP",
     "lsn_event":"LSN_DELETE",
     "start":"1562105093001",
     "cli":"X.X.X.X",
     "nat":"Y.Y.Y.Y",
     "duration":"5809",
     "pem_subscriber_id":"No-lookup",
     "telemetryEventCategory":"CGNAT"
}
AFM Request Log profile
Create a Security Log Profile.
create security log profile telemetry_afm_security_log_profile network replace-all-with { telemetry { filter { log-acl-match-drop enabled log-acl-match-reject enabled log-ip-errors enabled log-tcp-errors enabled log-tcp-events enabled } publisher telemetry_publisher } } application add { telemetry { servers add { 255.255.255.254:6514 } filter add { request-type { values add { illegal-including-staged-signatures } } } local-storage disabled logger-type remote remote-storage splunk protocol tcp } }
Attach the profile to the virtual server, for example:
modify ltm virtual some_service security-log-profiles add { telemetry_afm_security_log_profile }
Example output from BIG-IP Telemetry Streaming:
{
    "acl_policy_name":"/Common/app",
    "acl_policy_type":"Enforced",
    "acl_rule_name":"ping",
    "action":"Reject",
    "hostname":"telemetry.bigip.com",
    "bigip_mgmt_ip":"10.0.1.100",
    "context_name":"/Common/app.app/app_vs",
    "context_type":"Virtual Server",
    "date_time":"Dec 17 2018 22:46:04",
    "dest_fqdn":"unknown",
    "dest_ip":"10.0.2.101",
    "dst_geo":"Unknown",
    "dest_port":"80",
    "device_product":"Advanced Firewall Module",
    "device_vendor":"F5",
    "device_version":"14.0.0",
    "drop_reason":"Policy",
    "errdefs_msgno":"23003137",
    "errdefs_msg_name":"Network Event",
    "flow_id":"0000000000000000",
    "ip_protocol":"TCP",
    "severity":"8",
    "partition_name":"Common",
    "route_domain":"0",
    "sa_translation_pool":"",
    "sa_translation_type":"",
    "source_fqdn":"unknown",
    "source_ip":"192.168.0.1",
    "src_geo":"US/Washington",
    "source_port":"62204",
    "source_user":"unknown",
    "source_user_group":"unknown",
    "translated_dest_ip":"",
    "translated_dest_port":"",
    "translated_ip_protocol":"",
    "translated_route_domain":"",
    "translated_source_ip":"",
    "translated_source_port":"",
    "translated_vlan":"",
    "vlan":"/Common/external",
    "send_to_vs":"",
    "tenant":"Common",
    "application":"app.app",
    "telemetryEventCategory":"AFM"
}
ASM Log
Create a Security Log Profile:
create security log profile telemetry_asm_security_log_profile application replace-all-with { telemetry { filter replace-all-with { request-type { values replace-all-with { all } } } logger-type remote remote-storage splunk servers replace-all-with { 255.255.255.254:6514 {} } } }
Attach the profile to the virtual server, for example:
modify ltm virtual some_service security-log-profiles add { telemetry_asm_security_log_profile }
Example Output from BIG-IP Telemetry Streaming:
{
    "hostname":"hostname",
    "management_ip_address":"10.0.1.4",
    "management_ip_address_2":"",
    "http_class_name":"/Common/app.app/app_policy",
    "web_application_name":"/Common/app.app/app_policy",
    "policy_name":"/Common/app.app/app_policy",
    "policy_apply_date":"2018-11-19 22:17:57",
    "violations":"Evasion technique detected",
    "support_id":"1730614276869062795",
    "request_status":"blocked",
    "response_code":"0",
    "ip_client":"192.168.0.1",
    "route_domain":"0",
    "method":"GET",
    "protocol":"HTTP",
    "query_string":"",
    "x_forwarded_for_header_value":"192.168.0.1",
    "sig_ids":"",
    "sig_names":"",
    "date_time":"2018-11-19 22:34:40",
    "severity":"Critical",
    "attack_type":"Detection Evasion,Path Traversal",
    "geo_location":"US",
    "ip_address_intelligence":"N/A",
    "username":"N/A",
    "session_id":"f609d8a924419638",
    "src_port":"49804",
    "dest_port":"80",
    "dest_ip":"10.0.2.10",
    "sub_violations":"Evasion technique detected:Directory traversals",
    "virus_name":"N/A",
    "violation_rating":"3",
    "websocket_direction":"N/A",
    "websocket_message_type":"N/A",
    "device_id":"N/A",
    "staged_sig_ids":"",
    "staged_sig_names":"",
    "threat_campaign_names":"",
    "staged_threat_campaign_names":"",
    "blocking_exception_reason":"N/A",
    "captcha_result":"not_received",
    "uri":"/directory/file",
    "fragment":"",
    "request":"GET /admin/..%2F..%2F..%2Fdirectory/file HTTP/1.0\\r\\nHost: host.westus.cloudapp.azure.com\\r\\nConnection: keep-alive\\r\\nCache-Control: max-age",
    "tenant":"Common",
    "application":"app.app",
    "telemetryEventCategory": "ASM"
}
APM Log
Create an APM Log Profile. For example:
create apm log-setting telemetry access replace-all-with { access { publisher telemetry_publisher } }
Attach the profile to the APM policy.
Attach the profile to the virtual server, for example:
modify ltm virtual <VIRTUAL_SERVER_NAME> profiles add { telemetry { context all } }
Example Output from BIG-IP Telemetry Streaming:
{
    "hostname":"telemetry.bigip.com",
    "errdefs_msgno":"01490102:5:",
    "partition_name":"Common",
    "session_id":"ec7fd55d",
    "Access_Profile":"/Common/access_app",
    "Partition":"Common",
    "Session_Id":"ec7fd55d",
    "Access_Policy_Result":"Logon_Deny",
    "tenant":"Common",
    "application":"",
    "telemetryEventCategory":"APM",
    "f5telemetry_timestamp": "2020-12-03T22:10:07.783Z"
}
System Log
Modify the system syslog configuration by adding a destination, using the following TMSH command:
modify sys syslog remote-servers replace-all-with { server { host 127.0.0.1 remote-port 6514 } }
Modify system logging configuration to update what gets logged:
modify sys daemon-log-settings mcpd audit enabled
Example output:
{
    "data":"<85>Feb 12 21:39:43 telemetry notice sshd[22277]: pam_unix(sshd:auth): authentication failure; logname= uid=0 euid=0 tty=ssh ruser= rhost=192.168.0.1  user=root",
    "telemetryEventCategory":"syslog"
}
Character Encoding information
F5 logs may contain various character encoding or byte streams that include illegal characters for a specific encoding, or invalid UTF-8 strings. BIG-IP TS does not currently enforce validation of the data that an event listener receives. It simply attempts to convert the raw input it receives into a JSON-formatted string for forwarding.
Note
Varying character encodings and illegal characters in the byte streams are very common in BIG-IP ASM logs.
For example, the following “message” is sent through TCP (input) and shows the received data in a format that will be handed off for forwarder use (output):
let message = 'policy_name="some_test",key1="это безопасно",key2="U+0000 = fc 80 80 80 80 80 = "������"",key3="ひほわれよ HЯ⾀ U+FFFF = ef bf bf = """';
The following shows the input sent as different buffers, and the resulting output:
Input:
Sent as buffer (default utf-8)
Output:{ "data": { "policy_name": "some_test", "key1": "это безопасно", "key2": "U+0000 = fc 80 80 80 80 80 = \"������\"", "key3": "ひほわれよ HЯ⾀ U+FFFF = ef bf bf = \"\"", "telemetryEventCategory": "ASM" }, "type": "ASM" }
Input:
Sent as buffer (utf16le)
Output:{ "data": { "data": "p\u0000o\u0000l\u0000i\u0000c\u0000y\u0000_\u0000n\u0000a\u0000m\u0000e\u0000=\u0000 \"\u0000s\u0000o\u0000m\u0000e\u0000_\u0000t\u0000e\u0000s\u0000t\u0000\"\u0000,\u0000k\u0000e\u0000y \u00001\u0000=\u0000\"\u0000M\u0004B\u0004>\u0004 \u00001\u00045\u00047\u0004>\u0004?\u00040\u0004A\u 0004=\u0004>\u0004\"\u0000,\u0000k\u0000e\u0000y\u00002\u0000=\u0000\"\u0000U\u0000+\u00000\u00000\u0 0000\u00000\u0000 \u0000=\u0000 \u0000f\u0000c\u0000 \u00008\u00000\u0000 \u00008\u00000\u0000 \u0000 8\u00000\u0000 \u00008\u00000\u0000 \u00008\u00000\u0000 \u0000=\u0000 \u0000\"\u0000������������\"\u 0000\"\u0000,\u0000k\u0000e\u0000y\u00003\u0000=\u0000\"\u0000r0{0�0�0�0 \u0000H\u0000/\u0004�/ \u000 0U\u0000+\u0000F\u0000F\u0000F\u0000F\u0000 \u0000=\u0000 \u0000e\u0000f\u0000 \u0000b\u0000f\u0000 \ u0000b\u0000f\u0000 \u0000=\u0000 \u0000\"\u0000��\"\u0000\"\u0000", "telemetryEventCategory": "event" }, "type": "event" }
Input:
Sent as buffer (ascii)
Output:{ "data": { "policy_name": "some_test", "key1": "MB> 157>?0A=>", "key2": "U+0000 = fc 80 80 80 80 80 = \"������\"", "key3": "r{��� H/� U+FFFF = ef bf bf = \"�\"", "telemetryEventCategory": "ASM" }, "type": "ASM" }