F5 BIG-IP Next > Class 1: Introduction to BIG-IP Next > Module 8: Operations Source | Edit on
Lab 8.1 - Debug BIG-IP Next Instance
You can enable a Debug Session that will allow you to SSH to a BIG-IP Next instance to run network troubleshooting tools like ping and tcpdump.
In this lab exercise we will use a pre-created SSH key to configure a Debug Session on BIG-IP Next via Central Manager.
Once connected to the Debug Session we will inspect some basic network configuration, examine the isolation of the data plane process, and run some commands to observe live network traffic and logs.
8.1.1 - Start Debug Session
Click the workspace switcher next to the F5 icon, and click Infrastructure.

Click on the Name of BIG-IP Next instance “big-ip-next-03.f5demo.com”
Click on the Debug tab (you may need to scroll the window down to see Debug)

You will see a screen that lists the requirements. Click on Proceed
Copy the following SSH key (you can click on the Copy icon if you float your mouse to the top right of the text)
ssh-rsa AAAAB3NzaC1yc2EAAAADAQABAAABAQC+Nn+twlYTptgkQRs9EKHtA8HfO177bdtxO6+bEXJc2DKGrEXlmfAlQz/PVQJy+iaDvP50HymDAevrZi0KwXajVBkK6KaESbcKK2vz5kvYRumOc5UrfxysyAaWHn/he7Uhft5TRakVQlolU+EaC2PDotMkeSkxBG893+CW57olxFxQgwcz8jF7MiftTV+HexmqTldCSrfOxRlaSu6n4hiXXgyth3247NACOUGU8I89XoEIWchdx6iEcF6inweUS0CNfChzRSI5fzLVLaacYB+MmljDGcKdz0MqP0VPs4aKUuLIGgsJqjajta8Raoj0Ws6PgABJo4U4DgDTelQXKtbZ f5debuguser
Illustration of how to copy the key into your clipboard

Paste in the SSH key

Warning
Verify that you only paste a single line into the text box. A newline character will cause a format error. Only a single SSH key can be entered
Click on Start Debug Session
Warning
Only a single Debug Session can run on an instance at a time.
You should see a Prompt to SSH. We will be using the Putty SSH client to connect later in this lab from the Windows host in the lab environment.
You should see the following
ssh admin@10.1.1.10 -p 2222
8.1.2 - Connect to Windows Host
We will use a Putty SSH client that has been pre-configured with the SSH key that was previously used to start the Debug Session
To connect to the Windows Host there are two choices for clients that can be used, as not all attendees will be able to use Remote Desktop.
Option 1.) Log into the Windows Jumphost using the RDP option in the main UDF screen.
Option 2.) Use the Guacamole HTML based RDP client on the Ubuntu Jumphost (recommended for those that cannot install RDP).
For Windows RDP users:
Go to the UDF Deployment screen and select the Access dropdown for Windows Jumphost, then RDP. This will download an RDP shortcut to your machine.

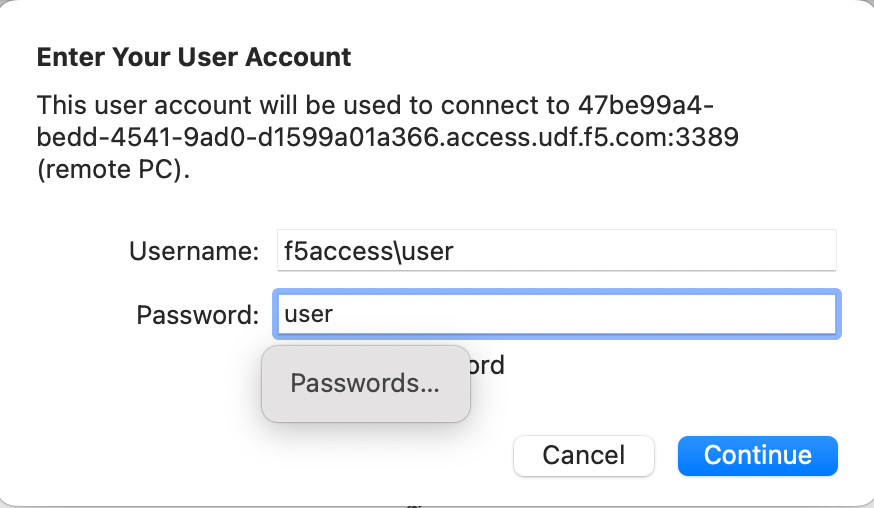
Open the RDP shortcut to connect to the Windows Jumphost. Provide the credentials shown below and log in.
Username
f5access\user
Password
user
For Guacamole (Non RDP) users:
Go to the UDF Deployment screen, and select the Access dropdown for Ubuntu Jumphost, then Guacamole. This will open an HTML-based RDP client.

Provide the credentials shown below and log in.
Username
user
Password
user

Then select the Windows Jumphost option.

8.1.3 - Connect to Debug Session
Launch Putty. The Putty SSH client should be located on the bottom left of the screen.

Select and load the big-ip-next-instance-3-debug profile. This session has been pre-configured with the SSH key that was used to start the Debug Session and to connect to instance 3 at the IP address 10.1.1.10 via port 2222.

Click on Open
Accept SSH Host Key (click on Accept). You must accept the SSH Host key to connect.
You should now see the following:
Using username "admin".
Authenticating with public key "f5debuguser"
Warning: Permanently added '[100.76.0.27]:2222' (ECDSA) to the list of known hosts.
****************************************
*                                      *
* Welcome to BIG-IP Next Debug Console *
*                                      *
****************************************
/
8.1.3 - Debug Session Isolation
The debug session runs in an isolated environment that has limited visibility to the platform.
Run the command
ps auxand you should see a limited number of processes./ps aux USER PID %CPU %MEM VSZ RSS TTY STAT START TIME COMMAND f5docker 1 0.0 0.0 711900 1980 ? Ssl 16:01 0:00 /init f5docker 24 0.0 0.0 3044 1256 ? S 16:01 0:00 s6-svscan -c3 f5docker 28 0.0 0.0 3056 1244 ? S 16:01 0:00 s6-supervise f5docker 29 0.0 0.0 2920 992 ? Ss 16:01 0:00 /bin/sh -e /u f5docker 30 0.0 0.0 711916 8192 ? Sl 16:01 0:00 /usr/bin/qkvi root 54 0.0 0.0 15420 5368 ? Ss 16:01 0:00 sshd: /usr/sb f5docker 59 0.0 0.0 2920 208 ? S 16:01 0:00 /bin/sh -e /u f5docker 61 0.0 0.0 3020 1208 ? S 16:01 0:00 inotifywait - f5docker 63 0.0 0.0 3020 1204 ? S 18:58 0:00 inotifywait - root 64 0.0 0.0 15896 9692 ? Ss 18:58 0:00 sshd: debugus debugus+ 68 0.0 0.0 16156 7040 ? D 18:58 0:00 sshd: debugus debugus+ 69 0.0 0.0 4624 3800 pts/0 Ss 18:58 0:00 -bash debugus+ 74 0.0 0.0 7060 1548 pts/0 R+ 19:02 0:00 ps aux /
8.1.3 - Debug Session View Config
The Debug Session has access to viewing information about the data-plane.
Run the command
ip aYou will see an output that includes the data-plane VLANs and self-IPs that have been configure on this device.
Note
This is an interpretation of what the data-plane process sees and not all counters may reflect true values like MTU and state.
/ip a
...
5: vlan-3000: <BROADCAST,MULTICAST,UP,LOWER_UP> mtu 1500 qdisc fq_codel state UNKNOWN group default qlen 1000
    link/ether 52:54:00:05:55:cc brd ff:ff:ff:ff:ff:ff
    inet 10.1.20.10/24 brd 10.1.20.255 scope global vlan-3000
      valid_lft forever preferred_lft forever
    inet6 fe80::5054:ff:fe05:55cc/64 scope link
      valid_lft forever preferred_lft forever
    inet6 fe80::841d:11ff:fe41:1d5d/64 scope link
      valid_lft forever preferred_lft forever
6: vlan-4000: <BROADCAST,MULTICAST,UP,LOWER_UP> mtu 1500 qdisc fq_codel state UNKNOWN group default qlen 1000
    link/ether 52:54:00:e3:b3:76 brd ff:ff:ff:ff:ff:ff
    inet 10.1.10.10/24 brd 10.1.10.255 scope global vlan-4000
      valid_lft forever preferred_lft forever
    inet6 fe80::5054:ff:fee3:b376/64 scope link
      valid_lft forever preferred_lft forever
    inet6 fe80::6c2c:25ff:fefe:3dd4/64 scope link
      valid_lft forever preferred_lft forever
8.1.4 - Debug Session Basic Commands
In the following exercise we will review how you can use ping, tcpdump, and view logs from the data-plane (TMM)
Run the command
ping -c 4 10.1.20.4You should see the following output. The traffic is originating from the 10.1.20.10 self-ip.
/ping -c 4 10.1.20.4
PING 10.1.20.4 (10.1.20.4) 56(84) bytes of data.
64 bytes from 10.1.20.4: icmp_seq=1 ttl=64 time=4.76 ms
64 bytes from 10.1.20.4: icmp_seq=2 ttl=64 time=1.50 ms
64 bytes from 10.1.20.4: icmp_seq=3 ttl=64 time=2.17 ms
64 bytes from 10.1.20.4: icmp_seq=4 ttl=64 time=1.90 ms

--- 10.1.20.4 ping statistics ---
4 packets transmitted, 4 received, 0% packet loss, time 3004ms
rtt min/avg/max/mdev = 1.503/2.584/4.758/1.277 ms
/
Run the command
tcpdump -i vlan-3000 port 3000 -c 4/tcpdump -i vlan-3000 port 3000 -c 4 tcpdump: verbose output suppressed, use -v[v]... for full protocol decode listening on vlan-3000, link-type EN10MB (Ethernet), snapshot length 65535 bytes 19:41:01.486963 IP 10.1.20.10.58506 > 10.1.20.101.3000: Flags [S], seq 2794701663, win 23360, options [mss 1460,nop,wscale 0,sackOK,TS val 2589746862 ecr 0], length 0 out slot1/tmm2 lis=mon_ivs_http port=1.2 trunk= 19:41:01.488439 IP 10.1.20.101.3000 > 10.1.20.10.58506: Flags [S.], seq 3304685922, ack 2794701664, win 65160, options [mss 1460,sackOK,TS val 501170450 ecr 2589746862,nop,wscale 7], length 0 in slot1/tmm2 lis=mon_ivs_http port=1.2 trunk= 19:41:01.488548 IP 10.1.20.10.58506 > 10.1.20.101.3000: Flags [.], ack 1, win 23360, options [nop,nop,TS val 2589746863 ecr 501170450], length 0 out slot1/tmm2 lis=mon_ivs_http port=1.2 trunk= 19:41:01.488577 IP 10.1.20.10.58506 > 10.1.20.101.3000: Flags [P.], seq 1:46, ack 1, win 23360, options [nop,nop,TS val 2589746863 ecr 501170450], length 45 out slot1/tmm2 lis=mon_ivs_http port=1.2 trunk= 4 packets captured 4 packets received by filter 0 packets dropped by kernel
Tip
You can also use 0.0 to listen on all interfaces or the interface name (1.2)
Run the command
tail -4 /logs/f5-fsm-tmm-0.logThis will allow you to see the last 4 entries from the TMM log (/var/log/ltm)
The format is compatible with OpenTelemetry
/tail -4 /logs/f5-fsm-tmm-0.log
{"ts":"2023-09-15 19:40:54.167656 UTC","ct":"f5-fsm-tmm","stream":"0","scid":"unknown","sysid":"d38ea2dc-ac9a-4731-8618-b371d56ffb1d","log":"\u003c133\u003eSep 15 19:40:54 f5-fsm-tmm-569897896c-6wsnh tmm[8]: 013e0002:5: \"v\"=\"1.0\";\"lt\"=\"T\";\"l\"=\"notice\";\"LocalAddress\"=\"169.254.0.1\";\"LocalPort\"=\"2\";\"RemoteAddress\"=\"169.254.0.253\";\"RemotePort\"=\"46927\";\"m\"=\"Tcpdump stopping on 169.254.0.1:2 from 169.254.0.253:46927\""}
{"ts":"2023-09-15 19:41:00.269114 UTC","ct":"f5-fsm-tmm","stream":"0","scid":"unknown","sysid":"d38ea2dc-ac9a-4731-8618-b371d56ffb1d","log":"\u003c133\u003eSep 15 19:41:00 f5-fsm-tmm-569897896c-6wsnh tmm[8]: 013e0000:5: \"v\"=\"1.0\";\"lt\"=\"T\";\"l\"=\"notice\";\"LocalAddress\"=\"169.254.0.1\";\"LocalPort\"=\"2\";\"RemoteAddress\"=\"169.254.0.253\";\"RemotePort\"=\"46483\";\"m\"=\"Tcpdump starting locally on 169.254.0.1:2 from 169.254.0.253:46483\""}
{"ts":"2023-09-15 19:41:00.269447 UTC","ct":"f5-fsm-tmm","stream":"0","scid":"unknown","sysid":"d38ea2dc-ac9a-4731-8618-b371d56ffb1d","log":"\u003c133\u003eSep 15 19:41:00 f5-fsm-tmm-569897896c-6wsnh tmm[8]: 013e000b:5: \"v\"=\"1.0\";\"lt\"=\"T\";\"l\"=\"notice\";\"DPTProviderName\"=\"Noise Provider \";\"m\"=\"Tcpdump starting DPT providers:Noise Provider \""}
{"ts":"2023-09-15 19:41:02.269566 UTC","ct":"f5-fsm-tmm","stream":"0","scid":"unknown","sysid":"d38ea2dc-ac9a-4731-8618-b371d56ffb1d","log":"\u003c133\u003eSep 15 19:41:02 f5-fsm-tmm-569897896c-6wsnh tmm[8]: 013e0002:5: \"v\"=\"1.0\";\"lt\"=\"T\";\"l\"=\"notice\";\"LocalAddress\"=\"169.254.0.1\";\"LocalPort\"=\"2\";\"RemoteAddress\"=\"169.254.0.253\";\"RemotePort\"=\"46483\";\"m\"=\"Tcpdump stopping on 169.254.0.1:2 from 169.254.0.253:46483\""}
Tip
You could also use
tail -fto see a live / streaming view of the logs
8.1.5 - Stop Debug Session
Go back to Central Manager and click on Stop Debug Session
This should cause your Putty session to end
This concludes the BIG-IP Next opertional debugging lab. Thank you!