F5 Application Study Tool Labs > Class 1: Introduction to F5 Application Study Tool > Module 1: An Overview of F5 AST Source | Edit on
Section 1 - What Problem Does this Address and Why?
So… What’s the Problem?
Attention
Remember the last time an incident or trouble ticket found its new home in your queue?
Did any tools immediately come to mind which would have helped the triage process?
Were you confident in your ability to track down data that helped identify the root cause and begin working towards mitigation?
We’re fairly certain we have a good idea as to what some of those answers may entail!
Having rich operational data plays a huge part in answering technical and business-related questions that may arise during both normal operations and times of trouble.
To an F5 BIG-IP administrator, engineer, or operator, these questions are incredibly important, as they can ultimately help reduce the time it takes to clear a ticket from your queue and go about your day (or night).
Given F5 BIG-IP’s integral part in the path of delivering applications and data, having insight as to what’s happening within the BIG-IP estate and ecosystem is critical. With the prevalence of metrics and datapoints available under the hood of BIG-IP, alongside the flexibility of OpenTelemetry (OTel) and tools such as Prometheus and Grafana, value-added information has never been easier to obtain and deliver.
The F5 Application Study Tool aims to address the needs of your team and broader organization by significantly reducing the complexity and effort required to deliver such solutions at scale. At F5, we’ve heard, seen, and experienced first-hand these impediments, and are receiving overwhelmingly-positive feedback from customers presently using F5 AST.
How Does it Work?
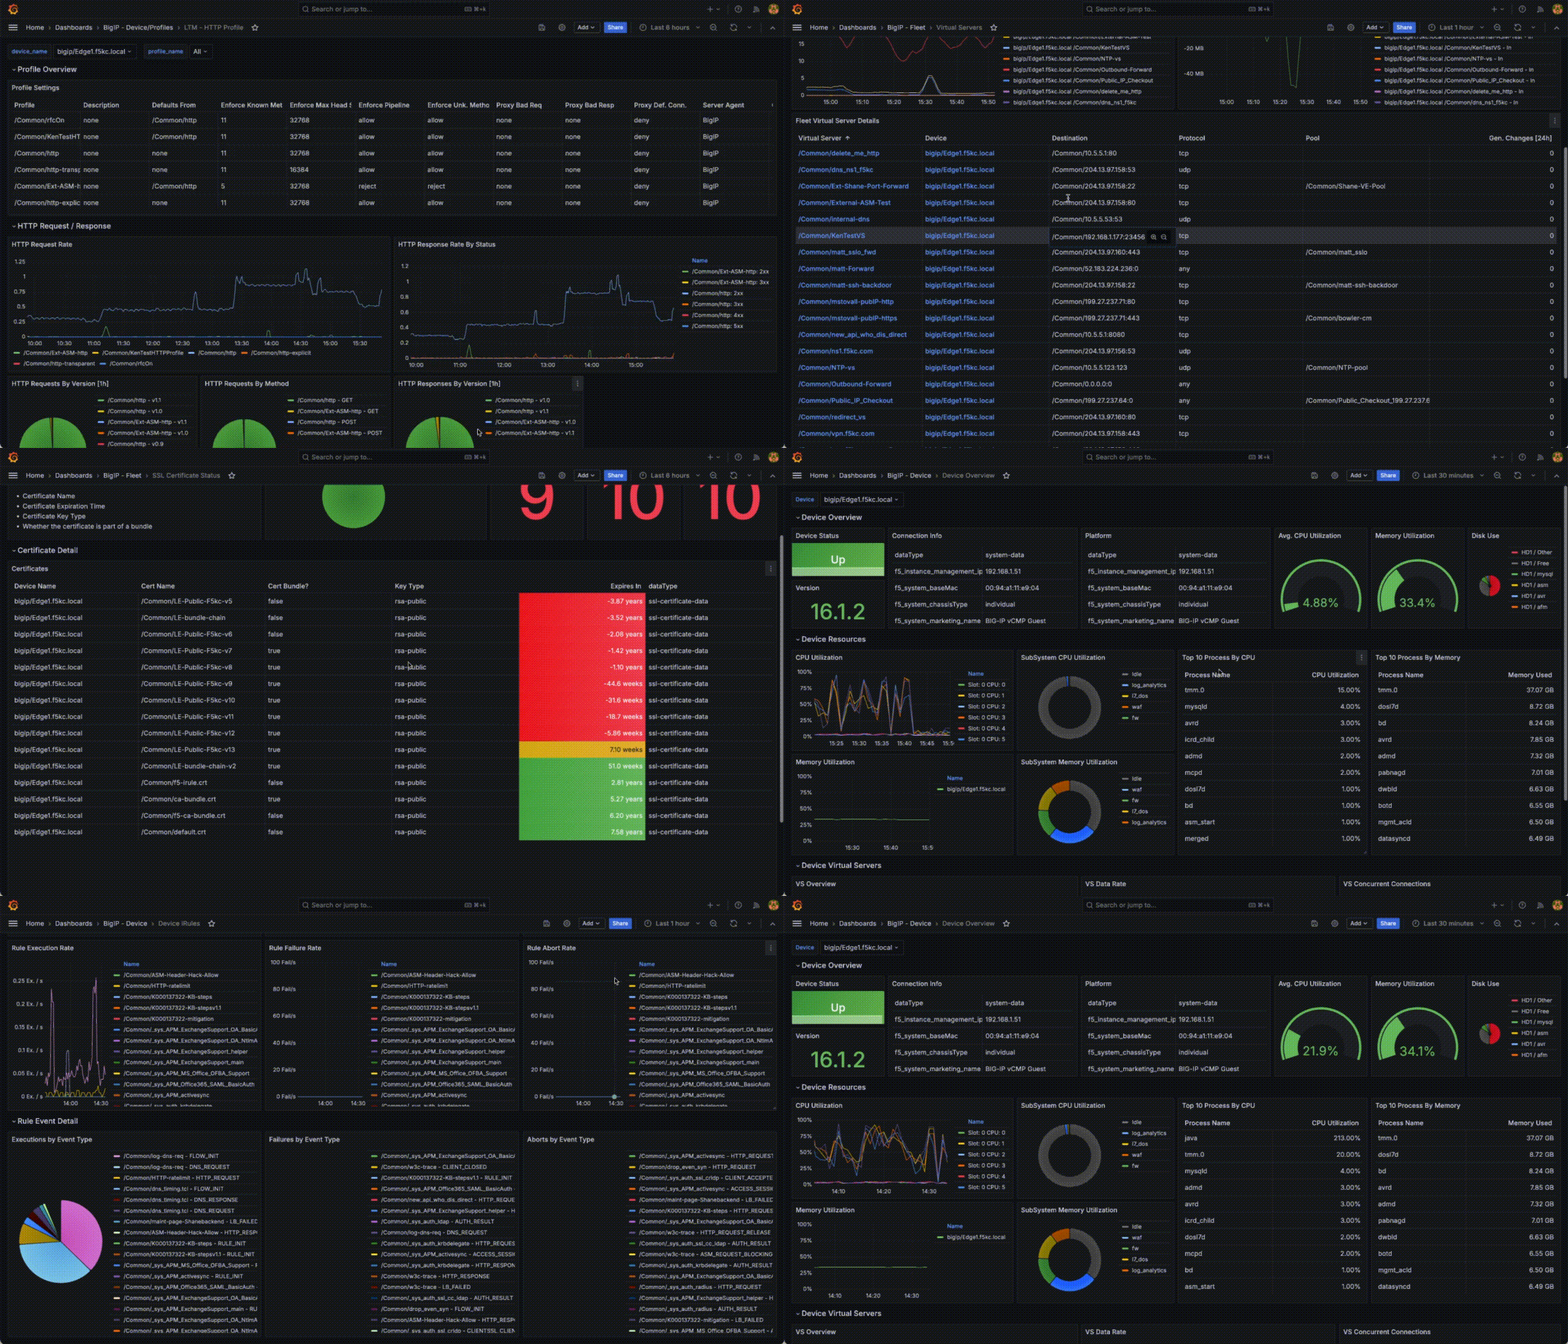
A custom OTel Collector, integrated with F5 BIG-IP data receivers, transforms your data into actionable intelligence, stored in a Prometheus timeseries database, and visualized through pre-configured Grafana dashboards. Whether you’re managing a single device or an entire fleet, the F5 AST empowers opportunities to optimize your operations with quick, reliable application insights.
There is an exhaustive list of metrics collected, some of which have been exposed through the pre-built dashboards included.
However, this is just a starting point. Although many F5 BIG-IP customers are interested in the same metrics and analytics, there are unique requirements and use cases in just about every estate. The framework of OTel and open-source set the stage for enabling nearly-limitless flexibility.

In order to take advantage of the F5 AST, one must simply have the means by which to run Git Client and Docker (or compatible) container environment.
Installation can be performed via GitHub repo or by downloading the source tarball from the GitHub repo’s release section. These details are covered in Module 2: Installing, Configuring, Updating, and Accessing the F5 AST.
Post installation, configuration is straightforward and approachable, enabling you to start collecting your F5 BIG-IP data within a matter of minutes. You need only follow a few basic steps to set up the environment, device credentials, device list, and start the containers.
You may also enable data export to F5, allowing your account engineer to view the very same metrics you see. This can be invaluable when looking for assistance from your helpful F5 solutions engineer or architect!
Note
There’s additional granularity in terms of customizing the Grafana instance and modifying the metrics collection interval, which can be found in the F5 AST Docsite.
Please select Next below and continue on to Section 2 - A High-Level Overview of Containerization