F5 Application Study Tool Labs > Class 1: Introduction to F5 Application Study Tool > Module 4: Exploring the F5 Local API Discovery Tool Source | Edit on
Accessing the F5 LADT Instance Dashboards
We’ve pre-provisioned an instance of F5 LADT in the UDF lab environment. It’s ready for you to dive in and take a look. Just follow the instructions below!
Accessing F5 LADT Grafana Instance
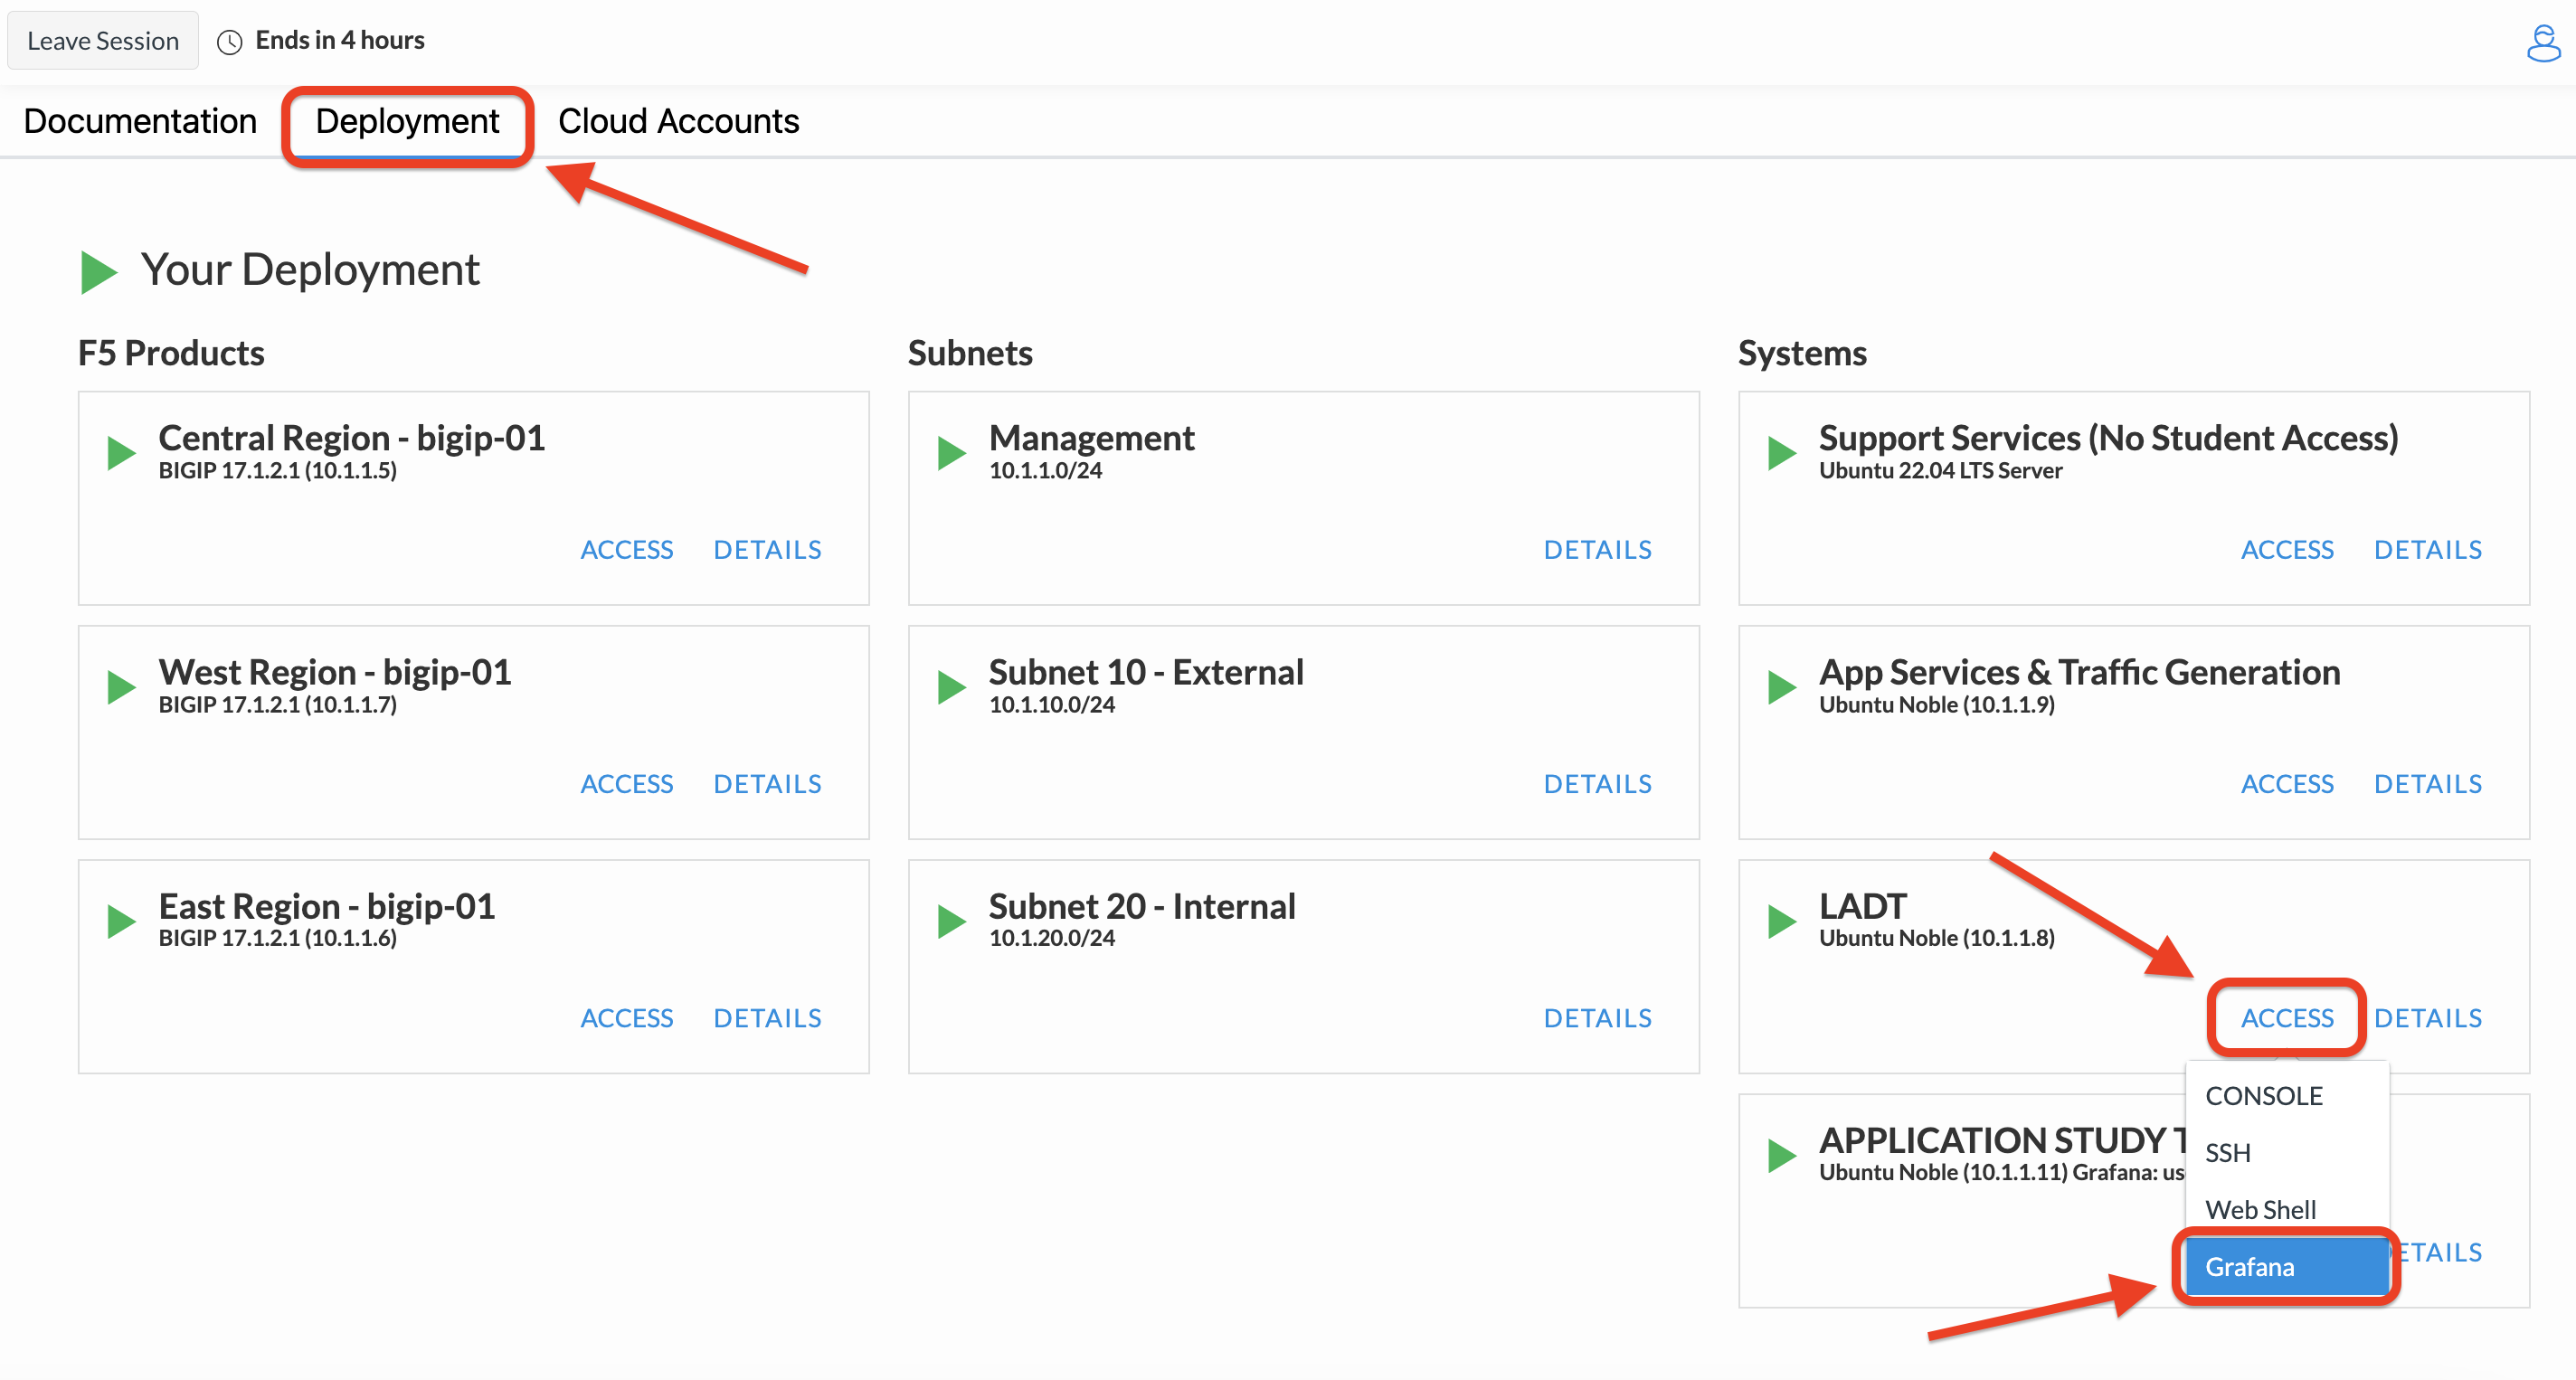
From within the UDF course deployment’s LADT System, locate and select ACCESS, then Grafana.
Once the new browser tab has loaded, you will be presented with the self-installed F5 LADT Grafana login. Enter the following credentials and select Log in.
Username
adminPassword
11F5Networks11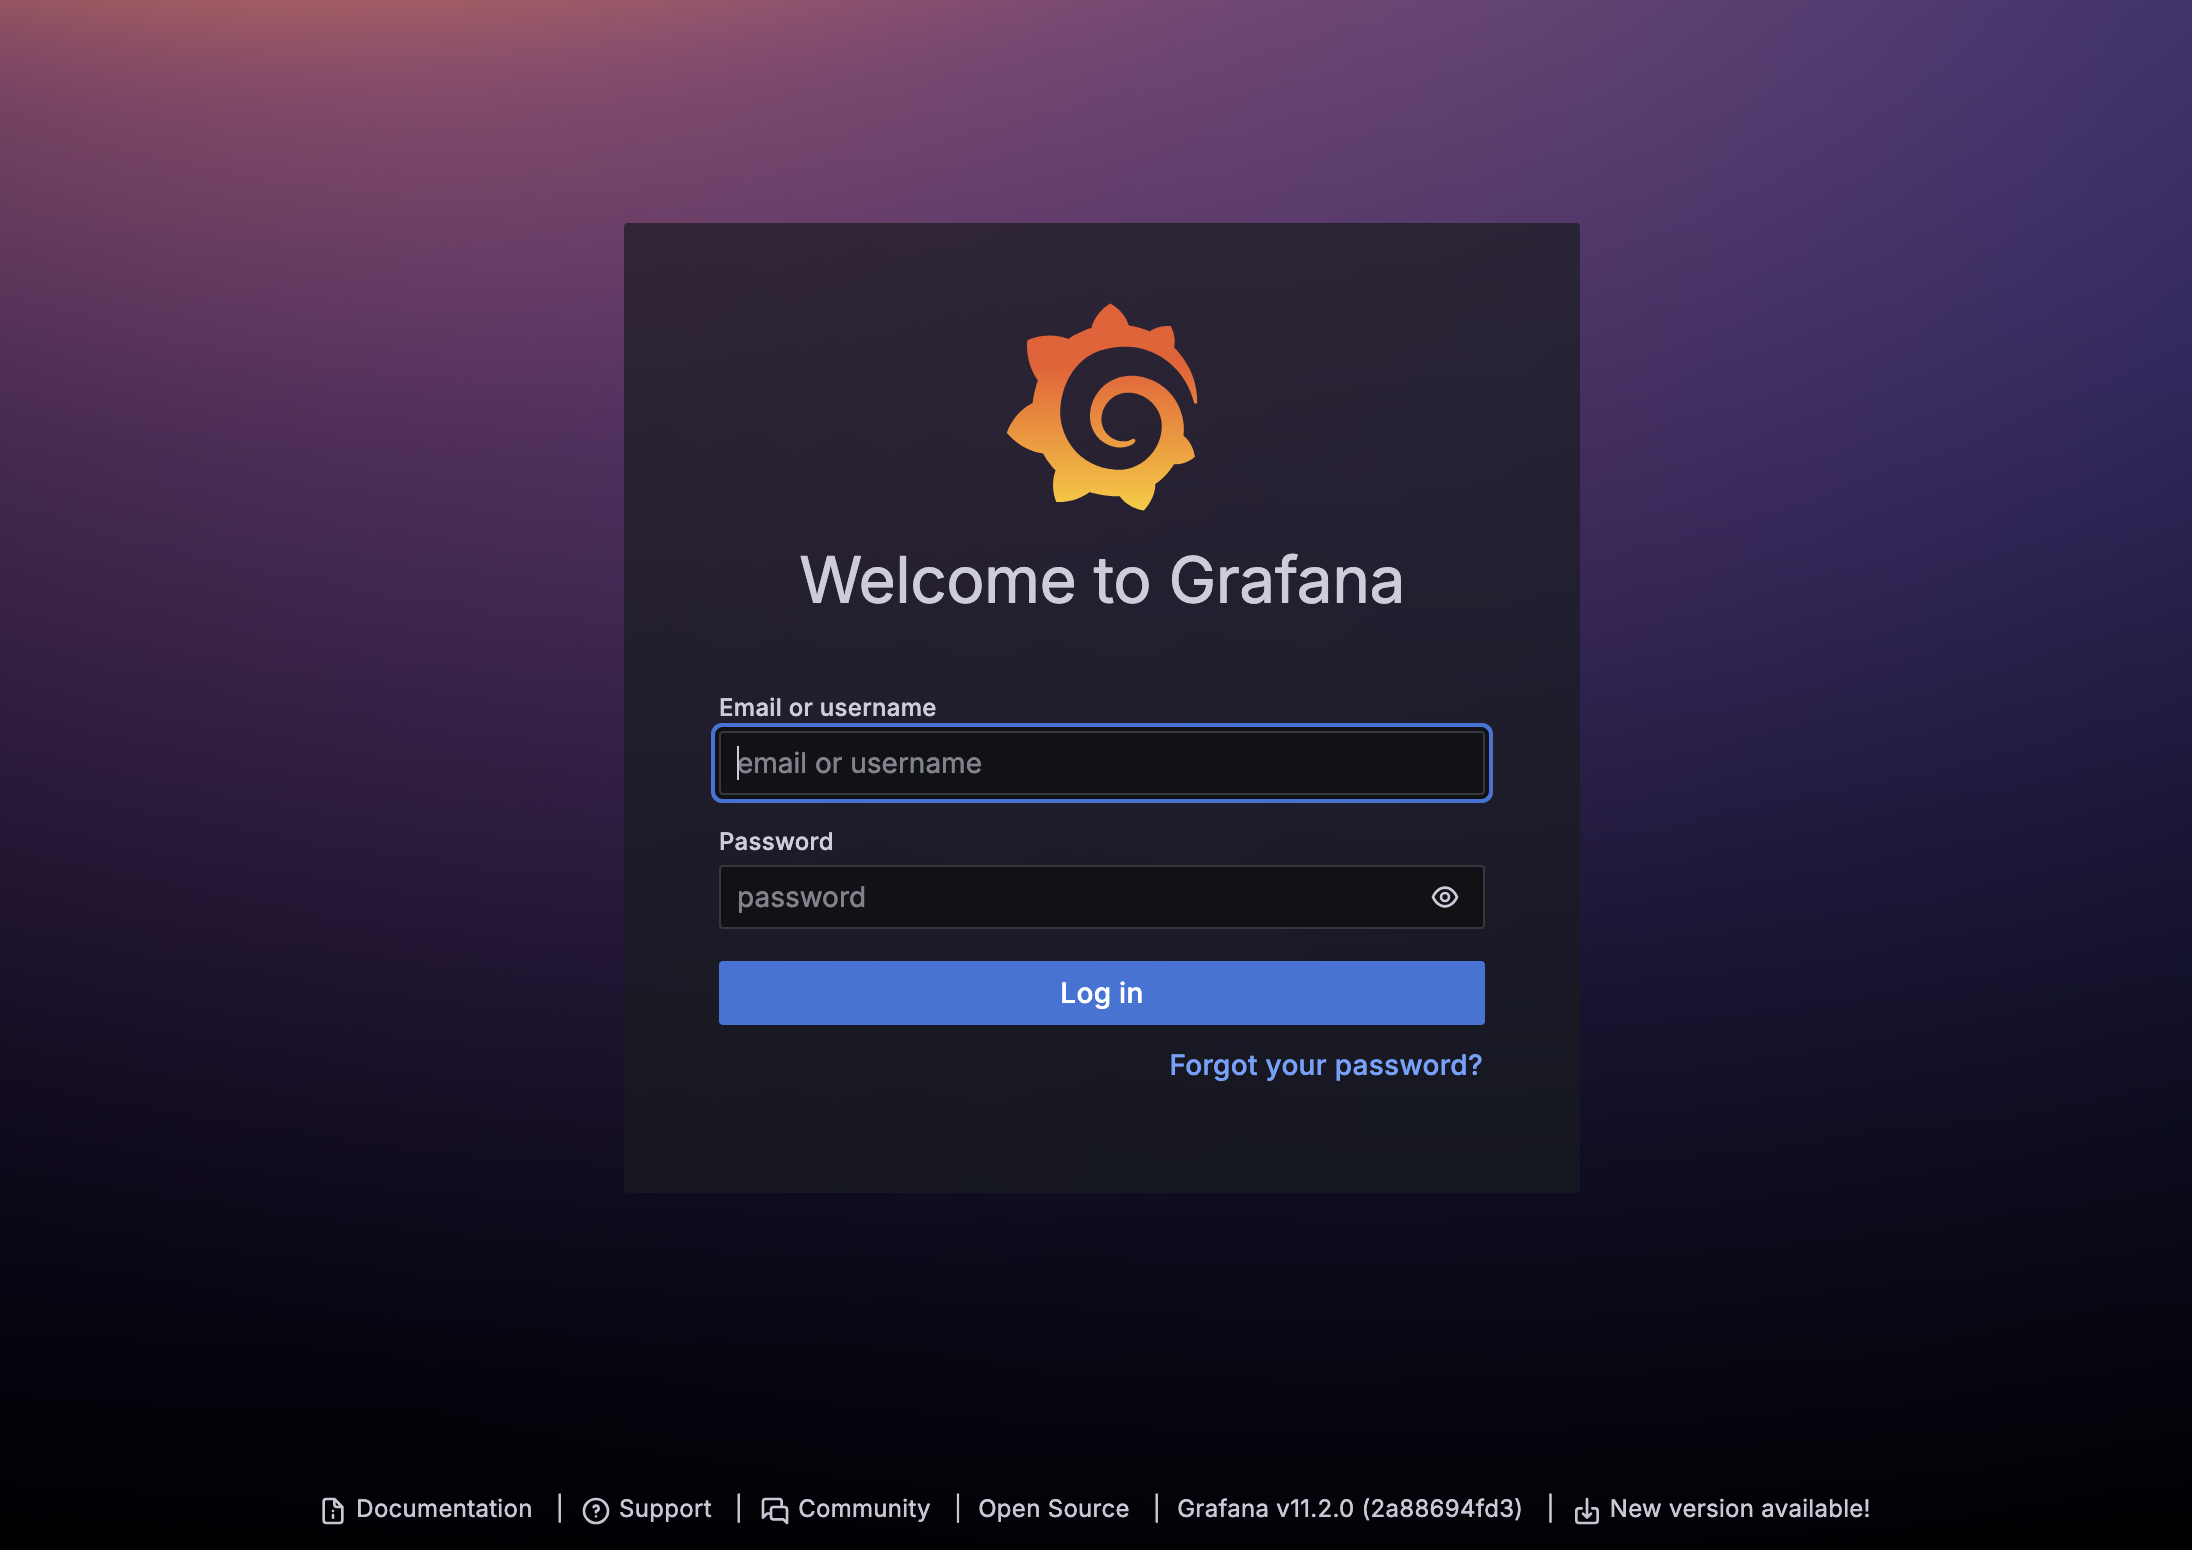
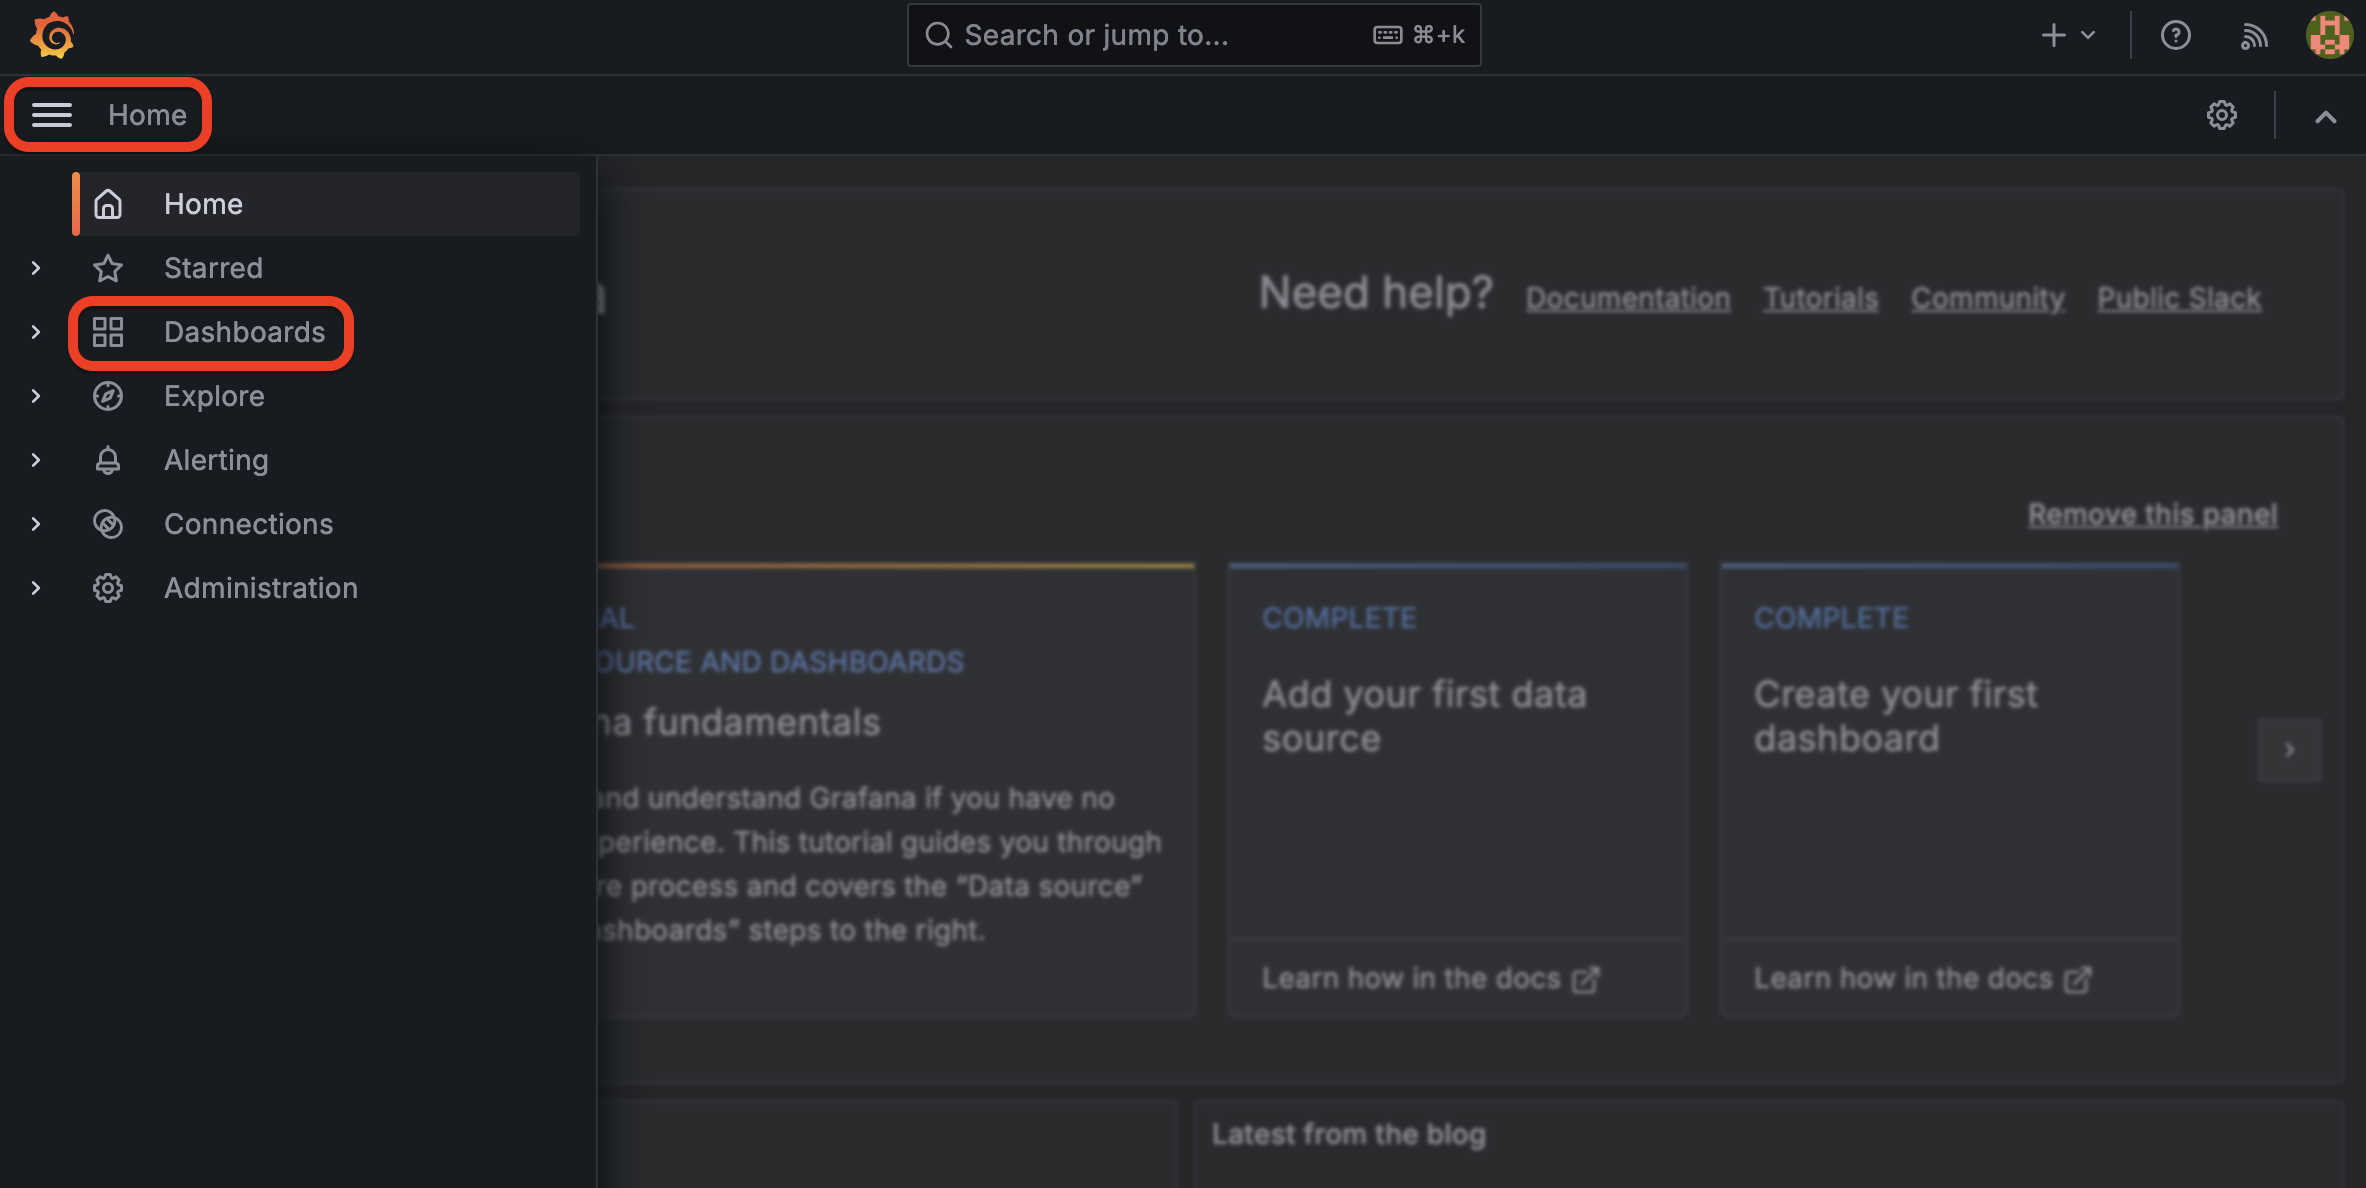
You’ll be presented with the Grafana homepage. From here, select the hamburger menu next to Home in the upper left corner, then Dashboards
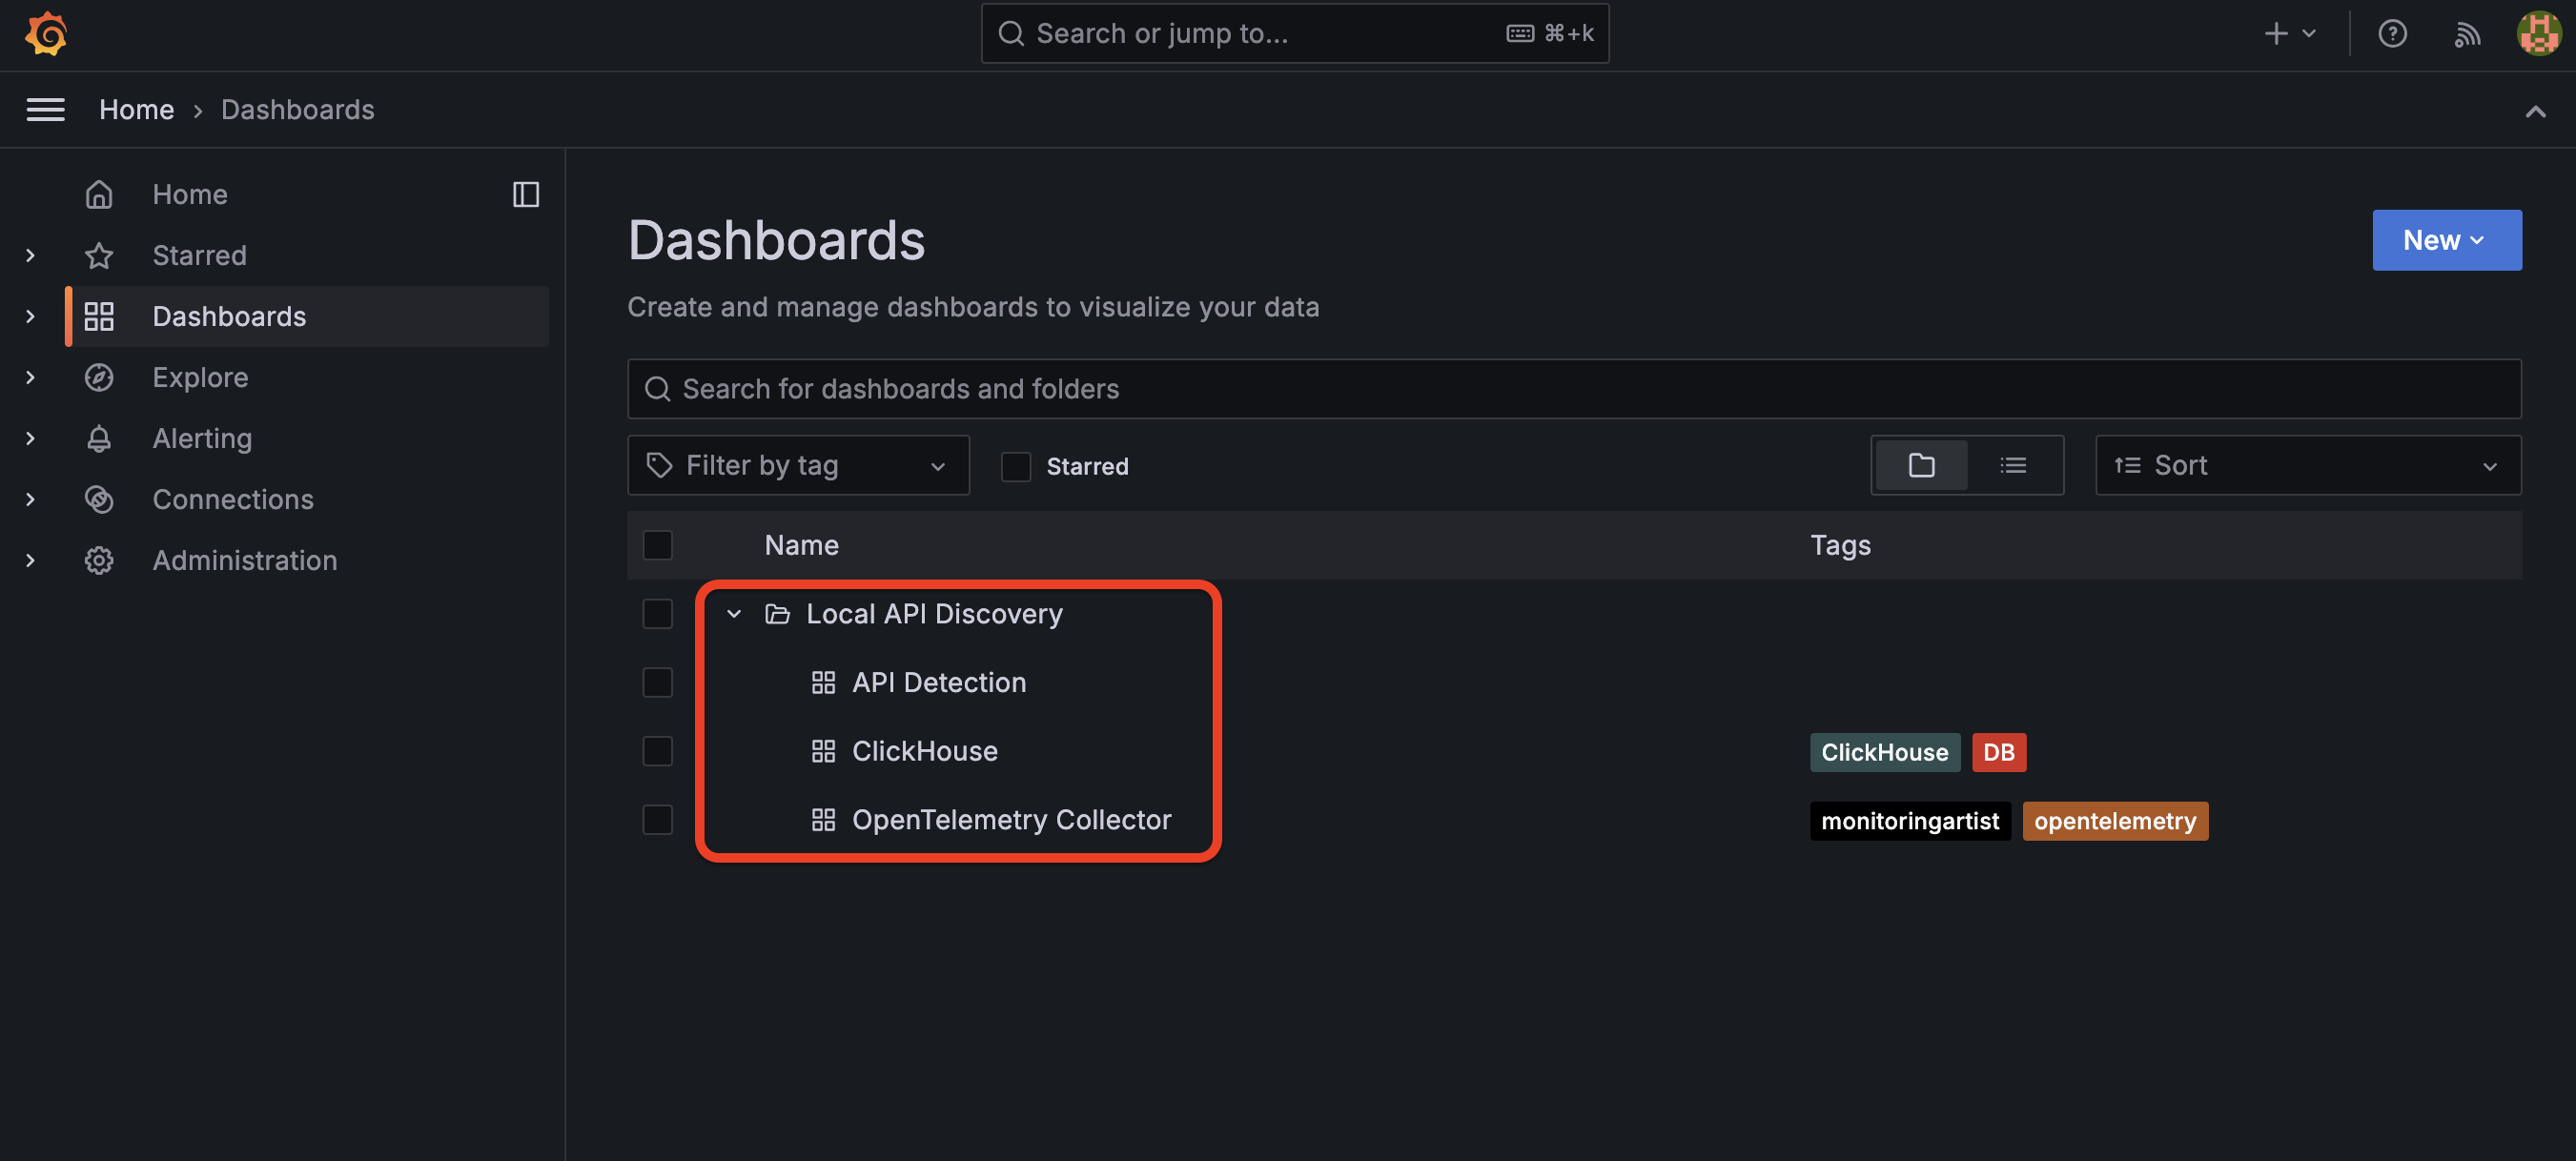
Once the Dashboards page has loaded, you can either expand the list of dashboards by selecting the > symbol next to Local API Discovery or selecting the Local API Discovery folder itself.
API Detection Dashboard
The API Detection Dashboard has three sections, as outlined below. Contract the System Overview and System State Detail sections by selecting the v next to each section title, as we’re more interested in the Detection Results.
System Overview
Clickhouse Service Status
OTel Service Status
Log Analyzer Status
Last Analysis Time
Logs Analyzed Last Time
New Logs Since Last Analysis
System State Detail
Analysis Settings
Logs Last Processed by Host
Logs Received
Logs Processed at Last Analysis
Last Analysis Duration
CPU Utilization
Memory Usage
Detection Results
Application Name
HTTP Method
Path
Authentication Detected
Sensitive Headers Present
Sensitive Body Present
Sensitive Data Types
# of Requests
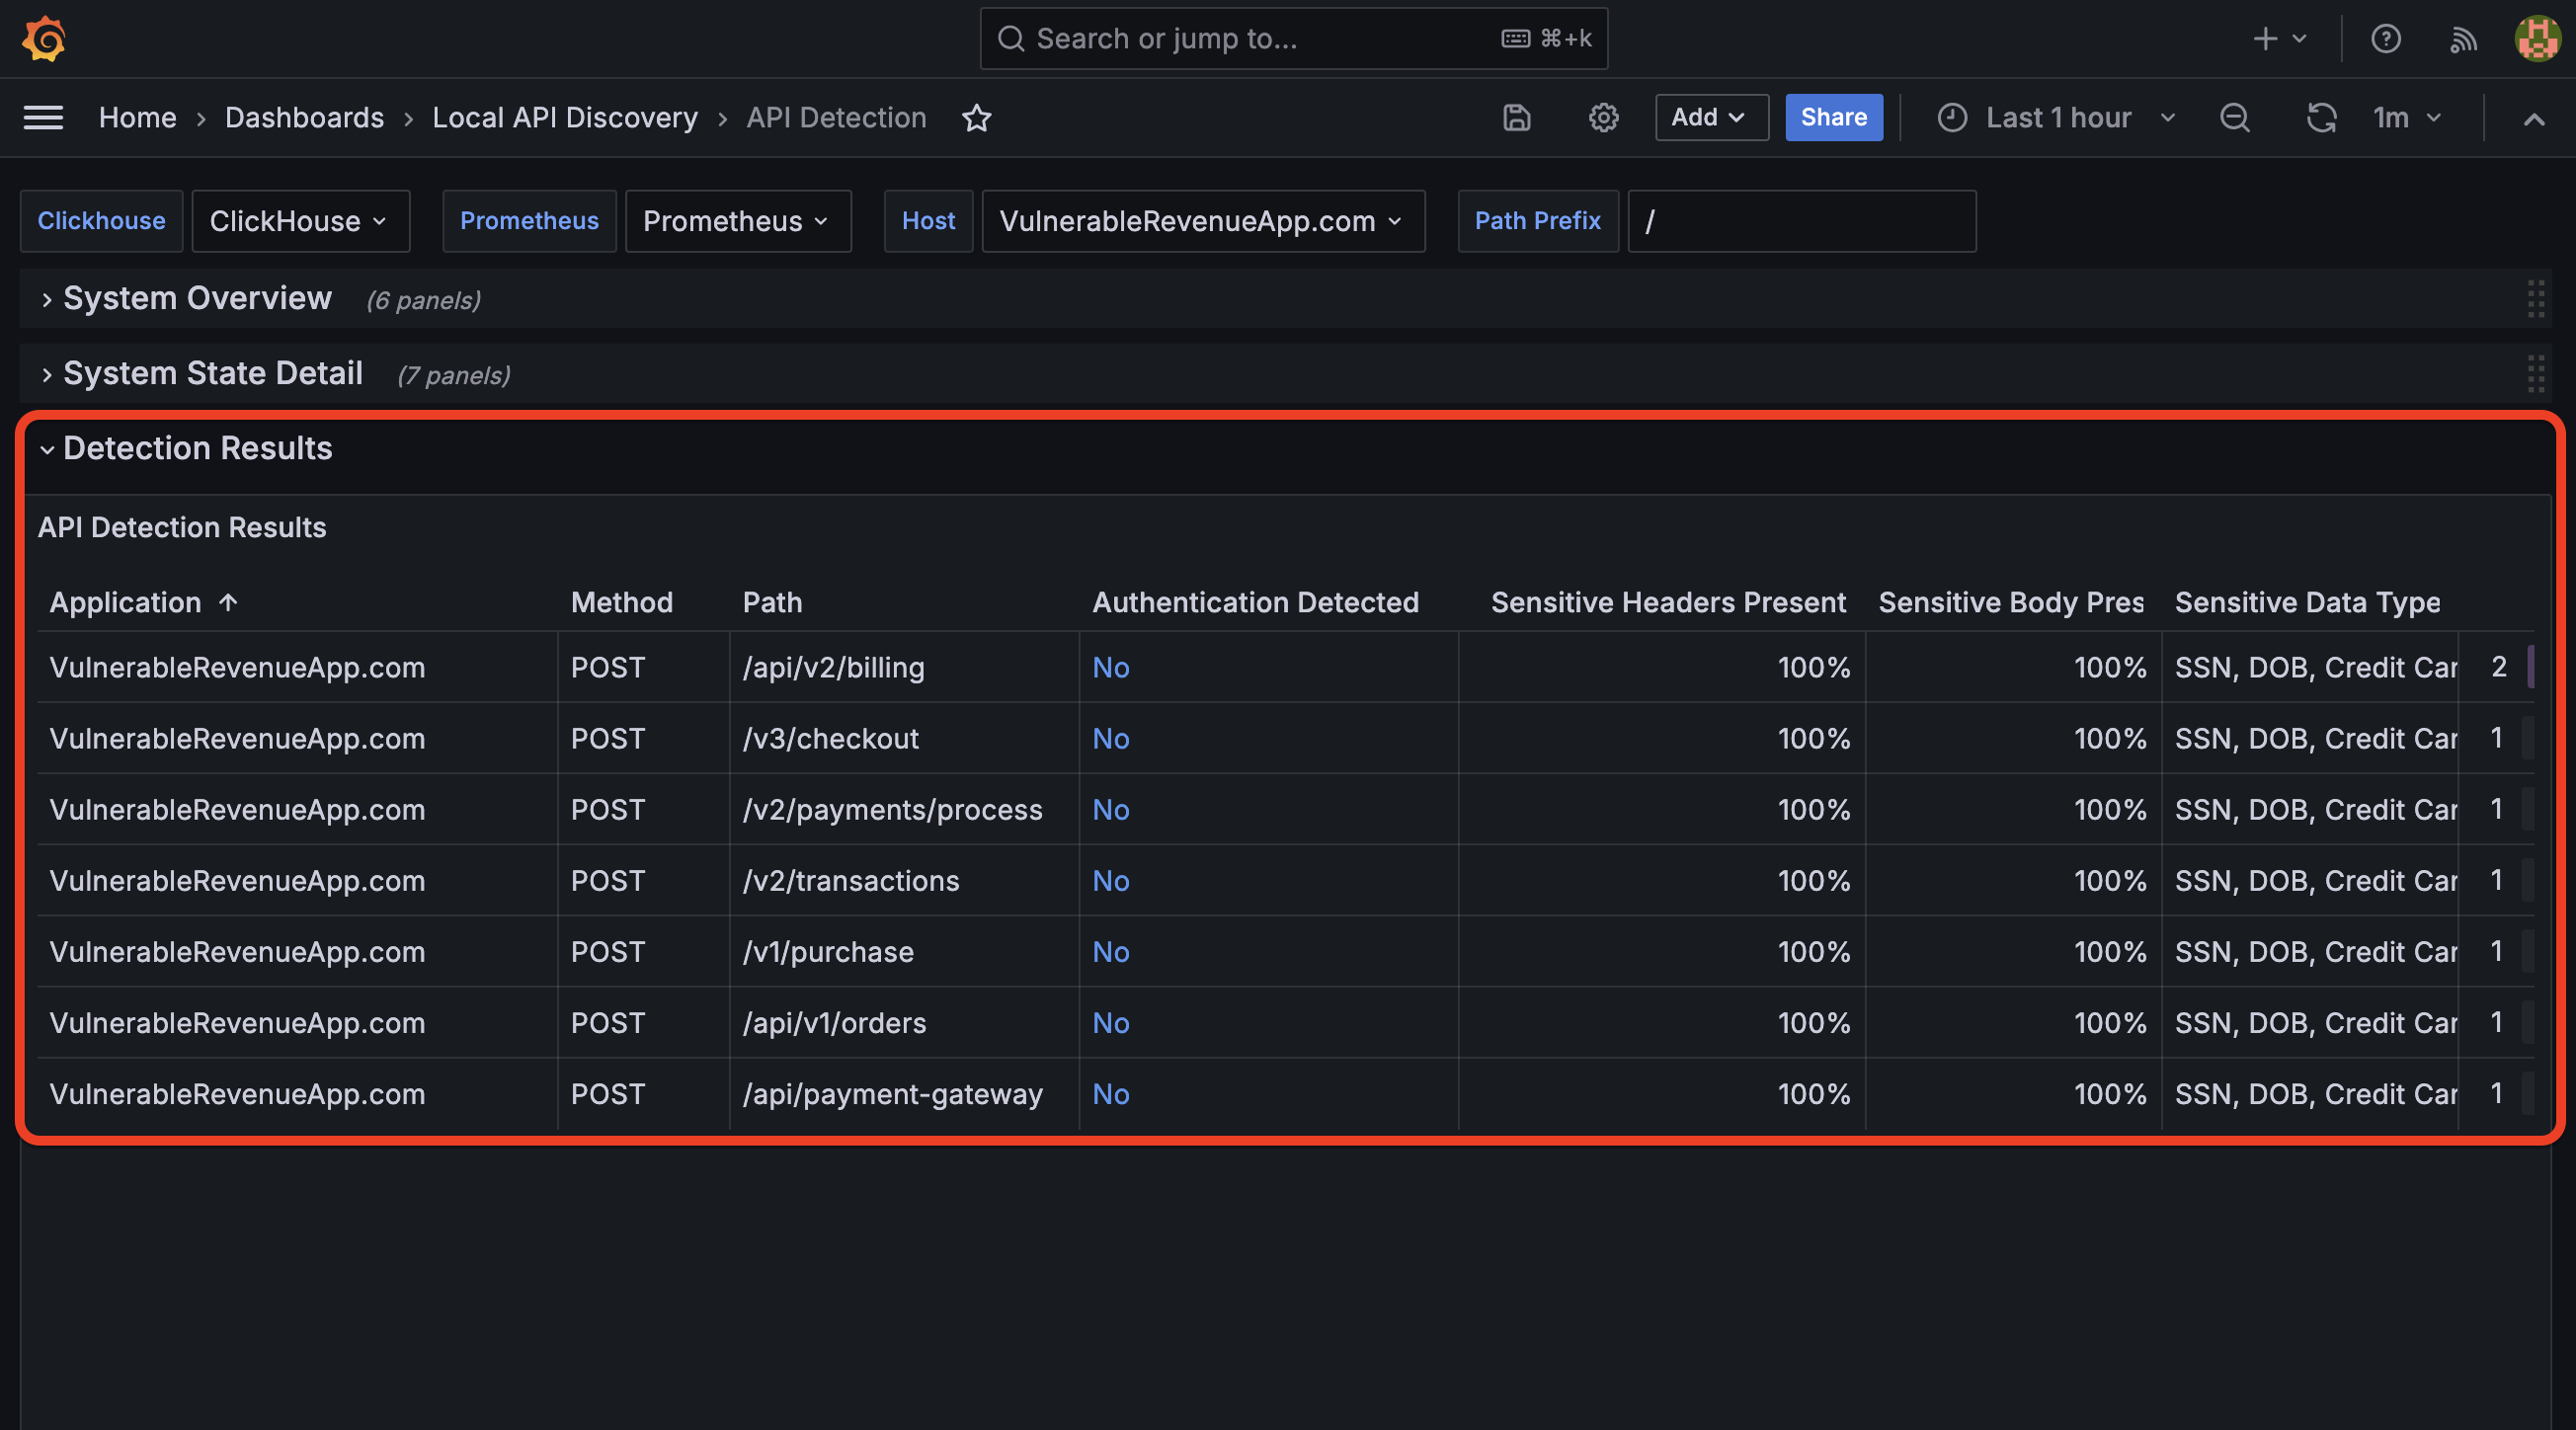
As detailed above, Detection Results is where all of the API endpoints and their detected properties will be listed. Straight away, you will be able to get a view of the number of requests an API resource has seen for a given method and whether or not sensitive data or headers have been detected.
ClickHouse Dashboard
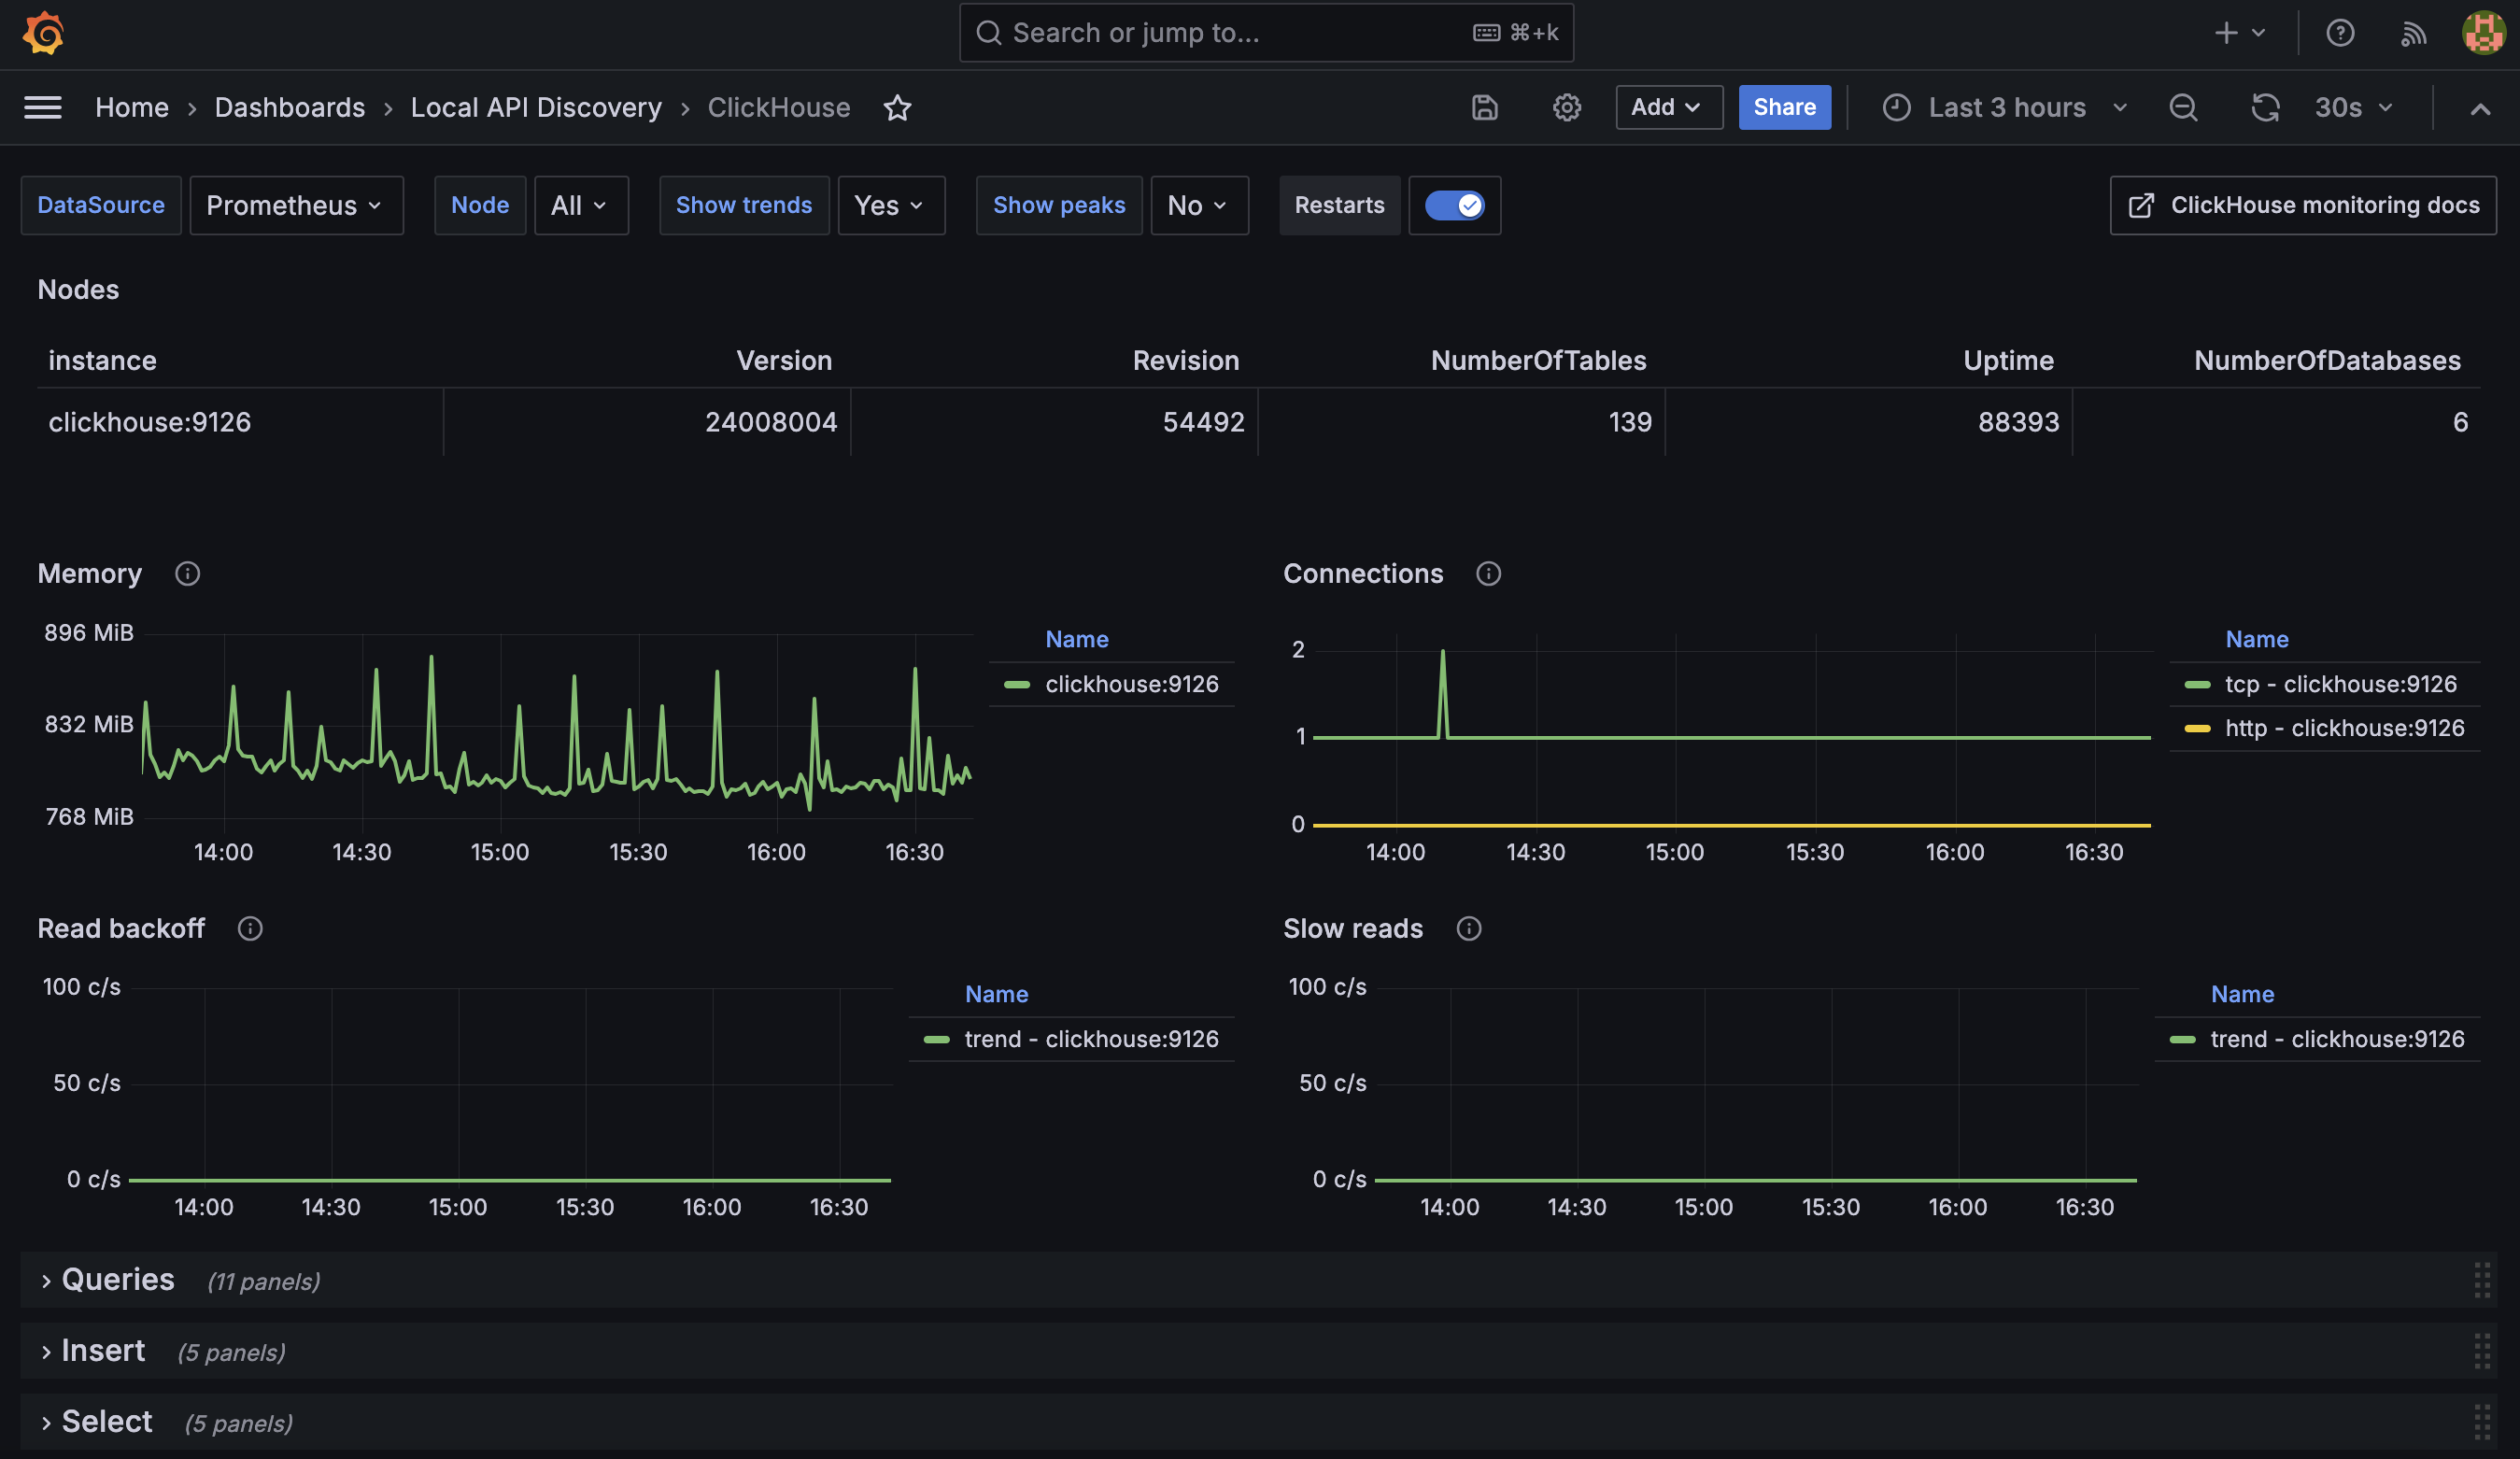
ClickHouse is the software used to store logs and perform analysis queries. Its dashboard has 12 sections, which are listed below. This is not necessarily an aspect of the tool we expect students and administrators to interact with on a regular basis. However, it’s a good idea to understand the scope of which metrics are captured and represented here in the event troubleshooting is required.
System Metrics
Nodes
Memory
Connections
Read backoff
Slow reads
Queries
Insert
Select
IO
Replicas
Merge
Cache
Parts
Distributed
Background pool
Zookeeper
Note
Many (if not all) of the metrics found within this dashboard may be foreign and daunting if you’re not already familiar with ClickHouse and/or databases in general.
If you would like to get a better understanding of their role, contextual information is available via the information icon to the right of each metric label. Hover over the icon to view tooltip details.
Attention
References to clickhouse:9126 indicate the default port upon which the ClickHouse runs: 9126
OpenTelemetry Collector Dashboard
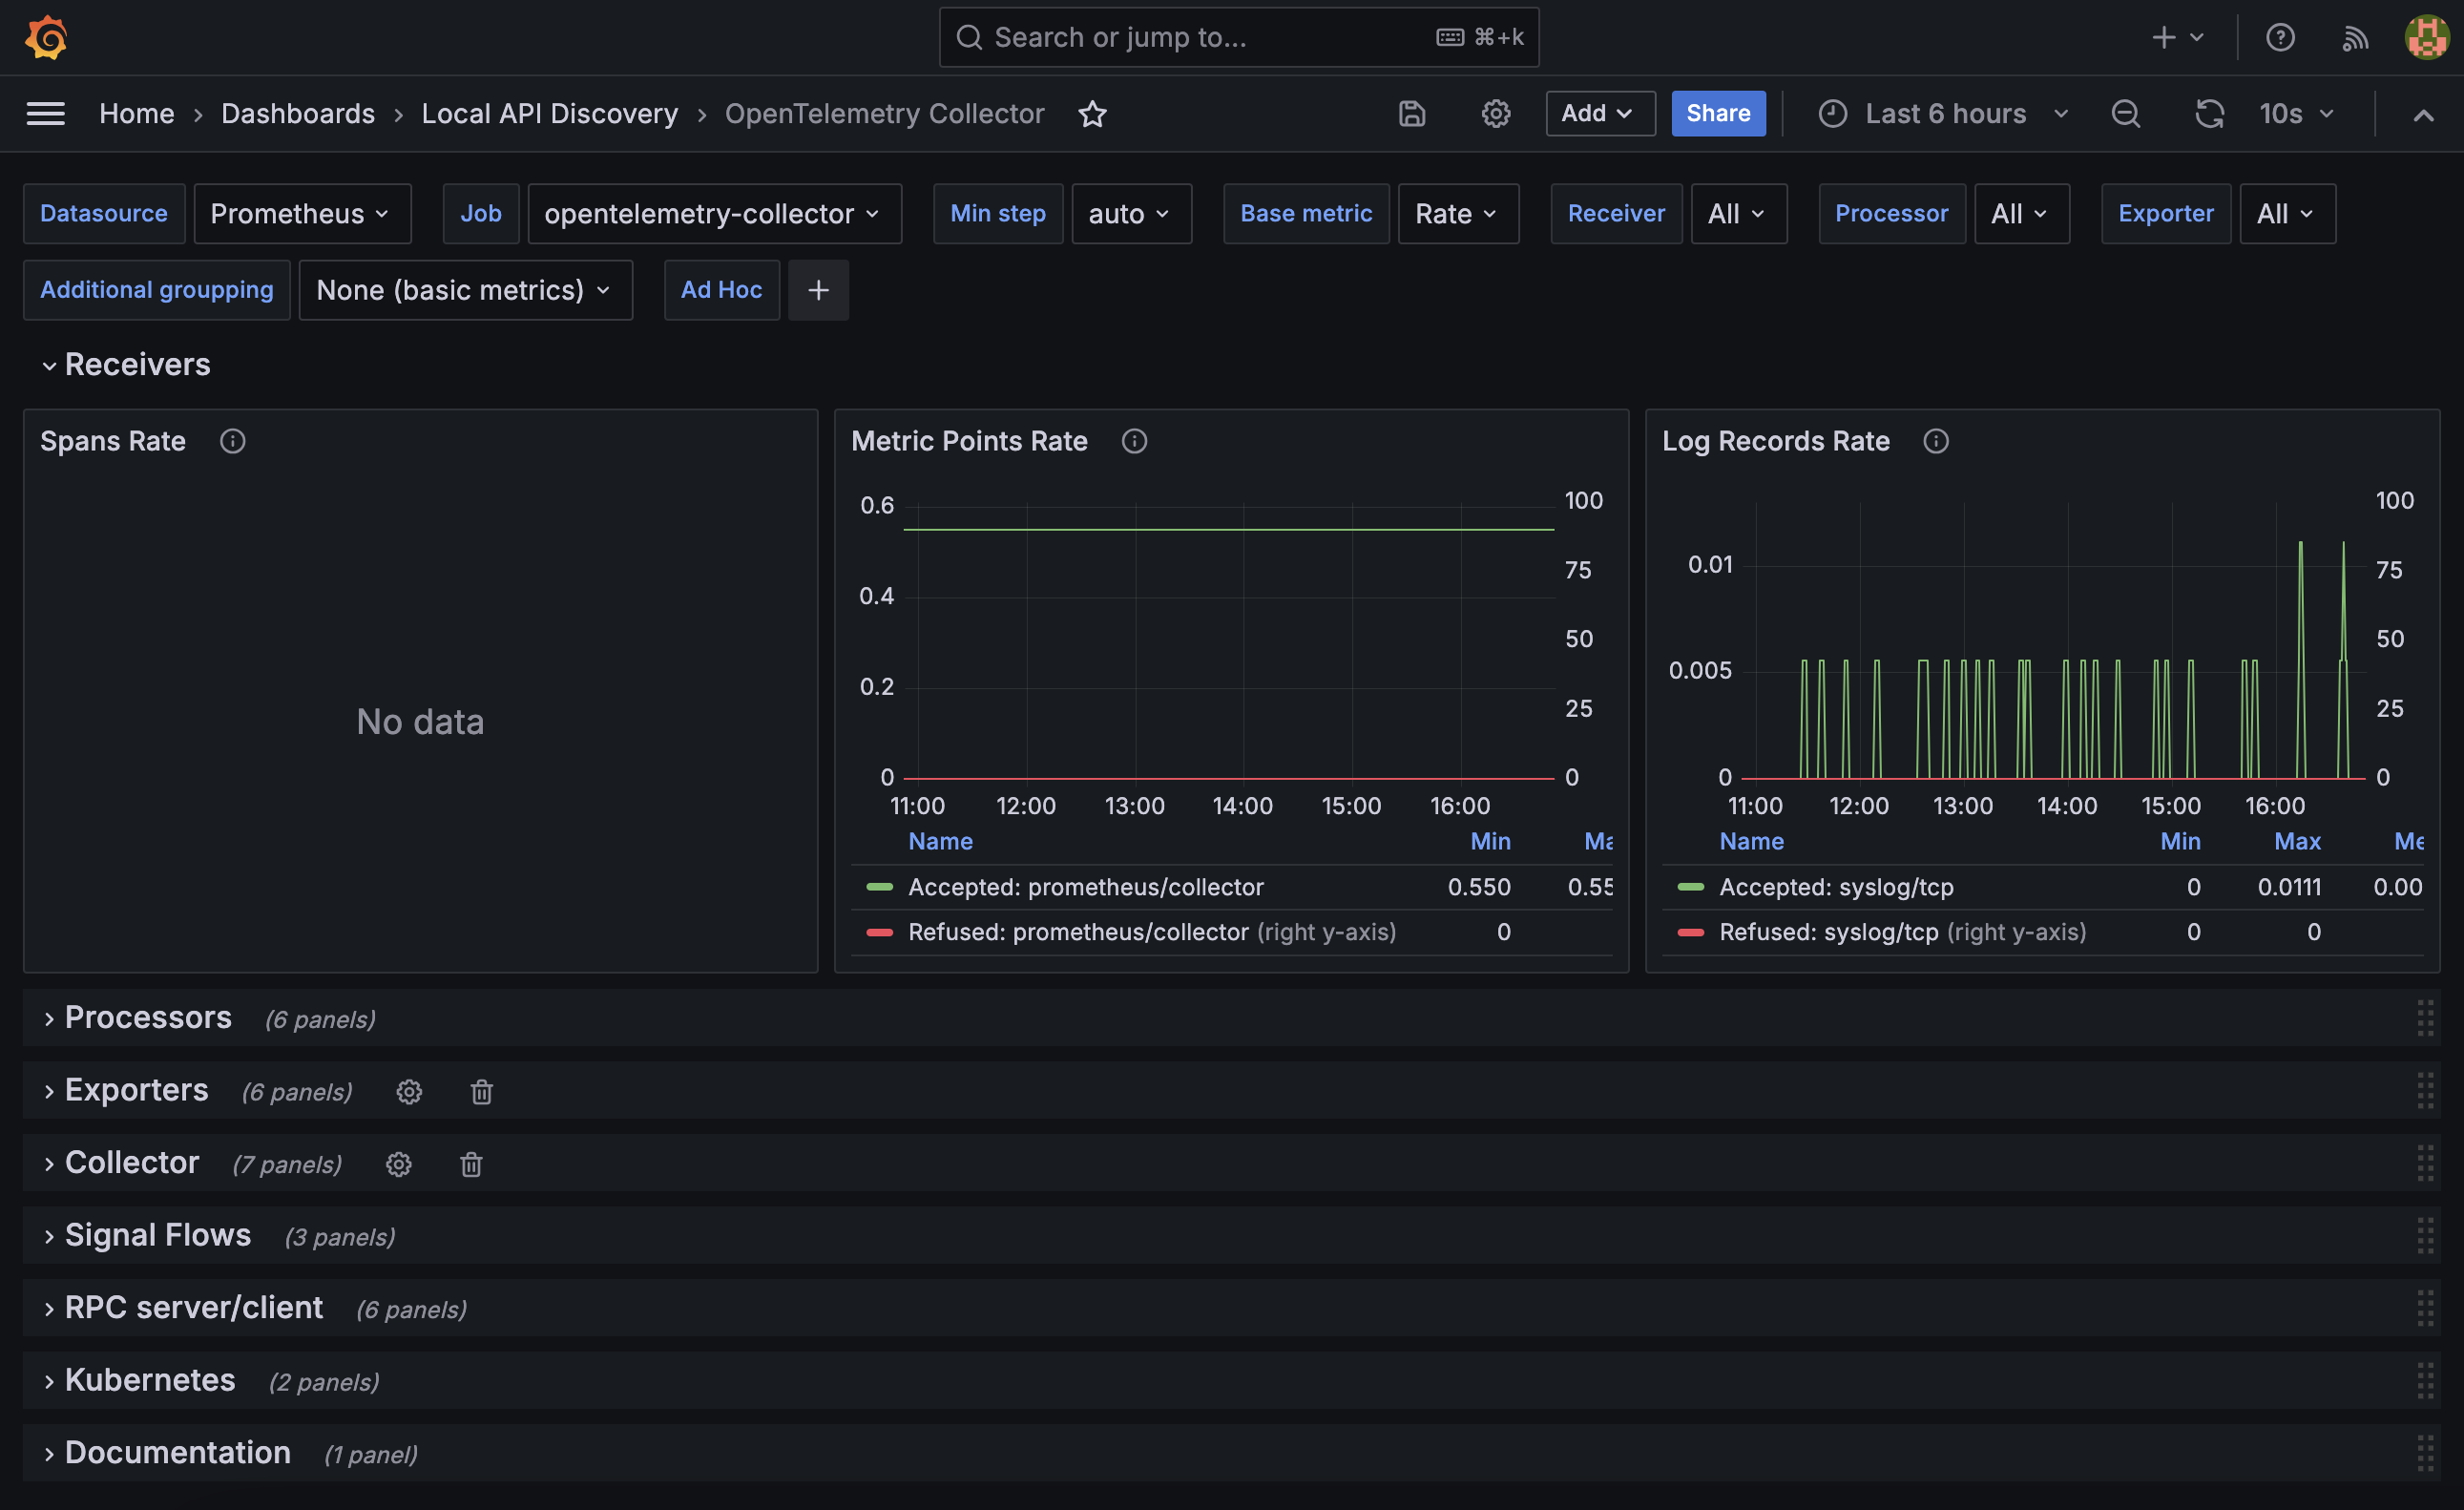
The OpenTelemetry Collector Dashboard contains all information pertaining to the OTel Collector employed in receiving, processing, and forwarding incoming logs to the storage system (ClickHouse). This dashboard contains the following eight sections:
There’s a section dedicated to documentation, should you have the desire to learn more about telemetry metrics collection!
Receivers
Processors
Exporters
Collector
Signal Flows
RPC server/client
Kubernetes
Documentation
Note
As mentioned within the ClickHouse Dashboards portion above, you may obtain a better understanding of OTel Collector metric roles via the information icon to the right of each metric label. Hover over the icon to view tooltip details.
That’s a wrap for the F5 Application Study Tool Introduction class, folks. Check back often for updates to the guide, as we have exciting plans for future labs!
Our appreciation for your time and energy goes beyond what words can convey.
Attention
We would like to encourage you to provide feedback through your account team and also the GitHub repos, should you encounter issues or have enhancement requests!