Unofficial - F5 Certification Exam Prep Material > F5 101 - App Delivery Fundamentals Exam Study Guide - Created 03/06/20 Source | Edit on
Section 2 - Troubleshooting
Objective - 2.01 Identify application and network errors
2.01 - Identify general meanings of HTTP error codes
https://en.wikipedia.org/wiki/List_of_HTTP_status_codes
HTTP error codes
The Internet Assigned Numbers Authority (IANA) maintains the official registry of HTTP status codes.
All HTTP response status codes are separated into five classes or categories. The first digit of the status code defines the class of response, while the last two digits do not have any classifying or categorization role. There are five classes defined by the standard:
- 1xx informational response – An informational response indicates that the request was received and understood. It is issued on a provisional basis while request processing continues. It alerts the client to wait for a final response. The message consists only of the status line and optional header fields, and is terminated by an empty line. As the HTTP/1.0 standard did not define any 1xx status codes, servers must not send a 1xx response to an HTTP/1.0 compliant client except under experimental conditions.
- 2xx successful – This class of status codes indicates the action requested by the client was received, understood and accepted.
- 3xx redirection – This class of status code indicates the client must take additional action to complete the request. Many of these status codes are used in URL redirection. A user agent may carry out the additional action with no user interaction only if the method used in the second request is GET or HEAD. A user agent may automatically redirect a request. A user agent should detect and intervene to prevent cyclical redirects.
- 4xx client error – This class of status code is intended for situations in which the error seems to have been caused by the client. Except when responding to a HEAD request, the server should include an entity containing an explanation of the error situation, and whether it is a temporary or permanent condition. These status codes are applicable to any request method. User agents should display any included entity to the user.
- 5xx server error – The server failed to fulfill a request. Response status codes beginning with the digit “5” indicate cases in which the server is aware that it has encountered an error or is otherwise incapable of performing the request. Except when responding to a HEAD request, the server should include an entity containing an explanation of the error situation and indicate whether it is a temporary or permanent condition. Likewise, user agents should display any included entity to the user. These response codes are applicable to any request method.
For this topic, it is good to know the different class levels and to also understand many of the common errors within each class beyond the common 302 and 404 and 503. All of which can be found on the link provided. You never know what might appear on the exam.
There are also codes that are not specified by any standard, but they are likely not going to appear on this exam.
2.01 - Identify possible reasons and methods for connection termination
(Ref:2) https://learning.oreilly.com/library/view/tcpip-illustrated-volume/0201633469/ch18.html%20-%20ch18lev2sec4
https://www.oreilly.com/library/view/http-the-definitive/1565925092/ch04s07.html
TCP
While it takes three segments to establish a connection, it takes four to terminate a connection. This is caused by TCP’s half-close. Since a TCP connection is full-duplex (that is, data can be flowing in each direction independently of the other direction), each direction must be shut down independently. The rule is that either end can send a FIN when it is done sending data. When a TCP receives a FIN, it must notify the application that the other end has terminated that direction of data flow. The sending of a FIN is normally the result of the application issuing a close.
The receipt of a FIN only means there will be no more data flowing in that direction. A TCP can still send data after receiving a FIN. While it’s possible for an application to take advantage of this half-close, in practice few TCP applications use it.
HTTP Connection Termination
Any HTTP client, server, or proxy can close a TCP transport connection at any time. The connections normally are closed at the end of a message, but during error conditions, the connection may be closed in the middle of a header line or in other strange places.
This situation is common with pipelined persistent connections. HTTP applications are free to close persistent connections after any period of time. For example, after a persistent connection has been idle for a while, a server may decide to shut it down.
However, the server can never know for sure that the client on the other end of the line wasn’t about to send data at the same time that the “idle” connection was being shut down by the server. If this happens, the client sees a connection error in the middle of writing its request message.
Content-Length and Truncation
Each HTTP response should have an accurate Content-Length header to describe the size of the response body. Some older HTTP servers omit the Content-Length header or include an erroneous length, depending on a server connection close to signify the actual end of data.
When a client or proxy receives an HTTP response terminating in connection close, and the actual transferred entity length doesn’t match the Content-Length (or there is no Content-Length), the receiver should question the correctness of the length.
If the receiver is a caching proxy, the receiver should not cache the response (to minimize future compounding of a potential error). The proxy should forward the questionable message intact, without attempting to “correct” the Content-Length, to maintain semantic transparency.
Connection Close Tolerance, Retries, and Idempotency
Connections can close at any time, even in non-error conditions. HTTP applications have to be ready to properly handle unexpected closes. If a transport connection closes while the client is performing a transaction, the client should reopen the connection and retry one time, unless the transaction has side effects. The situation is worse for pipelined connections. The client can enqueue a large number of requests, but the origin server can close the connection, leaving numerous requests unprocessed and in need of rescheduling.
Side effects are important. When a connection closes after some request data was sent but before the response is returned, the client cannot be 100% sure how much of the transaction actually was invoked by the server. Some transactions, such as GETting a static HTML page, can be repeated again and again without changing anything. Other transactions, such as POSTing an order to an online bookstore, shouldn’t be repeated, or you may risk multiple orders.
A transaction is idempotent if it yields the same result regardless of whether it is executed once or many times. Implementors can assume the GET, HEAD, PUT, DELETE, TRACE, and OPTIONS methods share this property.[19] Clients shouldn’t pipeline nonidempotent requests (such as POSTs). Otherwise, a premature termination of the transport connection could lead to indeterminate results. If you want to send a nonidempotent request, you should wait for the response status for the previous request.
Nonidempotent methods or sequences must not be retried automatically, although user agents may offer a human operator the choice of retrying the request. For example, most browsers will offer a dialog box when reloading a cached POST response, asking if you want to post the transaction again.
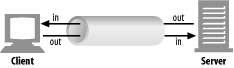
Graceful Connection Close
TCP connections are bidirectional, as shown in the following figure. Each side of a TCP connection has an input queue and an output queue, for data being read or written. Data placed in the output of one side will eventually show up on the input of the other side.
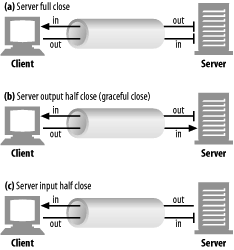
Full and half closes
An application can close either or both of the TCP input and output channels. A close( ) sockets call closes both the input and output channels of a TCP connection. This is called a “full close” and is depicted in figure “a” below. You can use the shutdown( ) sockets call to close either the input or output channel individually. This is called a “half close” and is depicted in figure “b” and “c” below.
TCP close and reset errors
Simple HTTP applications can use only full closes. But when applications start talking to many other types of HTTP clients, servers, and proxies, and when they start using pipelined persistent connections, it becomes important for them to use half closes to prevent peers from getting unexpected write errors.
In general, closing the output channel of your connection is always safe. The peer on the other side of the connection will be notified that you closed the connection by getting an end-of-stream notification once all the data has been read from its buffer.
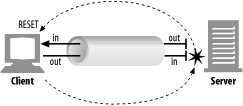
Closing the input channel of your connection is riskier, unless you know the other side doesn’t plan to send any more data. If the other side sends data to your closed input channel, the operating system will issue a TCP “connection reset by peer” message back to the other side’s machine, as shown in the figure below. Most operating systems treat this as a serious error and erase any buffered data the other side has not read yet. This is very bad for pipelined connections.
Say you have sent 10 pipelined requests on a persistent connection, and the responses already have arrived and are sitting in your operating system’s buffer (but the application hasn’t read them yet). Now say you send request #11, but the server decides you’ve used this connection long enough, and closes it. Your request #11 will arrive at a closed connection and will reflect a reset back to you. This reset will erase your input buffers.
When you finally get to reading data, you will get a connection reset by peer error, and the buffered, unread response data will be lost, even though much of it successfully arrived at your machine.
Graceful close
The HTTP specification counsels that when clients or servers want to close a connection unexpectedly, they should “issue a graceful close on the transport connection,” but it doesn’t describe how to do that.
In general, applications implementing graceful closes will first close their output channels and then wait for the peer on the other side of the connection to close its output channels. When both sides are done telling each other they won’t be sending any more data (i.e., closing output channels), the connection can be closed fully, with no risk of reset.
Unfortunately, there is no guarantee that the peer implements or checks for half closes. For this reason, applications wanting to close gracefully should half close their output channels and periodically check the status of their input channels (looking for data or for the end of the stream). If the input channel isn’t closed by the peer within some timeout period, the application may force connection close to save resources.
2.01 - Identify possible causes for failure to establish connection
Application Connection failures
When it comes to connection failures to application’s the sky is the limit for causes. At the simplest level it can be a loss of network connectivity for the initiating system or receiving system and it goes up the OSI stack from there with reasons the application is not responding. You can also have a human error like mistyping a URL, misconfiguring a setting in a browser or application tool like Putty. When identifying problems like this you should start with the simplest causes and work your way up to more complicated issues.
Objective - 2.02 Given a scenario, verify Layer 2 mapping (ARP)
2.02 - Explain one-to-one mapping of MAC to IP
Address Resolution Protocol on the BIG-IP system
The BIG-IP system is a multi-layer network device, and as such, needs to perform routing functions. To do this, the BIG-IP system must be able to find destination MAC addresses on the network, based on known IP addresses. The way that the BIG-IP system does this is by supporting Address Resolution Protocol (ARP), an industry-standard Layer 3 protocol. ARP will keep a table that contains a one-to-one mapping of known IP addresses to their corresponding MAC addresses on the systems local area networks.
2.02 - Given a network diagram or ARP command output, determine if ARP resolution was successful
Troubleshooting ARP
What are the states of ARP entries?
When you use the BIG-IP Configuration utility to view the entries in the ARP cache, you can view the state of each entry.
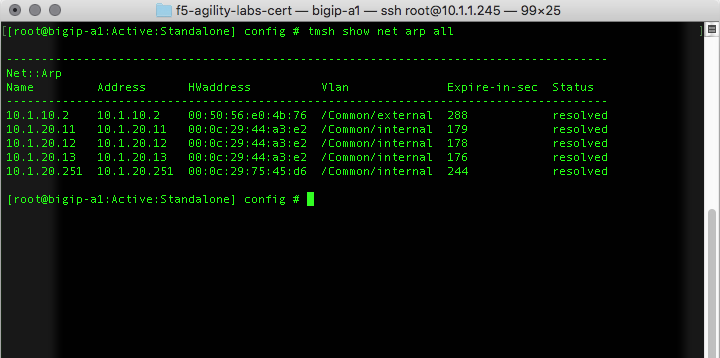
RESOLVED
Indicates that the system has successfully received an ARP response (a MAC address) for the requested IP address within two seconds of initiating the request. An entry in a RESOLVED state remains in the ARP cache until the timeout period has expired.
INCOMPLETE
Indicates that the system has made one or more ARP requests within the maximum number of requests allowed, but has not yet received a response.
DOWN
Indicates that the system has made the maximum number of requests allowed, and still receives no response. In this case, the system discards the packet, and sends an ICMP host unreachable message to the sender. An entry with a DOWN state remains in the ARP cache until the first of these events occurs:
- Twenty seconds elapse.
- The BIG-IP system receives either a resolution response or a gratuitous ARP from the destination host. (A gratuitous ARP is an ARP message that a host sends without having been prompted by an ARP request.)
- You explicitly delete the entry from the ARP cache.
About BIG-IP responses to ARP requests from firewall devices
The system does not respond to ARP requests sent from any firewall that uses a multicast IP address as its source address.
About gratuitous ARP messages
When dynamically updating the ARP cache, the BIG-IP system includes not only entries resulting from responses to ARP requests, but also entries resulting from gratuitous ARP messages.
For security reasons, the system does not fully trust gratuitous ARP entries. Consequently, if there is no existing entry in the cache for the IP address/MAC pair, and the BIG-IP system cannot verify the validity of the gratuitous ARP entry within a short period of time, the BIG-IP system deletes the entry.
2.02 - Given the ARP command output, determine if ARP resolution was successful
ARP resolution
You should be familiar with looking at ARP entries on a BIG-IP system. To see ARP entries on the BIG-IP enter the following command at the bash prompt:
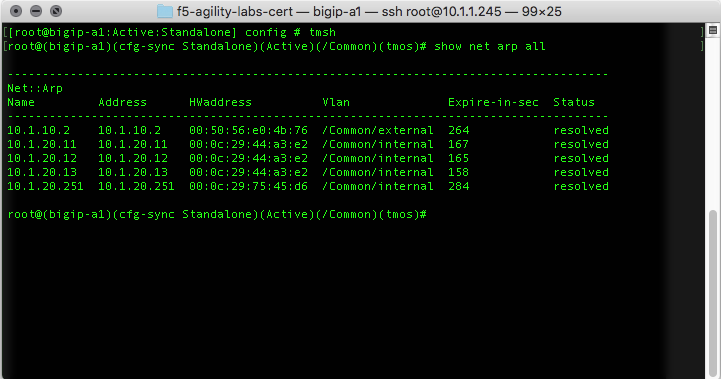
[root@bigip-a1:Active:Standalone] config # tmsh show net arp all
Or the following command in the tmsh shell:
root@(bigip-a1)(cfg-sync Standalone)(Active)(/Common)(tmos)# show net arp all
2.02 - Explain the purpose of MAC masquerading
About MAC masquerade addresses
A MAC masquerade address is a unique, floating Media Access Control (MAC) address that you create and control. You can assign one MAC masquerade address to each traffic group on a BIG-IP device. By assigning a MAC masquerade address to a traffic group, you indirectly associate that address with any floating IP addresses (services) associated with that traffic group. With a MAC masquerade address per traffic group, a single VLAN can potentially carry traffic and services for multiple traffic groups, with each service having its own MAC masquerade address.
A primary purpose of a MAC masquerade address is to minimize ARP communications or dropped packets as a result of a failover event. A MAC masquerade address ensures that any traffic destined for the relevant traffic group reaches an available device after failover has occurred, because the MAC masquerade address floats to the available device along with the traffic group. Without a MAC masquerade address, on failover the sending host must relearn the MAC address for the newly-active device, either by sending an ARP request for the IP address for the traffic or by relying on the gratuitous ARP from the newly-active device to refresh its stale ARP entry.
The assignment of a MAC masquerade address to a traffic group is optional. Also, there is no requirement for a MAC masquerade address to reside in the same MAC address space as that of the BIG-IP device.
Note: When you assign a MAC masquerade address to a traffic group, the BIG-IP system sends a gratuitous ARP to notify other hosts on the network of the new address.
Objective - 2.03 Given a scenario, verify traffic is arriving at a destination
2.03 - Explain how to acquire packet captures
http://support.f5.com/kb/en-us/solutions/public/0000/400/sol411.html
Packet Captures
A packet capture can be one of the most powerful tools that an administrator has at their command. If you are not used to doing packet captures or have never done one, you should do them in your lab environment as soon as possible to start becoming proficient. There are multiple tools that can be used to do a packet capture such as tcpdump, Wireshark, Windump (Windows based tcpdump), tshark, etc..
Running tcpdump on a busy system
Important: The BIG-IP system is designed as an application delivery network platform and not as a packet capture device. If you intend to capture traffic under high load conditions, F5 recommends mirroring traffic to a dedicated sniffing device.
Running tcpdump on a BIG-IP system is considered best effort, as it will place more load on the CPU and may result in inaccuracies in the tcpdump output, such as missed packets or packet timestamp irregularities. If you run tcpdump on a heavily loaded BIG-IP system, the packet capture process may not capture all matching traffic, and the statistical values reported by tcpdump may be inaccurate.
If you run tcpdump on a heavily loaded system, F5 recommends using tcpdump filter expressions to mitigate the potential for missed packets.
If you are using a packet capture tool other than tcpdump on the Big-IP platform, you will need to make sure that the system you are running the capture tool on has access to the local network, which you need to capture. This may mean that you need to be in line between devices or you may need a network tap or a span port. If you are capturing the traffic on your workstation you will need to make sure the network card can support promiscuous mode and has the right drivers to support the capture software.
tcpdump
The tcpdump utility is a command line packet sniffer with many features and options. For a full description, refer to the tcpdump man pages by typing the following command: man tcpdump
You can read the binary output of a tcpdump using a packet analyzer. Some analyzer software can also be used to capture traffic as well like Wireshark.
Running the tcpdump utility
Following are examples of commands used to run the tcpdump utility:
Selecting an Interface or VLAN
The tcpdump utility is able to sniff for packets on only one interface or VLAN. By default, it selects the lowest numbered interface.
To select an interface, use the -i flag, as follows:
tcpdump -i <interface>
For example:
To tcpdump a specific interface:
tcpdump -i 2.1
tcpdump -i 1.08
To tcpdump a specific vlan:
tcpdump -i internal
tcpdump -i external
To tcpdump the management interface:
tcpdump -i eth0
Note: Do not attempt to run tcpdump on an interface that contains a colon.
For example: eth0:mgmt
Disabling name resolution
By default, tcpdump attempts to look up IP addresses and use names, rather than numbers, in the output. The BIG-IP system must wait for a response from the DNS server, so the lookups can be time consuming and the output may be confusing.
To disable name resolution, use the -n flag as in the following examples:
tcpdump -n
tcpdump -ni internal
Saving tcpdump output to a file
You can save the tcpdump data to one of the following file formats:
A binary file that contains all the information collected by the tcpdump and is readable by the tcpdump utility as well as many other traffic analysis packages.
A text file that contains a subset of the full tcpdump data but is readable only as plain text.
When working with F5 Technical Support, you must provide the tcpdump output in the binary file format.
Binary file
To save the tcpdump output to a binary file, type the following command:
tcpdump -w <filename>
For example: tcpdump -w dump1.bin
Note: The tcpdump utility does not print data to the screen while it is capturing to a file. To stop the capture, press CTRL-C.
Text file
To save the tcpdump output to a text file, type the following command:
tcpdump ><filename>
For example: tcpdump >dump1.txt
Reading tcpdump binary file output
To read data from a binary tcpdump file (that you saved by using the tcpdump -w command), type the following command:
tcpdump -r <filename>
For example: tcpdump -r dump1.bin
In this mode, the tcpdump utility reads stored packets from the file, but otherwise operates just as it would if it were reading from the network interface. As a result, you can use formatting commands and filters.
Beginning in BIG-IP 11.2.0-HF3, 11.2.1-HF3, and 11.3.0, a pseudo header which includes the following parameters is added to the start of each binary tcpdump capture:
The tcpdump command syntax used, including all options
Version of software
Hostname of the system
Platform ID
Product
Filters
The tcpdump utility allows you to use filters to, among other things, restrict the output to specified addresses, ports, and tcp flags.
Filtering on a host address
To view all packets that are traveling to or from a specific IP address, type the following command:
tcpdump host <IP address>
For example: tcpdump host 10.90.100.1
To view all packets that are traveling from a specific IP address, type the following command:
tcpdump src host <IP address>
For example:
tcpdump src host 10.90.100.1
To view all packets that are traveling to a particular IP address, type the following command:
tcpdump dst host <IP address>
For example:
tcpdump dst host 10.90.100.1
Filtering on a port
To view all packets that are traveling through the BIG-IP system and are either sourced from or destined to a specific port, type the following command:
tcpdump port <port number>
For example: tcpdump port 80
To view all packets that are traveling through the BIG-IP system and sourced from a specific port, type the following command:
tcpdump src port<port number>
For example: tcpdump src port 80
To view all packets that are traveling through the BIG-IP system and destined to a specific port, type the following command:
tcpdump dst port <port number>
For example: tcpdump dst port 80
Filtering on a tcp flag
To view all packets that are traveling through the BIG-IP system that contain the SYN flag, type the following command:
tcpdump ‘tcp[tcpflags] & (tcp-syn) != 0’
To view all packets that are traveling through the BIG-IP system that contain the RST flag, type the following command:
tcpdump ‘tcp[tcpflags] & (tcp-rst) != 0’
2.03 - View a packet capture and identify source and destination
https://bencane.com/2014/10/13/quick-and-practical-reference-for-tcpdump/
https://www.tcpdump.org/manpages/tcpdump.1.html
Packet capture data file structure
When looking through a packet capture from a tool like tcpdump, you should be familiar with the format which the output data is placed into the capture by the tool.
If you are trying to look for a particular conversation between two systems, you are looking for the systems IP addreses sending and receiving packets between each other.
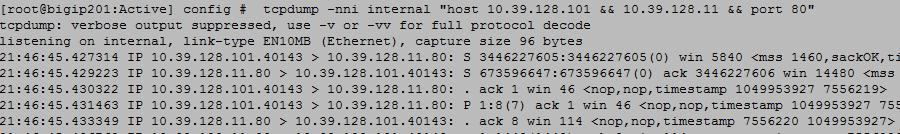
The tcpdump tool will write a file listing out each packet as it is captured. Each capture packet line item will include a timestamp, sender IP, sender port, receiver IP, receiver port and flags etc.
SrcIP.port > dstIP.port: Flags [tcpflags], seq data-seqno, ack ackno, win window, urg urgent, options [opts], length len
You can find the start of a conversation between two systems by looking for the SYN Flag. First a host, such as your computer, initiates a TCP connection by providing a TCP SYN packet to the destination host (let’s just say it’s a file sharing server for this example). After the server receives the TCP SYN it returns a packet in response with SYN ACK. Now, once your computer receives the SYN ACK, it will send out one more packet to establish the connection which contains ACK.
2.03 - Interpret statistics to show traffic flow
Traffic flow in statistics
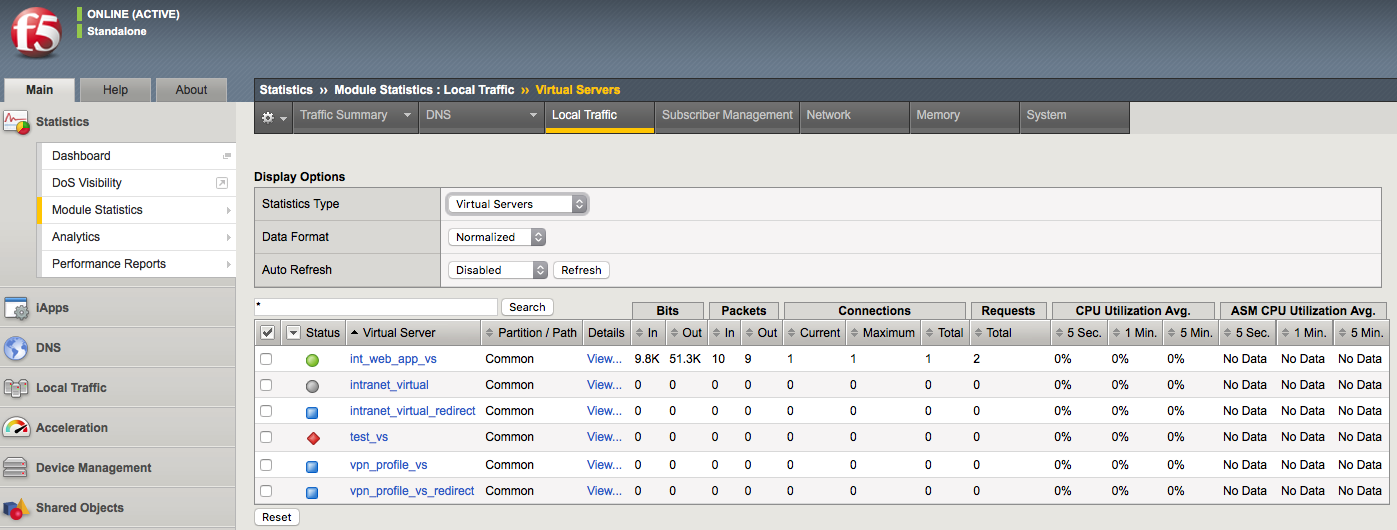
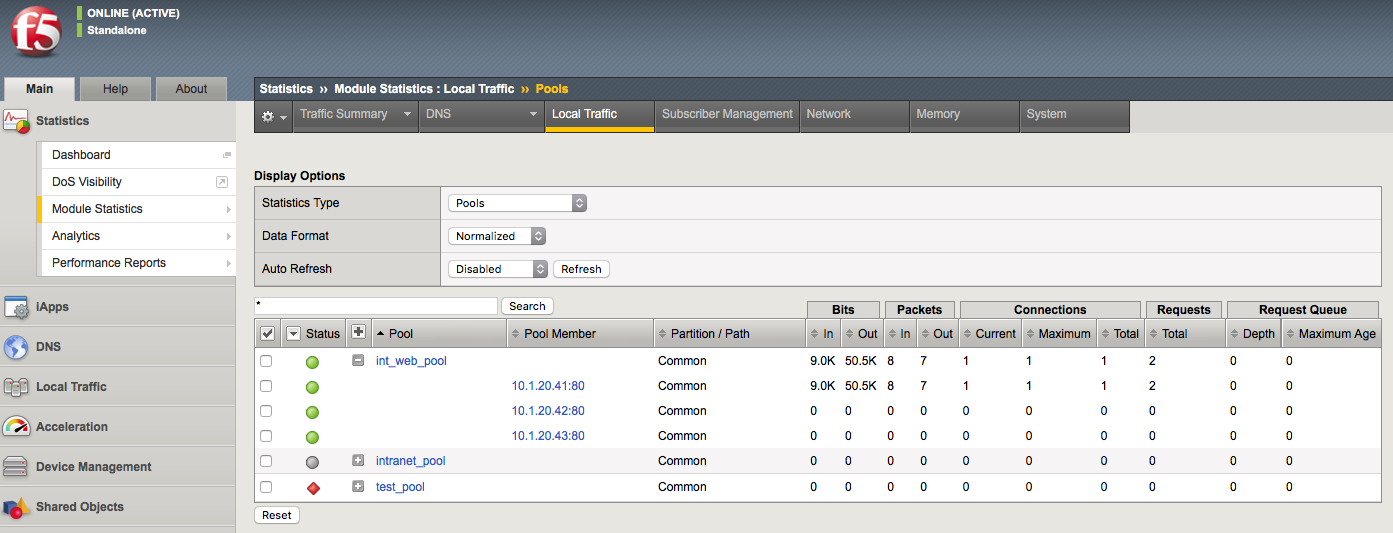
The BIG-IP collects statistics and allows you to review them in the GUI or CLI. In the GUI the information can be found in Statistics > Module Statistics > Local Traffic. At a high level these statistics can reflect that traffic is or is not reaching a certain destination. For example, if traffic is coming into a virtual server and being sent to a pool for load balancing, you may want to see if the traffic is being sent across all of the pool members effectively.
Screen shot of virtual server traffic being reflected in the statistics on BIG-IP:
Screen shot of pool traffic being reflected in the statistics on BIG-IP and can be expanded to show the pool members connection information:
Objective - 2.04 Given a scenario, verify Layer 1 connectivity
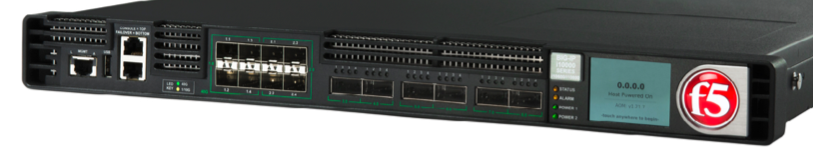
2.04 - Given an exhibit of the front ethernet panel, explain why there is an imbalance in link use
Front Panel Link Status
Link status can be determined from the front panel LEDs.
Network Interface LED Behavior
The appearance and behavior of the network interface LEDs on the platform indicate network traffic activity, interface speed, and interface duplexity.
SFP/SFP+ port LED behavior
The appearance and behavior of the SFP/SFP+ port LEDs indicate network traffic activity, interface speed, and interface duplexity.
| State | Description |
| off (not lit) | No link. |
| amber solid | Linked at 1GbE. |
| amber blinking | Link is actively transmitting or receiving data at 1GbE. |
| green solid | Linked at 10GbE. |
| green blinking | Link is actively transmitting or receiving data at 10GbE. |
2.04 - Interpret ifconfig output (interface bandwidth)
https://en.wikipedia.org/wiki/Ifconfig
Ifconfig output
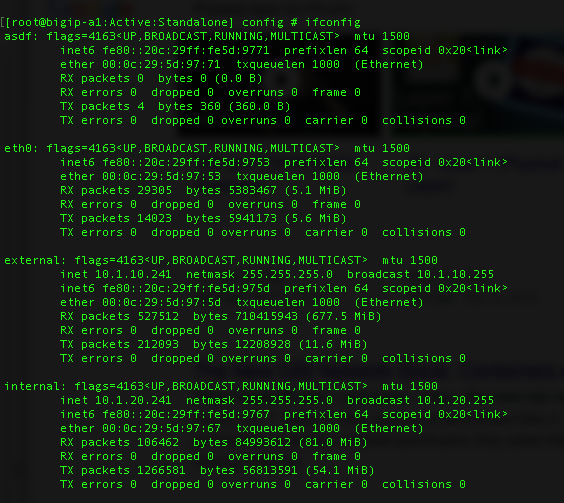
You can read up on Ifconfig in many locations on the internet and I am including a link to Wikipedia, but essentially ifconfig is a common Linux command line tool it has been replaced by the IP command in modern Linux distributions. It can be used to set-up (configure) any/all the network interfaces as well as look at interface statistics. There is a great amount of information that can be derived from the output of the tool like MAC address, MTU size, IP address, transmit and receive errors, etc..
If you use the ifconfig command without any parameters, it will show you the interface details from all of the active network interfaces. From this information, you can determine the amount of data that has transgressed an interface since it was enabled. This information can give you an idea of the bandwidth utilization, however understanding the current interface bandwidth is not as simple as adding the values of the TX Bytes and the RX Bytes together.
Since the TX and RX data counters continue to grow as the interface passes traffic, the values being displayed are over a period of time that started when the interface was last enabled. There is no ability to clear the counters in ifconfig without an interruption of service. So, to determine current bandwidth safely you will need to run the date command for the system time and the ifconfig command to gather the TX and RX values then do it all for a second time and do some math…
Add the TX and RX vales from the first ifconfig execution and add the TX and RX values from the second ifconfig execution. Subtract the first value from the second value. This will give you the amount of data that transgressed the interface between the 2 ifconfig executions. Remember that the data is displayed in Bytes, so your results are in MB not Mb. Then subtract the first date value from the second date value to see roughly how long it took the calculated data to pass through interface. Then divide the amount of calculated data by the number of calculated seconds and you will have a rough per second bandwidth value.
Example of part of the output from an ifconfig command execution on a BIG-IP:
2.04 - Explain potential L1 failure modes (duplex settings, cable out of specification)
Physical Layer (Layer 1) Failures
Physical layer or Layer 1 failures can be caused by many different problems from a simple misconfiguration or a hardware/infrastructure failure. Interface configurations like speed or duplex mismatch can be a failure due to auto-negotiate not working correctly or a mistake in manual configuration on interfaces at either end of the connection. This may result in a loss of packets in higher volume networks, collisions and or duplex errors. Interfaces may not be enabled in the configuration of the software causing interfaces to not respond at all.
Hardware and/or infrastructure failures can be caused by many different issues. Everything from power outages, power cycled devices, hardware failures, faulty SFP or built-in interface, disconnected cables, broken cabling, cabling that is out of TIA specifications, EMI and so on. Hardware failures usually result in a complete loss of connectivity but can sometimes cause errors to be logged on the actual system or in neighboring device logs.