Unofficial - F5 Certification Exam Prep Material > F5 101 - App Delivery Fundamentals Exam Study Guide - Created 03/06/20 Source | Edit on
Section 3 – Maintenance
Objective - 3.01 Given a scenario, review basic stats to confirm functionality
3.01 – Given a scenario, review basic stats to confirm functionality
You will need to be familiar with the types of statistics and information that are provided in TMOS. It is more likely that you will need to be familiar with GUI output, however console-based output will reflect the same information in a different format. The more familiar you are with looking at the information provided in either interface, the faster you can find the answer and move on to the next question.
3.01 – Interpret traffic object statistics
https://clouddocs.f5.com/cli/tmsh-reference/latest/commands/show.html
Local Traffic Object Statistics
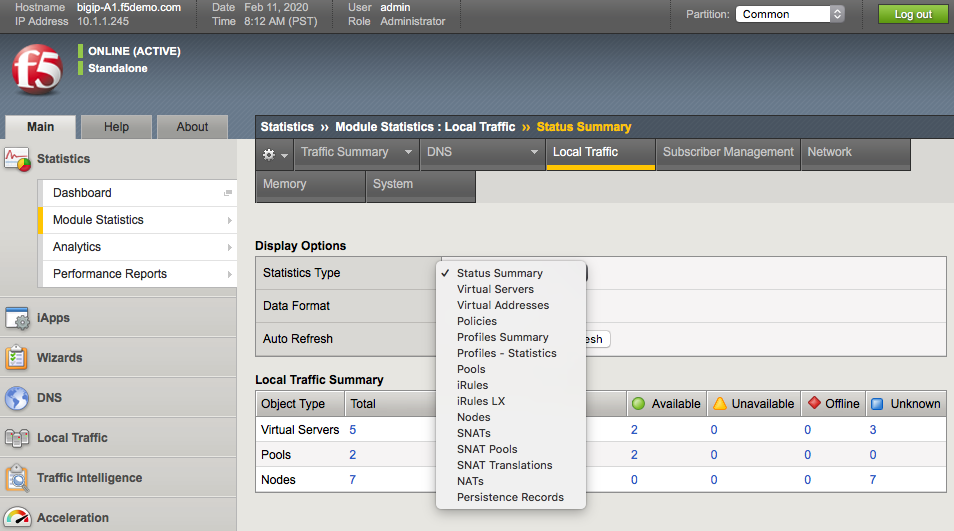
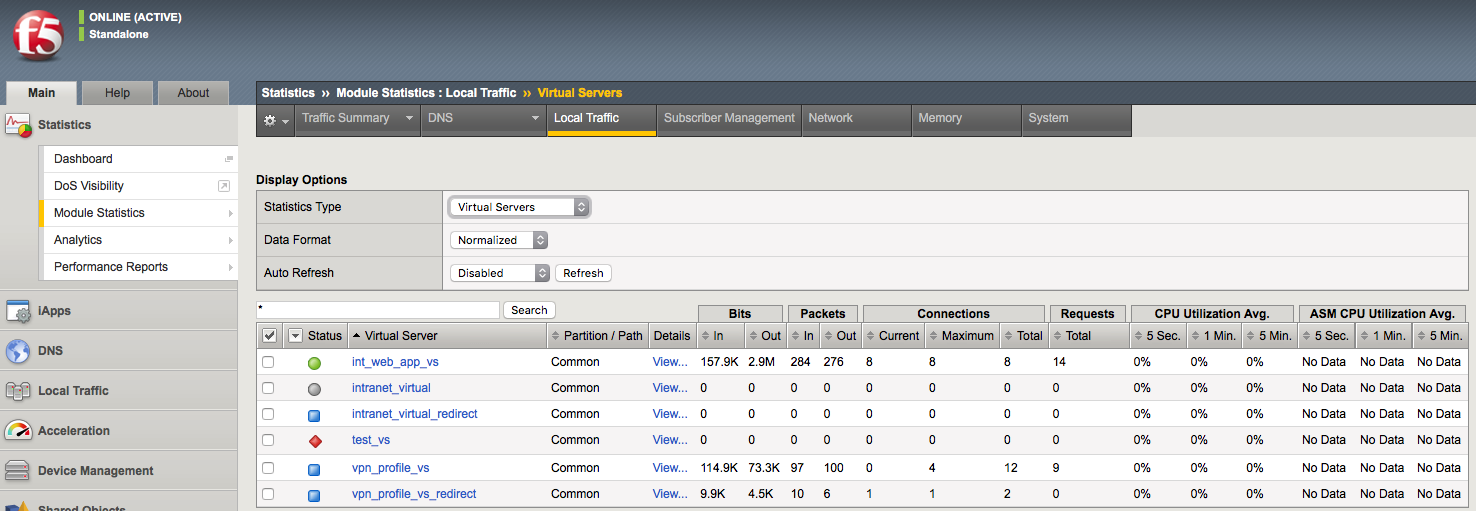
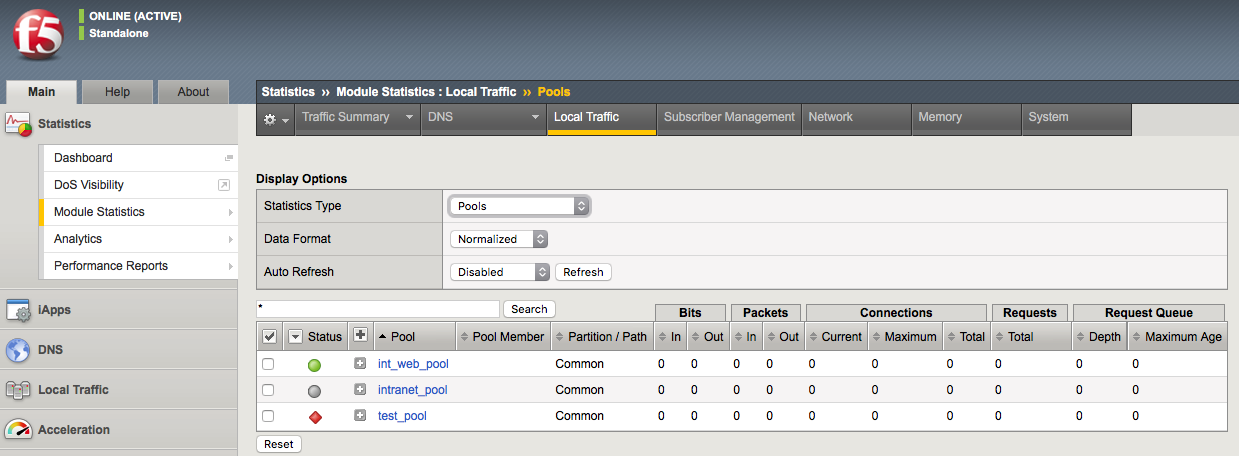
You should be familiar with assessing Statistics on the BIG-IP whether through the GUI or CLI. The system statistics for Local Traffic object can be found in the GUI under Statistics > Module Statistics > Local Traffic. From there you can examine all of the different object types shown below in the screenshot.
Virtual Servers screenshot:
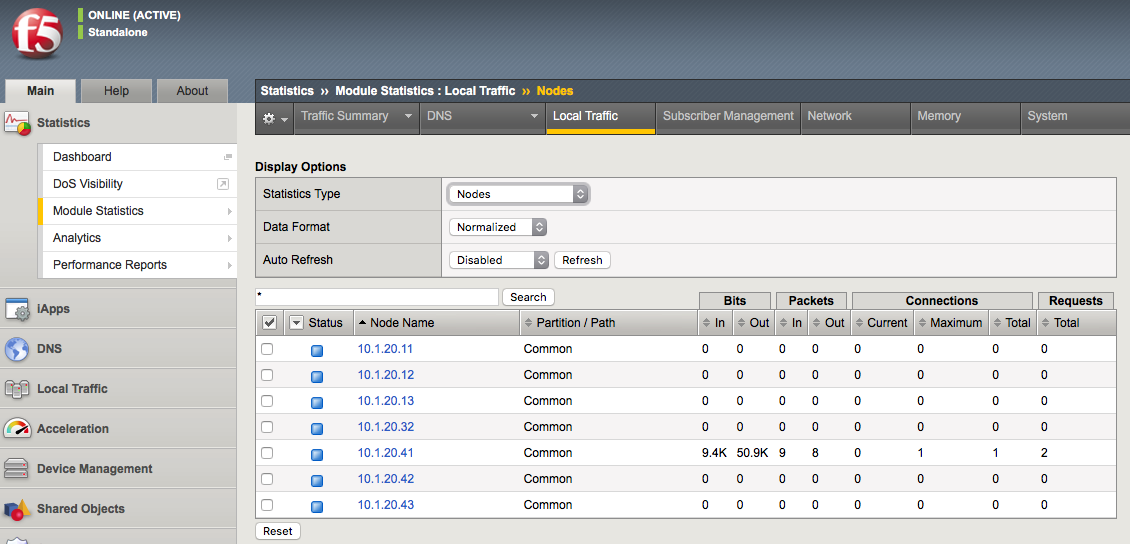
Nodes screenshot:
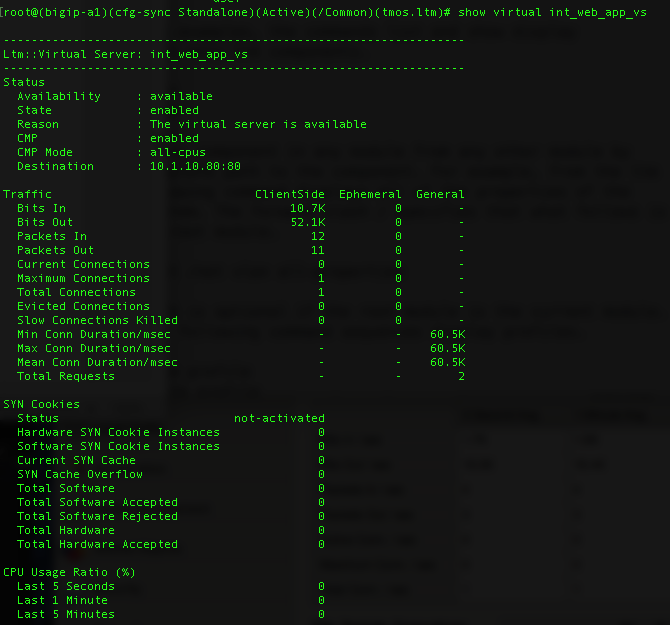
You can show the statistical info for traffic objects in the CLI with show commands in the tm shell.
(tmos.ltm)# show virtual int_web_app_vs
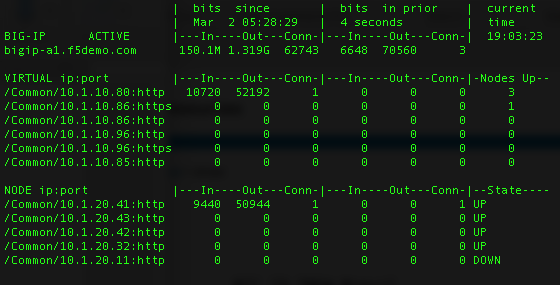
You can also use the bigtop command to show statistics in bash.
[root@bigip-a1:Active:Standalone] config # bigtop
3.01 – Interpret network configuration statistics
https://clouddocs.f5.com/cli/tmsh-reference/latest/commands/show.html
Network Configuration Statistics
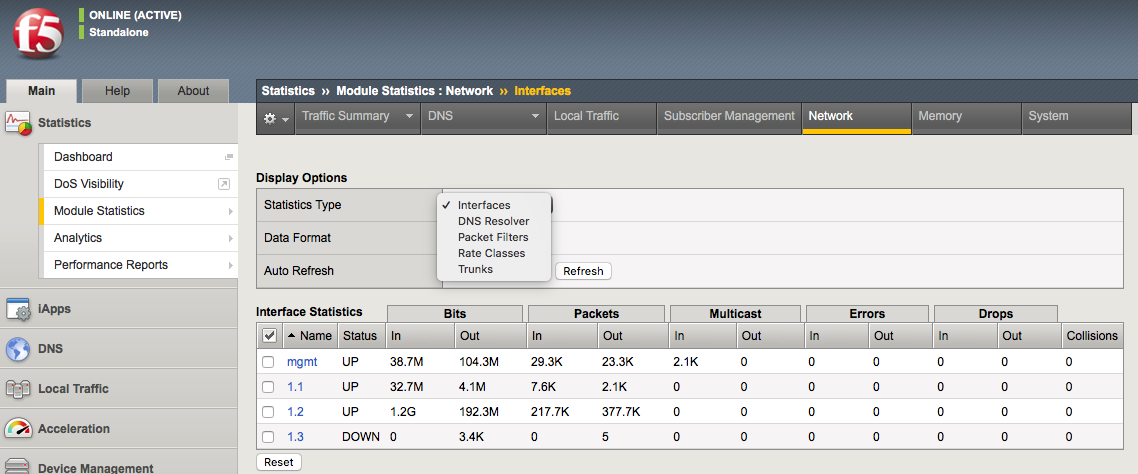
You should be familiar with assessing statistics on the BIG-IP whether through the GUI or CLI. The system statistics for network configuration can be found in the GUI under Statistics > Module Statistics > Local Traffic. From there you can examine all of the different object types shown below in the screenshot.
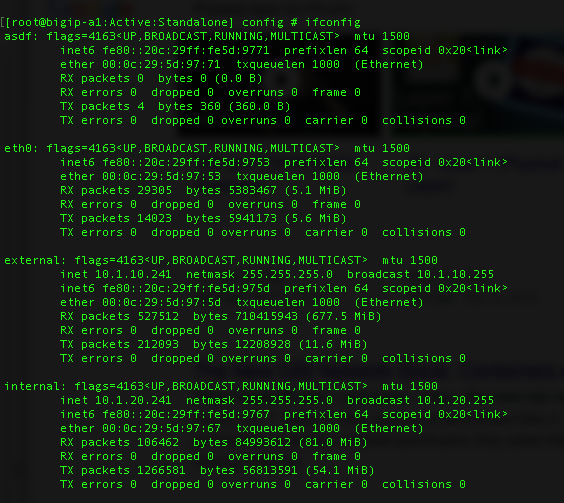
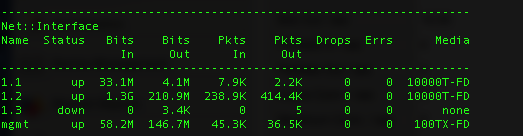
You can show the statistical info for network objects in the CLI with show commands in the tm shell.
(tmos)# show /net interface
Objective - 3.02 Given a scenario, determine device upgrade eligibility
3.02 - Given a scenario, determine device upgrade eligibility
https://devcentral.f5.com/s/articles/ihealth-upgrade-advisor-making-upgrades-a-little-easier-20001
iHealth Upgrade Advisor
Whether it is upgrading the firmware on a switch, the OS on a server, an important business application or the software on a BIG-IP, performing upgrades is something that makes almost all IT Admins and Network Engineers nervous. We’ve learned from (sometimes painful) experience that things don’t always go as planned.
Good preparation greatly increases the likelihood that an upgrade will be successful, which is why F5 has created the iHealth Upgrade Advisor. Its goal is to provide an additional service from F5 that will complement your existing upgrade preparations, increasing the predictability of the upgrade while reducing your upgrade time.
The iHealth Upgrade Advisor service provides a way for users to gain insight into potential issues with a BIG-IP upgrade before they attempt the upgrade. It provides guidance that is specific to a BIG-IP based on its configuration, the version of software it is currently running and the version you are planning to upgrade to.
When an issue can be avoided by making a configuration change prior to upgrading, the Upgrade Advisor will tell you exactly what to change. For some issues, it will list the corrective actions to take after the upgrade.
There is a video of iHealth Upgrade Advisor on the link of this section.
Accessing the Upgrade Advisor
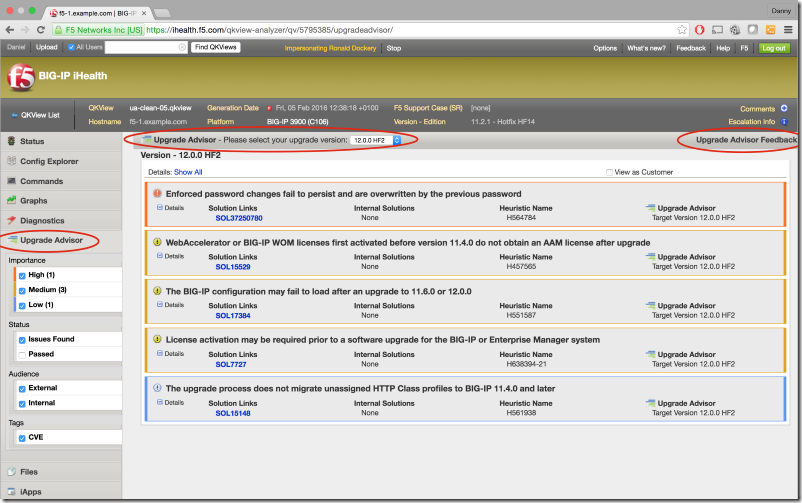
The next time you are preparing to upgrade a BIG-IP, login to ihealth.f5.com, upload a .qkview file from that BIG-IP and then view the qkview after iHealth has analyzed it. The Upgrade Advisor can be accessed by clicking on its tab in the left-hand menu. Simply select the version of BIG-IP you are planning to upgrade to in the advisor and review the results.
Here is a screenshot of the Upgrade Advisor:
As of the time of the release of the blueprint the iHealth Upgrade Advisor was available. As of January 14, 2020, it is no longer available.
3.02 - Determine when to upgrade platform
https://support.f5.com/csp/article/K4309
Upgrading platforms
The F5 platform lifecycle support policy defines the stages of the platform lifecycle from initial release through retirement. This policy describes the levels of support available for customers with a purchased Support Agreement. The intent of this policy is to provide consistent documentation that aids customers in planning and preparing for their organization’s support needs.
Illustration of a typical platform lifecycle
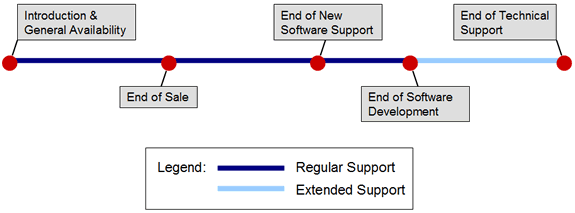
The most critical point for a platform is at a platform’s End of Software Development (EoSD). The End of Software Development date marks the end of the Regular Support phase and begins the Extended Support phase. The platform EoSD is the date that F5 Product Development has ceased considering the repair/maintenance of confirmed software/firmware defects for the designated platform or software release. Maintenance Release Software versions and Engineering hotfixes will be supported on a platform up until the Platform EoSD date. Unless specifically communicated differently by F5, a platform’s EoSD date defaults to three years after EoS.
There can be many factors that can cause a need for a platform upgrade, from the need for additional capacity to age of the system. Common sense will probably be necessary for this topic.
3.02 - Determine steps to minimize upgrade downtime
https://support.f5.com/csp/article/K84554955
Preparing for a software upgrade
Before you perform your software upgrade, F5 recommends that you make the following preparations:
When you have planned the date for the upgrade, you have the option to open a proactive service request to reduce the time needed to speak with a Support Engineer, should you encounter any technical issues during the upgrade procedure. For more information, refer to K16022: Opening a proactive service request with F5 Support.
Note: If you want F5 to provide full planning assistance during your upgrade, you can contact Professional Services. F5 Support will answer specific questions regarding your upgrade but cannot provide start-to-finish upgrade assistance. For more information, refer to Scope of Support.
Confirm your running BIG-IP software version using the TMOS Shell (tmsh) show /sys software status command. Note the Volume name in case you decide to boot a previous version at a later time (HD1.1 in the below example).
For example, the command and output on a system running BIG-IP 12.1.2 appears similar to the following example:
tmsh show /sys software status
Sys::Software Status
Volume Product Version Build Active Status
HD1.1 BIG-IP 12.1.2 0.0.249 yes complete
For BIG-IP 10.x systems, confirm that you are using the volume’s disk-formatting scheme. For more information, refer to the following two articles:
- K10817: Determining the disk-formatting scheme used by a BIG-IP version 10.x system
- K15459: BIG-IP systems that use partition disk style cannot be upgraded to versions 11.0.0 or later
Check the integrity of the running configuration. For BIG-IP 11.x and later use the tmsh load /sys config verify command. For BIG-IP 10.x and earlier, use bigpipe verify load. The system should not return any errors.
Note: Warnings may not hinder a software upgrade but if possible, you should correct them before you proceed with the upgrade.
Reactivate the system license. For more information, refer to K7727: License activation may be required prior to a software upgrade for the BIG-IP or Enterprise Manager system.
Verify that the BIG-IP device certificate has not expired. For more information, refer to K6353: Updating an SSL device certificate on a BIG-IP system.
For high availability (HA) BIG-IP systems, verify that all systems in the device group are in sync. For more information, refer to K13920: Performing a ConfigSync using the Configuration utility.
Note your local admin and root user passwords in case you need them for troubleshooting.
Generate a qkview diagnostics file and upload to BIG-IP iHealth to look for any triggered upgrade-related heuristics in the Diagnostics tab. For more information about qkview diagnostics, refer to K12878: Generating diagnostic data using the qkview utility.
Create a user configuration set (UCS) archive of the BIG-IP configuration and save it to a secure remote location in case it is needed for recovery purposes. Retain a UCS archive from every BIG-IP system in your network on a remote file store to aid disaster recovery. Even if the archive has aged and does not contain all configuration objects, it will provide faster recovery time than if you completely reconfigure the BIG-IP system. For more archive information, refer to the following articles:
- K4423: Overview of UCS archives
- K2880: Configuring a replacement BIG-IP device after a Return Materials Authorization
- K13551: Configuring a replacement BIG-IP device after an RMA when no UCS archive is available
Beginning in 11.6.3, 12.1.3, and 13.1.0, BIG-IP software no longer uses cumulative hotfixes. Product defects and security fixes are now included in a full release referred to as a point release. Point releases are identified by a fourth version element. If you intend to install these BIG-IP versions or later versions, you should download the point release that you plan to install from the F5 Downloads site. If you intend to install versions that support hotfixes, you should download the base BIG-IP version that you plan to install from the F5 Downloads site, including the latest hotfix, if available. For more information, refer to K167: Downloading software and firmware from F5.
Verify the integrity of the downloaded software images using the MD5 checksum utility. For more information, refer to K8337: Verifying the MD5 checksum for the downloaded F5 software file.
Objective - 3.03 Given a scenario, interpret traffic flow
3.03 - Explain application client-server communication
https://en.wikipedia.org/wiki/Client–server_model
client-server communication
Client–server model is a distributed application structure that partitions tasks or workloads between the providers of a resource or service, called servers, and service requesters, called clients. Often clients and servers communicate over a computer network on separate hardware, but both client and server may reside in the same system. A server host runs one or more server programs, which share their resources with clients. A client does not share any of its resources, but it requests content or service from a server. Clients therefore initiate communication sessions with servers, which await incoming requests. Examples of computer applications that use the client–server model are Email, network printing, and the World Wide Web.
3.03 - Interpret traffic graphs (Interpret SNMP results)
Traffic Graphs
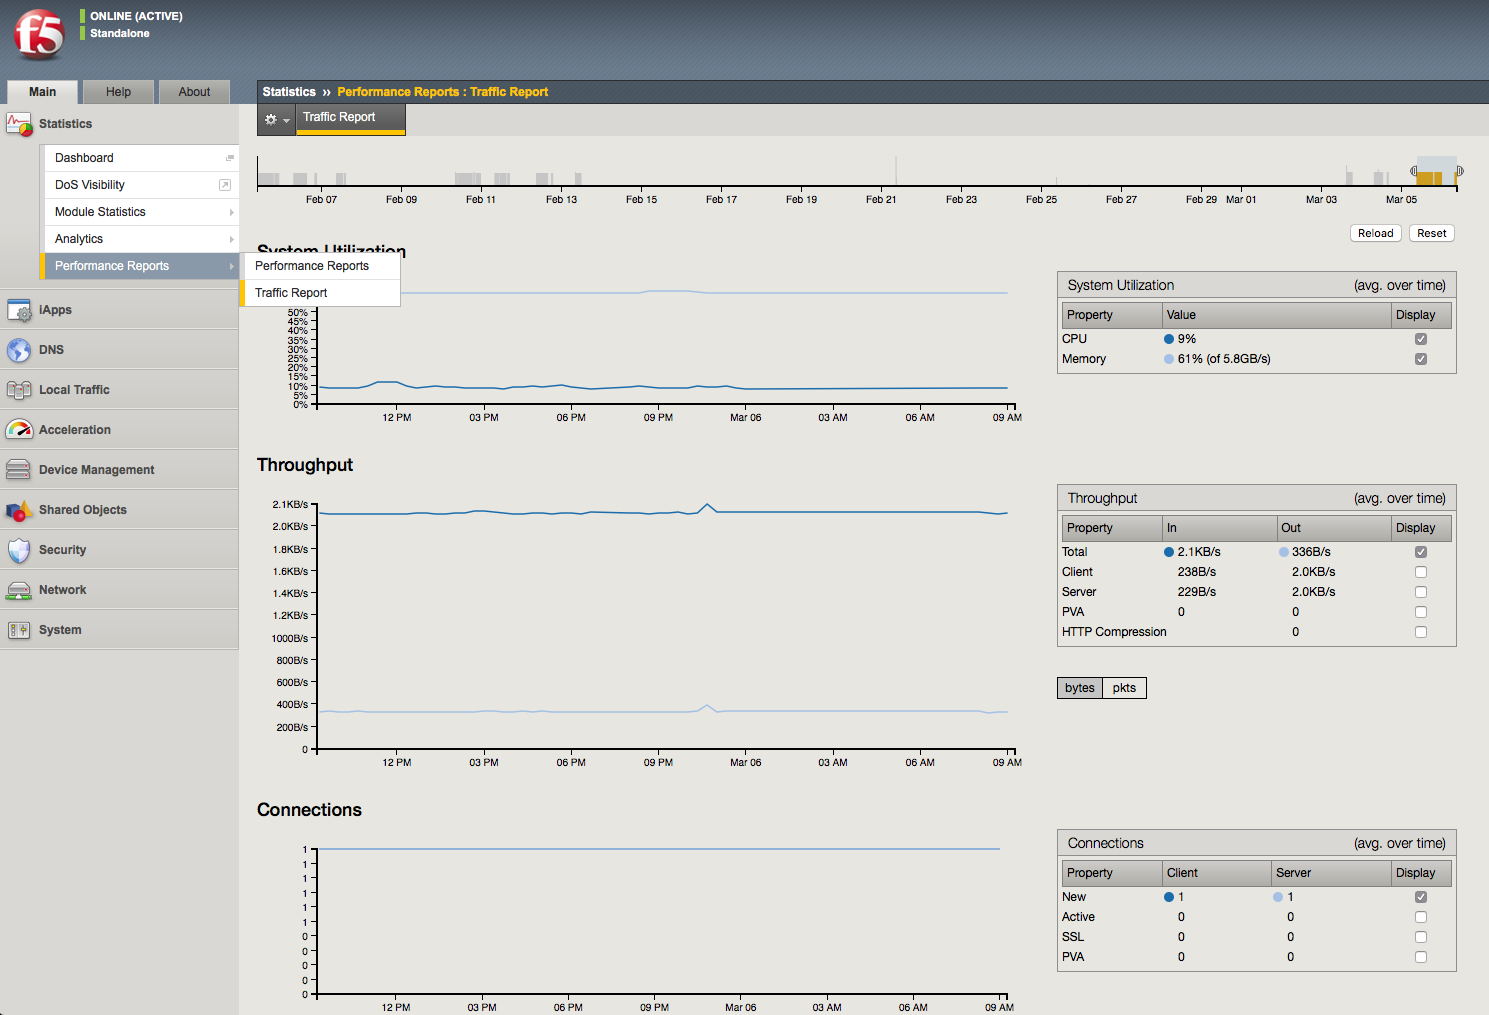
The BIG-IP system provides graphical interpretations of system traffic and other critical information. All of which can be found in the Statistics section of the Main Menu of the GUI. You should be familiar with all the graphical output that is provided and how to understand and read the information. It is very comprehendible even to a novice. All of the information that is represented can also be sent out via SNMP to remote monitoring systems, and those systems can also graph the information.
SNMP is an industry standard protocol for monitoring devices on IP networks. You can configure the BIG-IP system with SNMP traps and an SNMP agent that sends data to an SNMP manager. You can then use the collected data to help you troubleshoot the BIG-IP system.
Screenshot of Statistics > Performance Reports > Traffic Report:
Objective - 3.04 Given a scenario, interpret service status
3.04 - Compare active vs inactive ADC elements
https://support.f5.com/csp/article/K12213214
Active and Inactive Configuration Elements
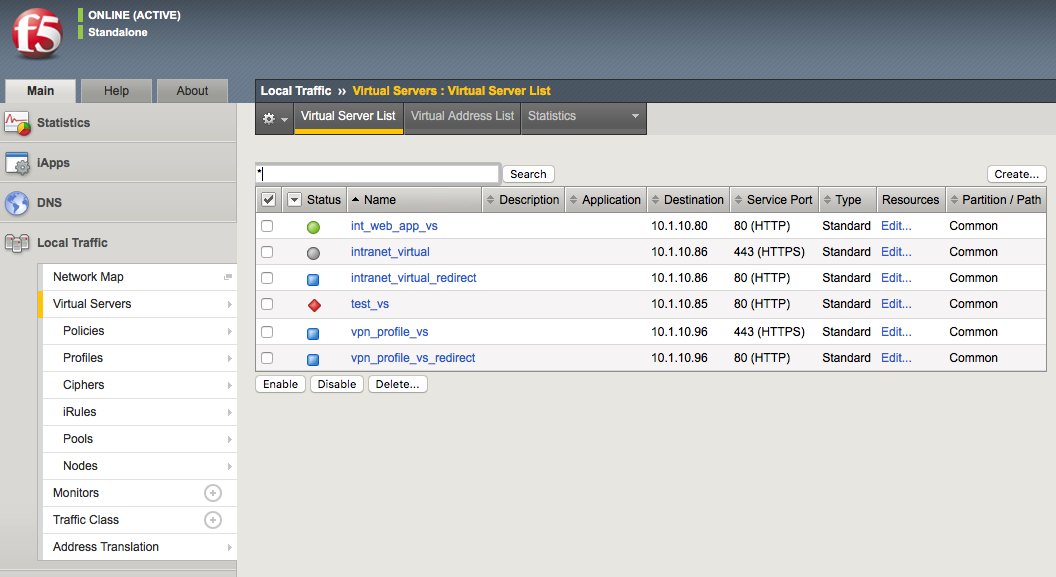
To determine which configuration objects are active or inactive can take a bit of observation. The service status of an object is not a direct indicator of activity. Service status can indicate if the object is capable of processing traffic. If the object status is Unavailable or is currently Disabled by an administrator cannot actively process traffic. An object that has a status of Available can receive/process traffic, but that status does not mean that it is actively processing traffic, only that it can. There can always be configuration objects which are not actively being used for processing traffic, yet are in the configuration. To see information on objects that are active and inactive, a quick look at the object status is the easy check to see if it can take traffic but then you need to see the statistics of available objects to know if they are active.
Status indicators
The Configuration utility displays various colored icons to report the status of these objects. When you point to the status icon that accompanies an object, the BIG-IP system displays information about the object’s status. The following table lists the icons that the Configuration utility displays.
| Status Indicator | Description |
Green circle 
|
The object is available. This icon indicates that the BIG-IP system services traffic destined for this object. For BIG-IP APM sessions, this icon indicates that the session is established. |
Blue square 
|
The availability of the object is unknown. For example, this status can occur when the object is not configured for service checking, the IP address of the object is misconfigured, or the object is disconnected from the network. For BIG-IP APM sessions, this icon indicates that the session is pending and not yet established. Note: Pool members and nodes with a status of unknown are eligible to receive client requests. |
Yellow triangle 
|
The object is not currently available but might become available later with no user intervention. For example, an object that has reached its configured connection limit might show a yellow status and then switch to a green status when the number of connections falls below the configured limit. |
Red diamond 
|
The object is unavailable. This icon indicates that the BIG-IP system cannot service traffic destined for this object. For example, this status can occur when a node fails service checking because it has become unavailable. This status requires user intervention to restore the object status to green. |

|
A user has actively disabled an available object. |

|
A user has actively disabled an unavailable object. |
Gray icons 


|
A parent object has disabled the object, or the object is enabled but unavailable because of another disabled object. |
Black Square 
|
The availability of the object is unknown, and the object is disabled. |
Status icons for configuration objects in the GUI:
Traffic statistics indicating which objects are or are not actively receiving traffic.
3.04 - Infer services for given netstat output
https://en.wikipedia.org/wiki/List_of_TCP_and_UDP_port_numbers
Infer services for given netstat
The netstat command can provide plenty of information on the services running on a system. If the netstat -tulpn | grep LISTEN is used the returning information will contain which services are listening on what ports. It will also provide the name of the service on the system.
Example:
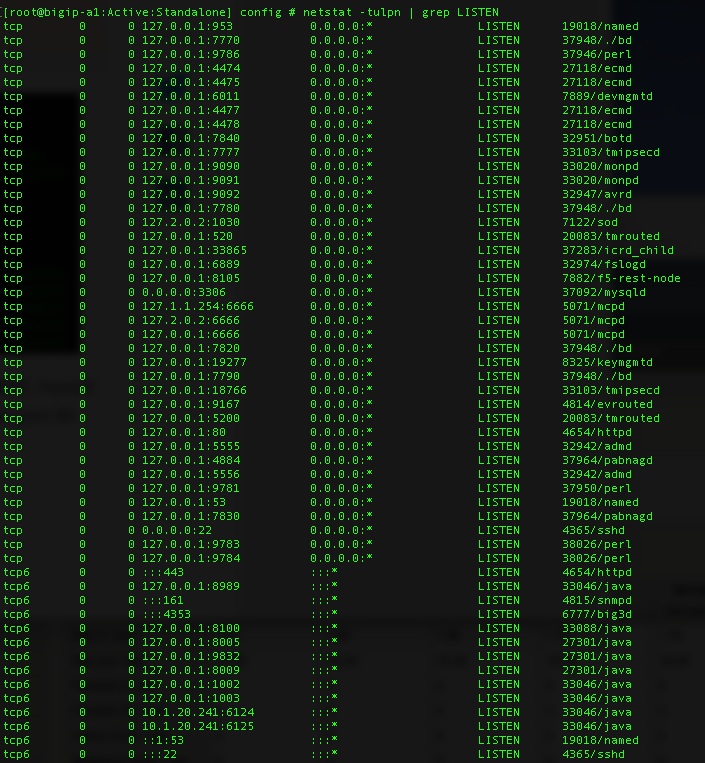
However, if the netstat command did not include all of these switches the output may not be as defined and you may have to know which services use which port numbers.
There are 65536 ports per IP address, and each can be used. You should be familiar with as many of the well-known ports and their associated services as possible, as well as the proprietary ports that F5 uses like 4353 for iquery. My guess is this topic will ask if a certain service is running on the system or which IP is running a particular service on the system and you will have to use the netstat output to determine the answer. As long as you are familiar with netstat output and the common ports and their services you should be able to figure this one out.
3.04 - Determine whether a service is listening on a given port based on netstat output
https://www.thegeekstuff.com/2010/03/netstat-command-examples/
netstat Output
Netstat command displays various network related information such as network connections, routing tables, interface statistics, masquerade connections, multicast memberships etc.
The netstat -a command will list all ports, both listening and non-listening. There are variations on the -a switch that can allow you to see just TCP ports (-at) or UDP ports (-au).
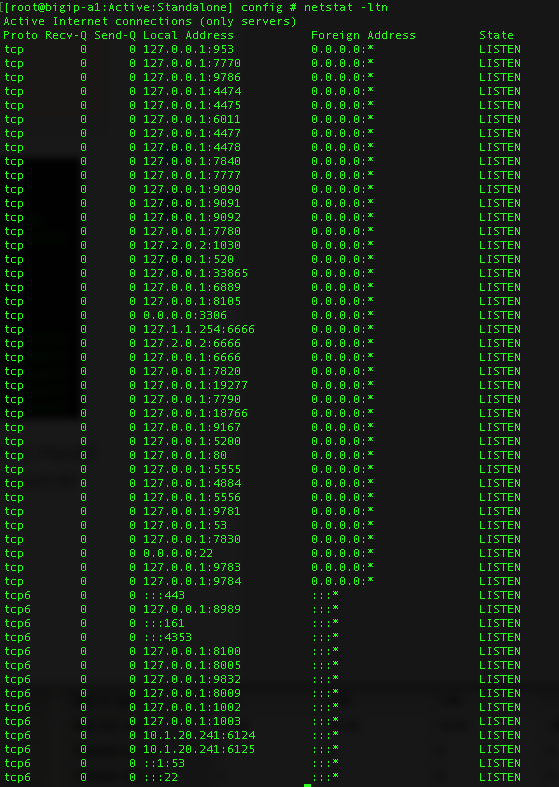
You can use netstat -l to list just the listening ports. There are variations on the -l switch that can allow you to see just TCP ports (-lt), UDP ports (-lu), UNIX ports (-lx).
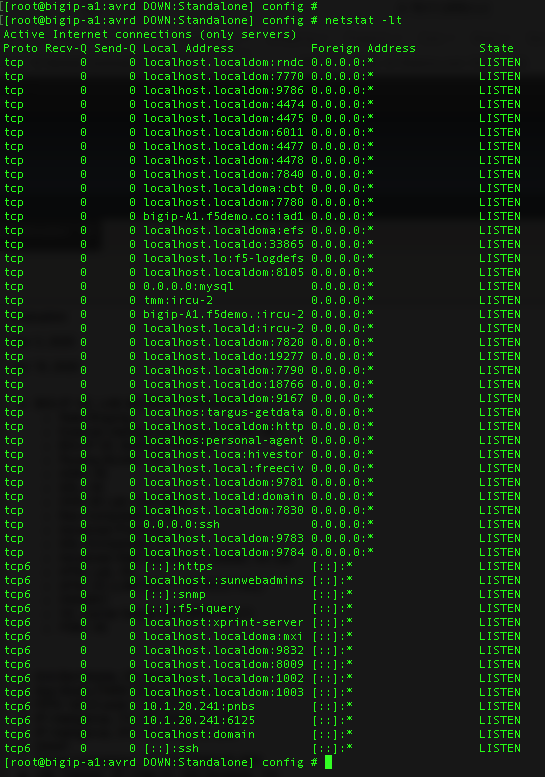
The output of netstat -lt on a BIG-IP system will give you something similar to the output below.
Objective - 3.05 Given a scenario, interpret system health
3.05 - Generate a Qkview and upload to iHealth
https://support.f5.com/csp/article/K12878#5
QKview
To run the qkview utility from the Configuration utility in BIG-IP 13.0.0 and later, perform the following procedure:
Impact of procedure: The qkview utility runs a large number of commands when collecting information. This behavior may cause an additional performance burden on systems that are already under heavy load.
- Log in to the Configuration utility.
- Go to System > Support.
- Select New Support Snapshot.
- For Health Utility, select Generate QKView.
- Select Start.
- To download the output file, select Download.
Note: Starting in BIG-IP 13.1.0, you can override the default 5 MB maximum log file size of the QKView by selecting the Unlimited snaplen check box in the QKView Options section prior to selecting Start. Overriding the default size limit can result in very large QKView files. You should only use this option when instructed to do so by F5 Support.
Uploading a QKView file to F5 iHealth
After you obtain the QKView diagnostic file, you can upload the file to F5 iHealth to diagnose the health and proper operation of your BIG-IP or BIG-IQ system. To do so, perform the following procedure:
Impact of procedure: The qkview utility runs a large number of commands when collecting information. This behavior may cause an additional performance burden on systems that are already under heavy load.
- Open a web browser and log in to the F5 iHealth site.
- Select Upload.
- Select Choose.
- Go to the QKView file on your local system.
Note: As an alternative to using F5 iHealth, you can also provide the QKView file to F5 Support. To do so, refer to K2486: Providing files to F5 Support.
3.05 - Review logs
https://support.f5.com/csp/article/K16197
Reviewing BIG-IP log files
BIG-IP log files include important diagnostic information about the events that are occurring on the BIG-IP system. Some of the events pertain to the Linux host. For example, the Linux host generates system messages that pertain to the Linux host operating system, including messages that are logged during system startup, and information logged by the background daemons that run on the system. Other events are specific to the BIG-IP operating system. For example, the BIG-IP operating system generates messages that pertain to local and global traffic events, and configuration changes (audit logging).
Local logging
By default, the BIG-IP system logs events locally and stores messages in the /var/log directory. For BIG-IP events, the system routes messages from the errdefs subsystem through syslog-ng to the local log files. For non-BIG-IP events, the system routes messages directly through syslog-ng to the local log files. In addition, you can configure the system to use the high-speed logging mechanism (HSL) to store the logs in either the syslog or the MySQL database.
Remote logging
You can configure the system to use the HSL mechanism to log messages to a pool of remote log servers. If the BIG-IP system processes a high volume of traffic or generates an excessive amount of log files, F5 recommends that you configure remote logging.
BIG-IP log types
Each type of event is stored locally in a separate log file, and the information stored in each log file varies depending on the event type. All log files for these event types are in the /var/log directory.
| Type | Description | Log file |
|---|---|---|
| audit | The audit event messages are messages that the BIG-IP system logs as a result of changes to the BIG-IP system configuration. Logging audit events is optional. | /var/log/audit |
| boot | The boot messages contain information that is logged when the system boots. | /var/log/boot.log |
| cron | When the cron daemon starts a cron job, the daemon logs the information about the cron job in this file. | /var/log/cron |
| daemon | The daemon messages are logged by various daemons that run on the system. | /var/log/daemon.log |
| dmesg | The dmesg messages contain kernel ring buffer information that pertains to the hardware devices that the kernel detects during the boot process. | /var/log/dmesg |
| GSLB | The GSLB messages pertain to global traffic management events. | /var/log/gtm |
| httpd | The httpd messages contain the Apache Web server error log. | /var/log/httpd/httpd_errors |
| kernel | The kernel messages are logged by the Linux kernel. | /var/log/kern.log |
| local traffic | The local traffic messages pertain specifically to the BIG-IP local traffic management events. | /var/log/ltm |
| The mail messages contain the log information from the mail server that is running on the system. | /var/log/maillog | |
| packet filter | The packet filter messages are those that result from the use of packet filters and packet-filter rules. | /var/log/pktfilter |
| security | The secure log messages contain information related to authentication and authorization privileges. | /var/log/secure |
| system | The system event messages are based on global Linux events, and are not specific to BIG-IP local traffic management events. | /var/log/messages |
| TMM | The TMM log messages are those that pertain to Traffic Management Microkernel events. | /var/log/tmm |
| user | The user log messages contain information about all user level logs. | /var/log/user.log |
| webui | The webui log messages display errors and exception details that pertain to the Configuration utility. | /var/log/webui.log |
You can view log files that are logged locally on the BIG-IP system by using the Configuration utility, tmsh, or bash.
Using the Configuration utility to review log files
The most commonly used log files (for example, System, Local Traffic, Audit) are displayed in the Configuration utility. To review log files using the Configuration utility, perform the following steps:
- Log in to the Configuration utility.
- Navigate to System > Logs.
- Click the tab that corresponds to the type of logging category you want to review.
- Use the Search field to search for event strings or use the drop-down menu to page through the available logs.
3.05 - Ensure efficacy of maintenance tasks (alert endpoints, verify backups)
https://support.f5.com/csp/article/K34421741
Maintenance Tasks
There are many maintenance tasks required to manage any system successfully. The BIG-IP TMOS operations guide is a great place to start understanding the basic tasks and how often they need to be done as well as links to the guides on how to do the tasks successfully.
3.05 - Review system vitals (disk space, CPU load, memory, bandwidth)
BIG-IP System Vitals
Using AVR you can display system level statistics over a period of time in graphical charts on the BIG-IP system. Several charts are available, and they show the following information:
- Internet Protocol (IP) packets, errors, and fragments
- Virtual server traffic details, TCP traffic, and UDP traffic
- CPU usage
- CPU utilization per process
- Memory statistics for TMM, other processes, system RAM, and swap space
- Disk activity, sizes, and latency
You can view the historical statistics for different periods of time. On systems with multiple slots, you can view the statistics for each slot. You can also export the information in any of the reports to PDF or comma-separated value (CSV) format, and save the reports or email them.
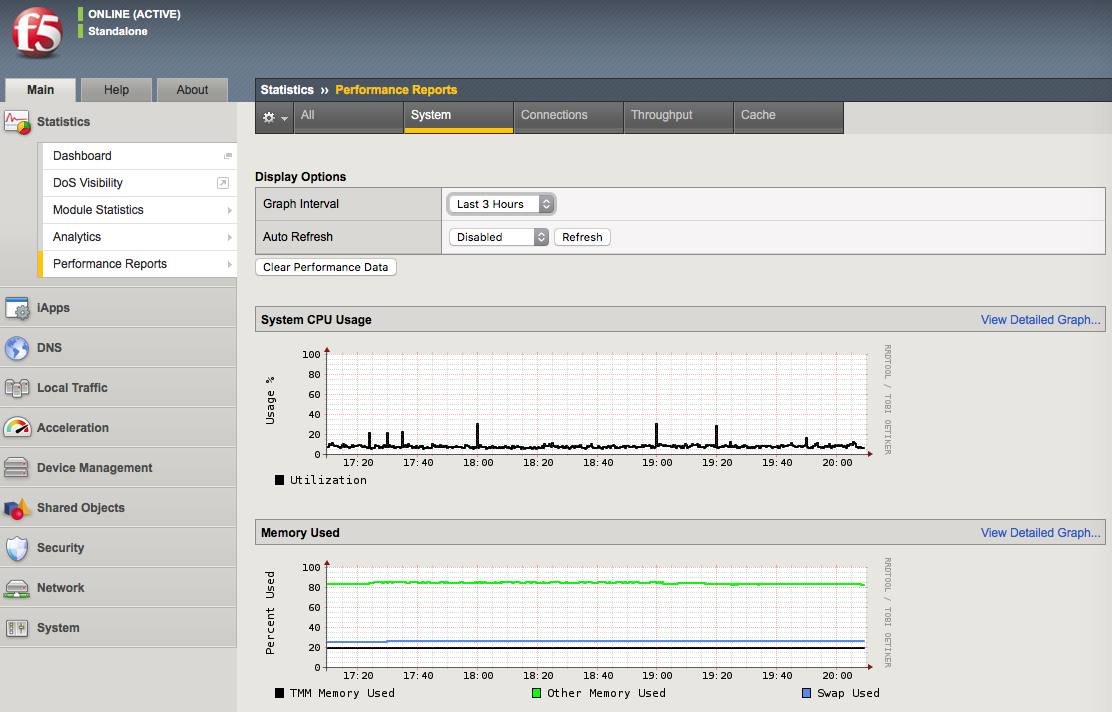
But if AVR is not provisioned on the system you can look at system level information in the GUI or CLI. In the GUI the information can be found in Statistics > Performance Reports. The data is presented in MRTG style graphs that are easy to understand.
Screen shot of system performance statistics on BIG-IP: