F5 Distributed Cloud > F5 Distributed Cloud - Introduction to Deployment Models and Services Source | Edit on
Lab 5: Introduction to Observability
Have you ever wished that you knew about impending application issues before your users or boss did? Application performance issues or outages usually provide clues before they manifest into larger problems. Synthetic monitors provides you the opportunity to often fix them before they become large-scale issues.
Task 1: Create a synthetic monitor
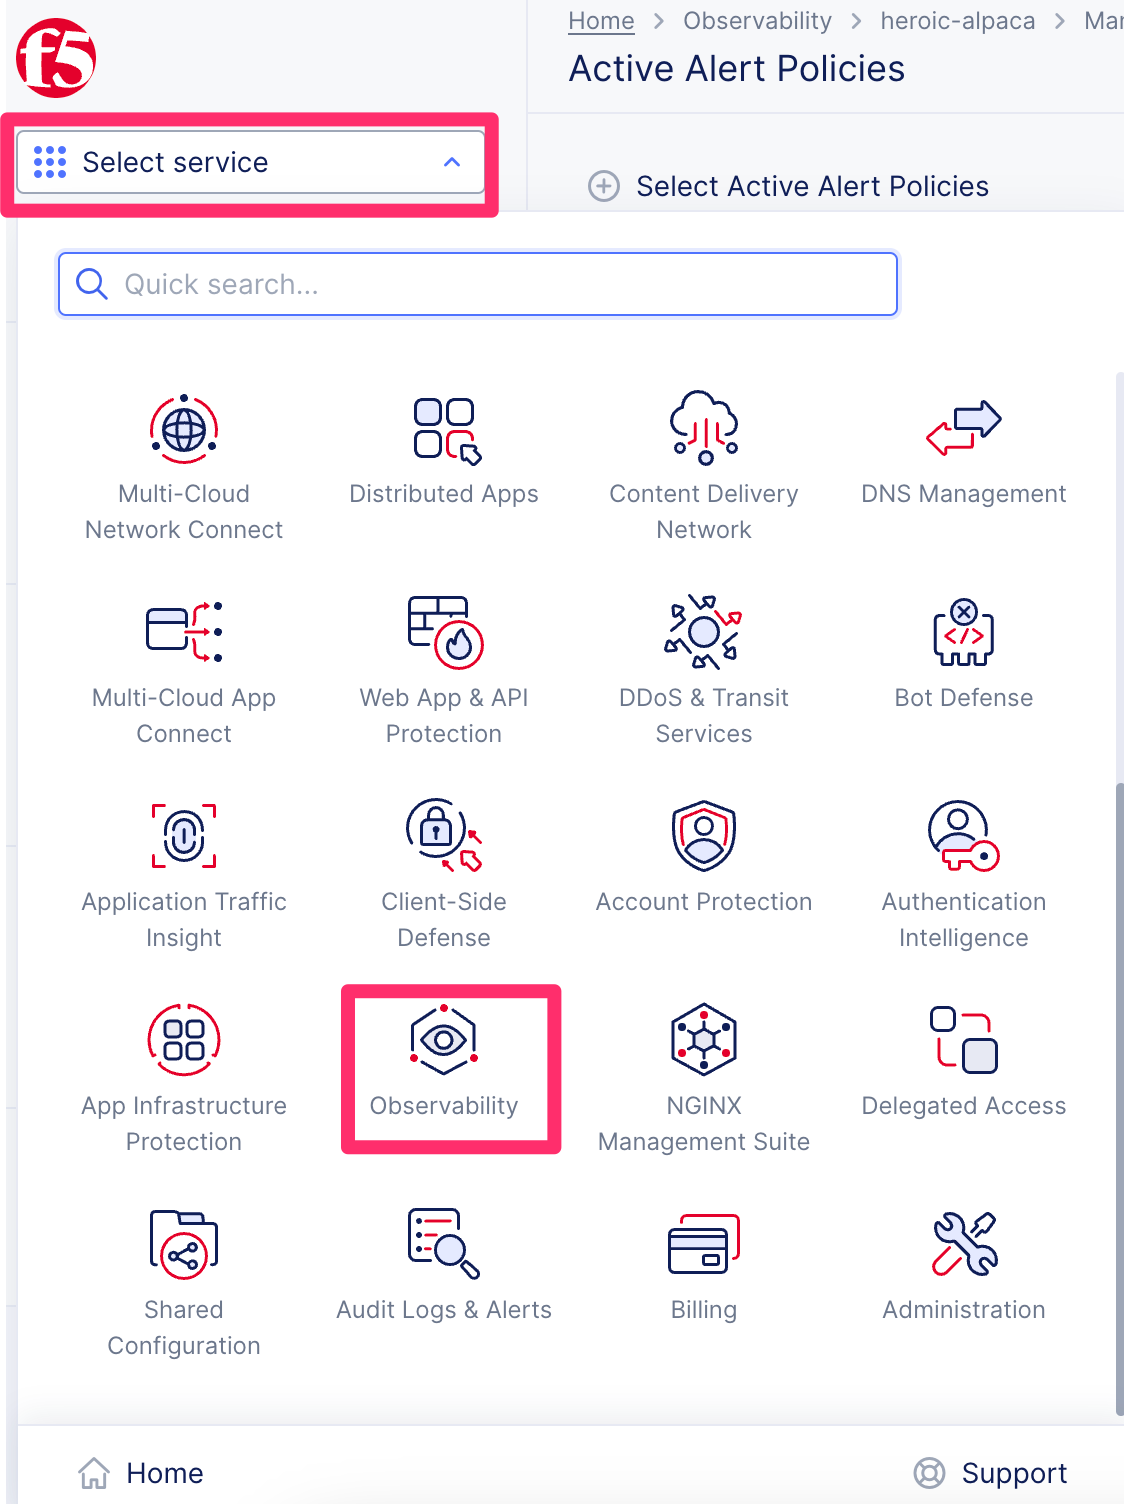
Click the “Select Service” drop down menu on the sidebar and select “Observability”.
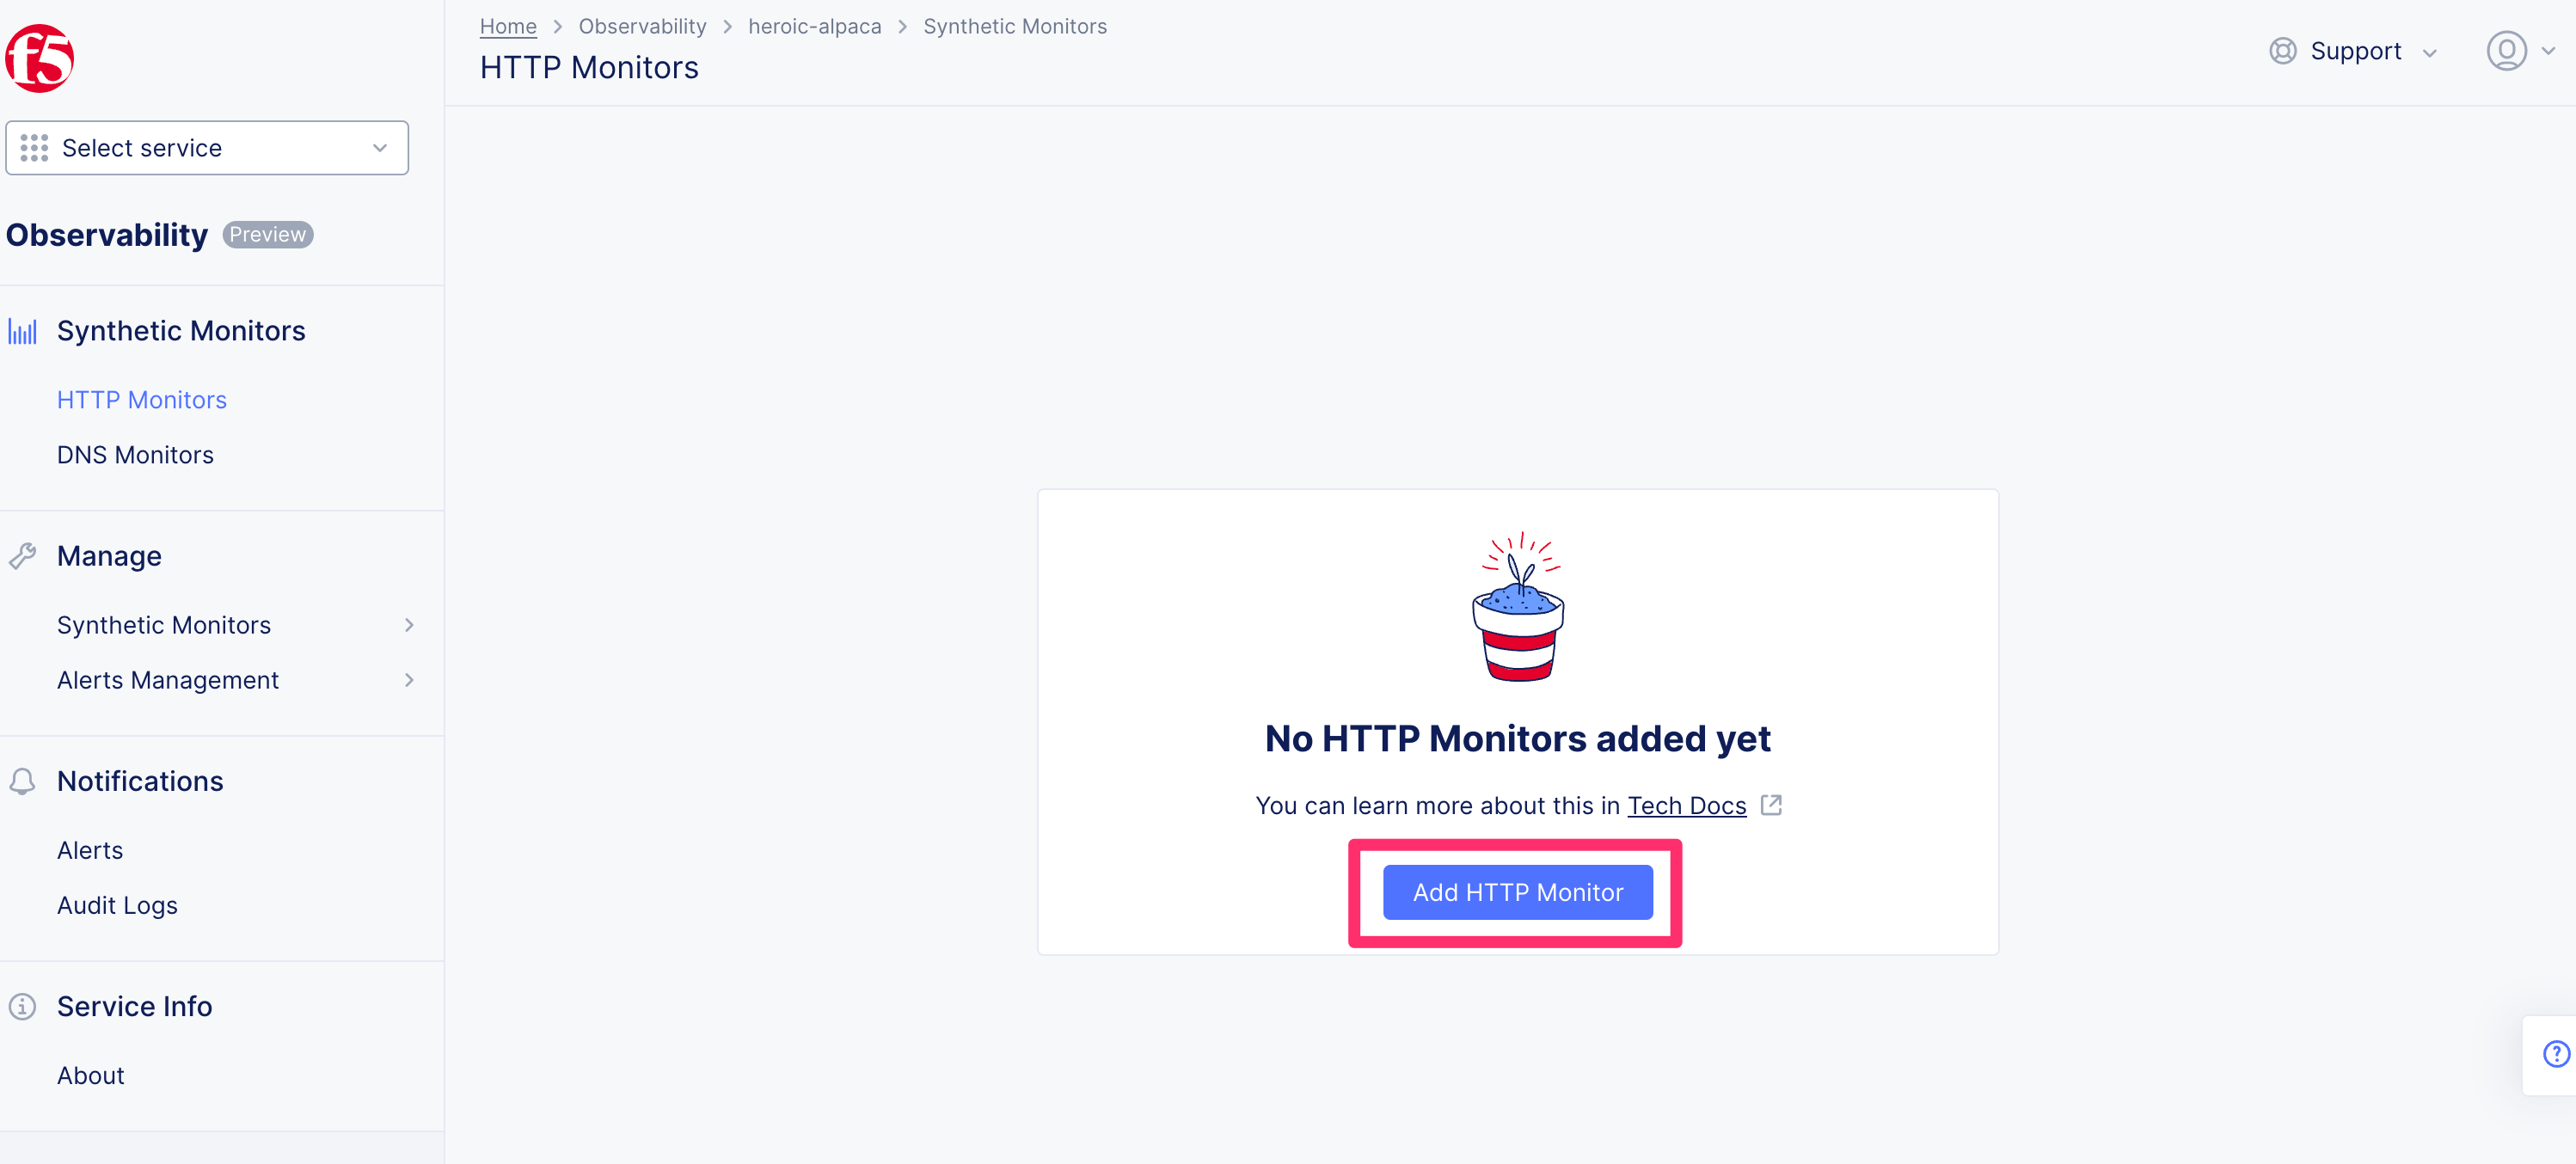
Click the “Add HTTP Monitor” button.
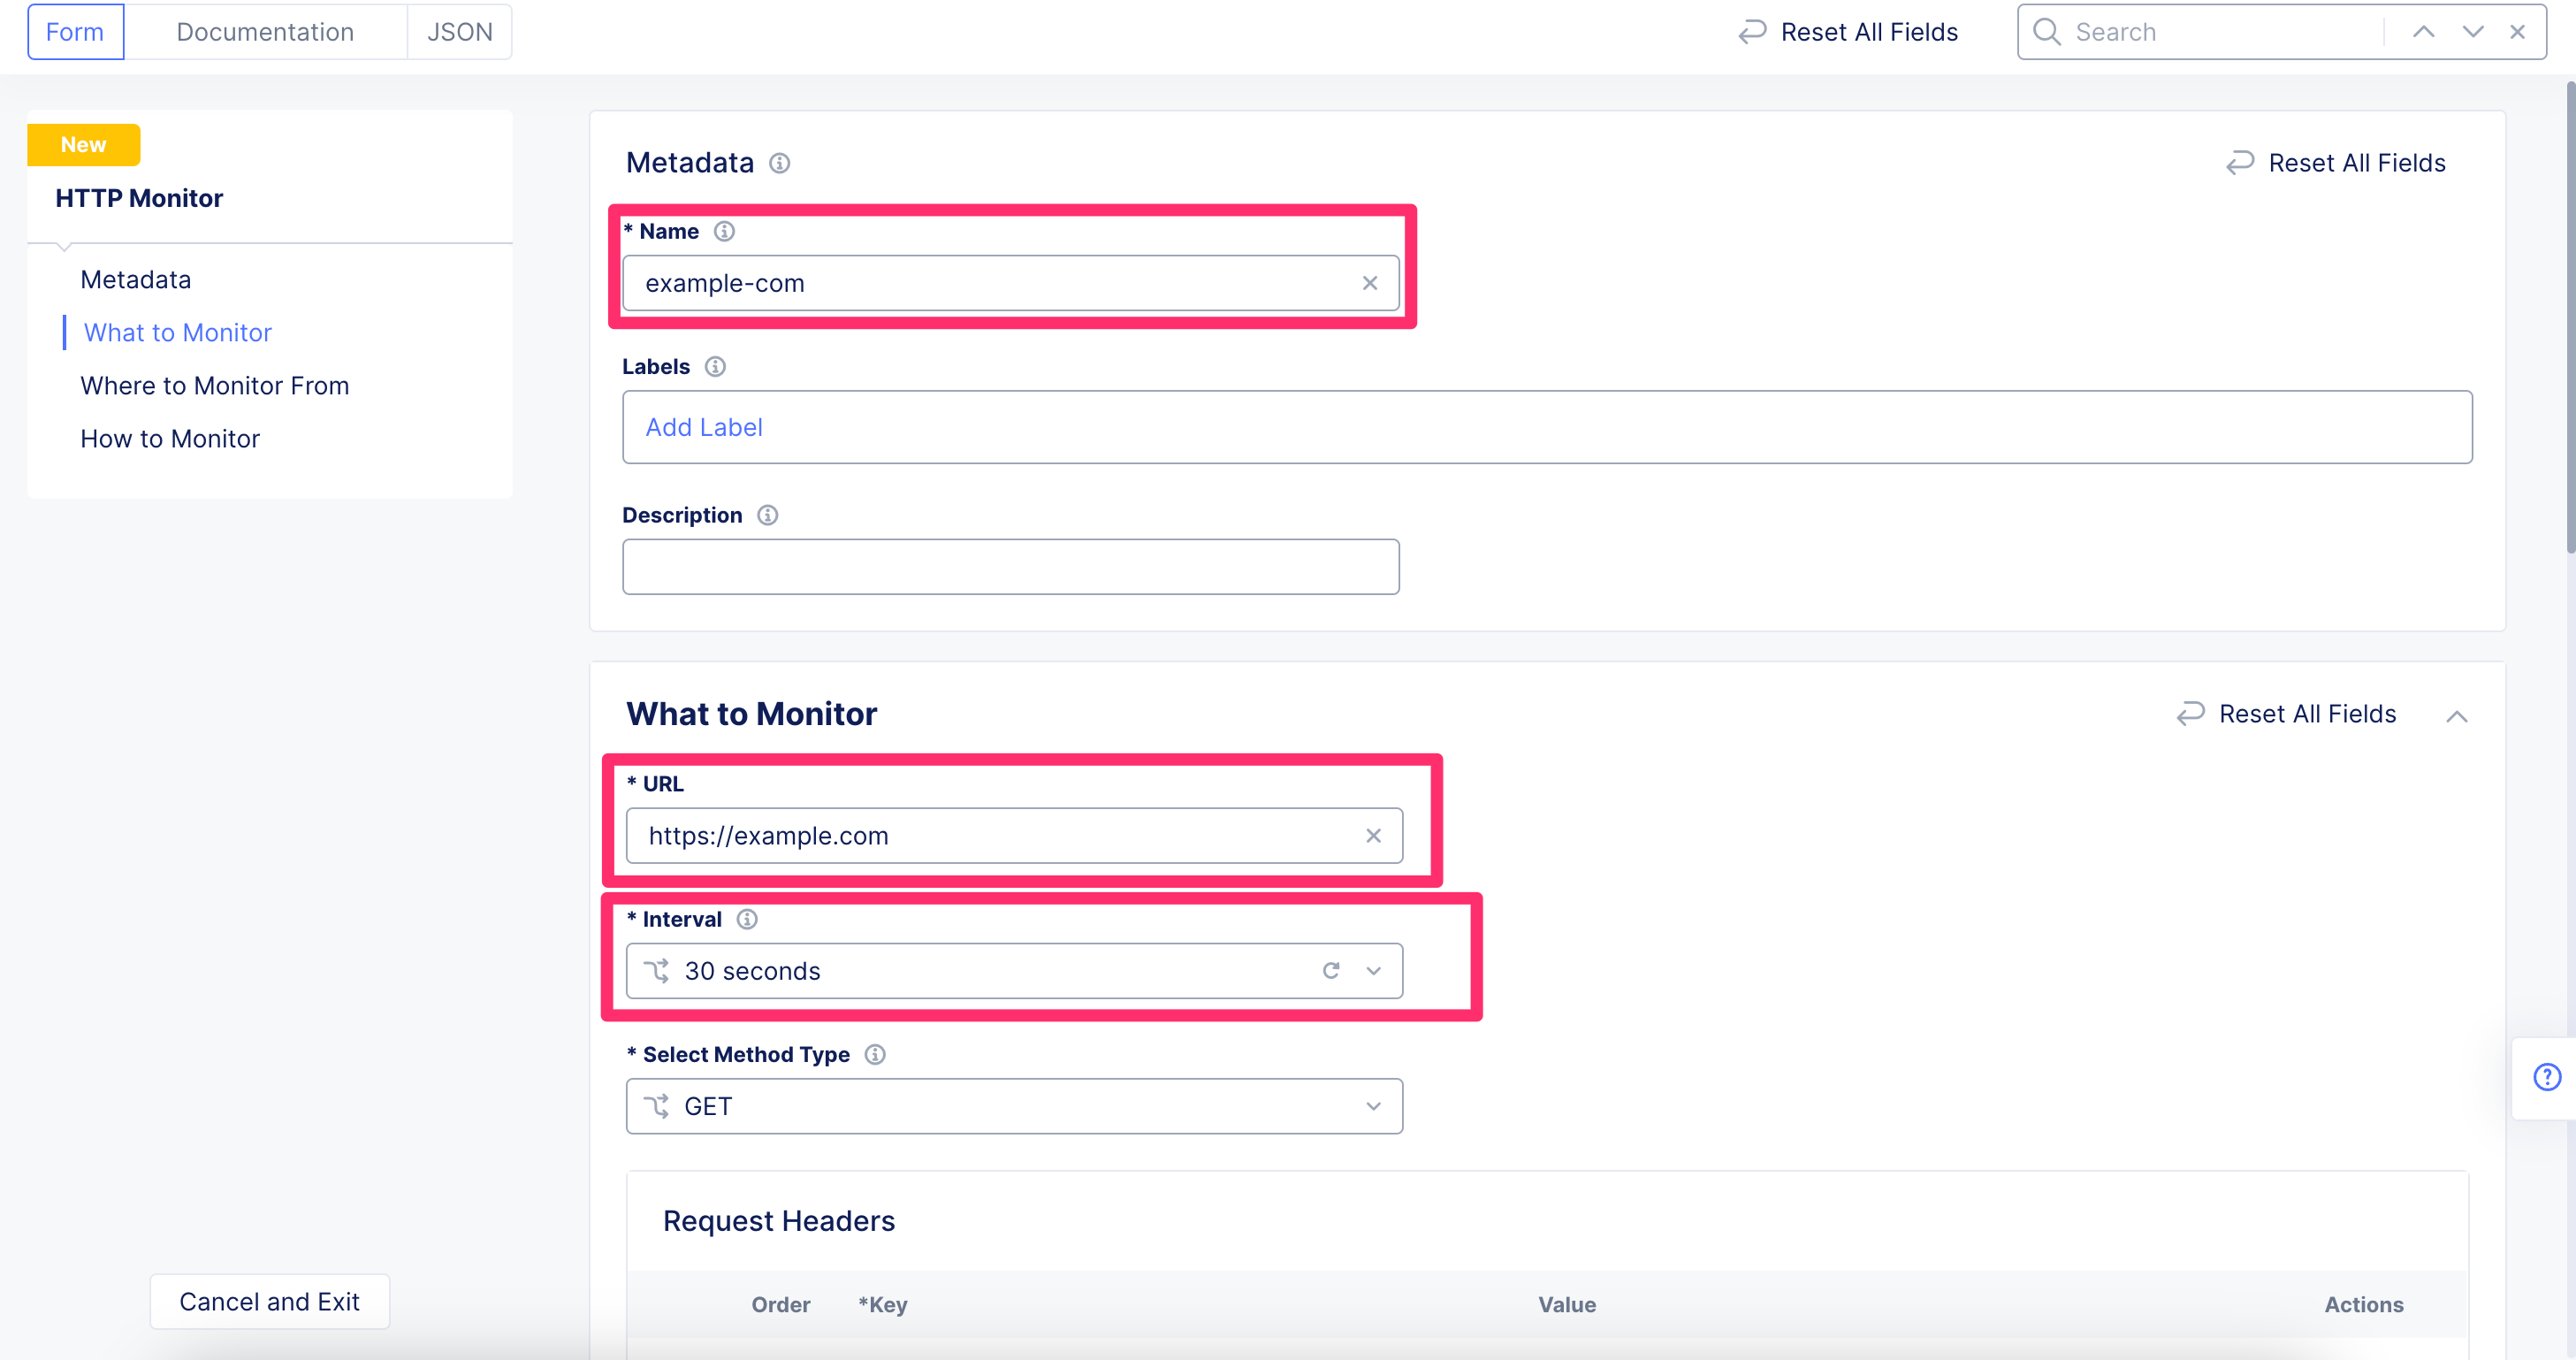
In the name field, type “example-com”.
In the URL field, type “https://example.com”.
Click on the Interval drop down menu, choose “30 seconds”.
In the External Sources area, click the “Add Item” button.
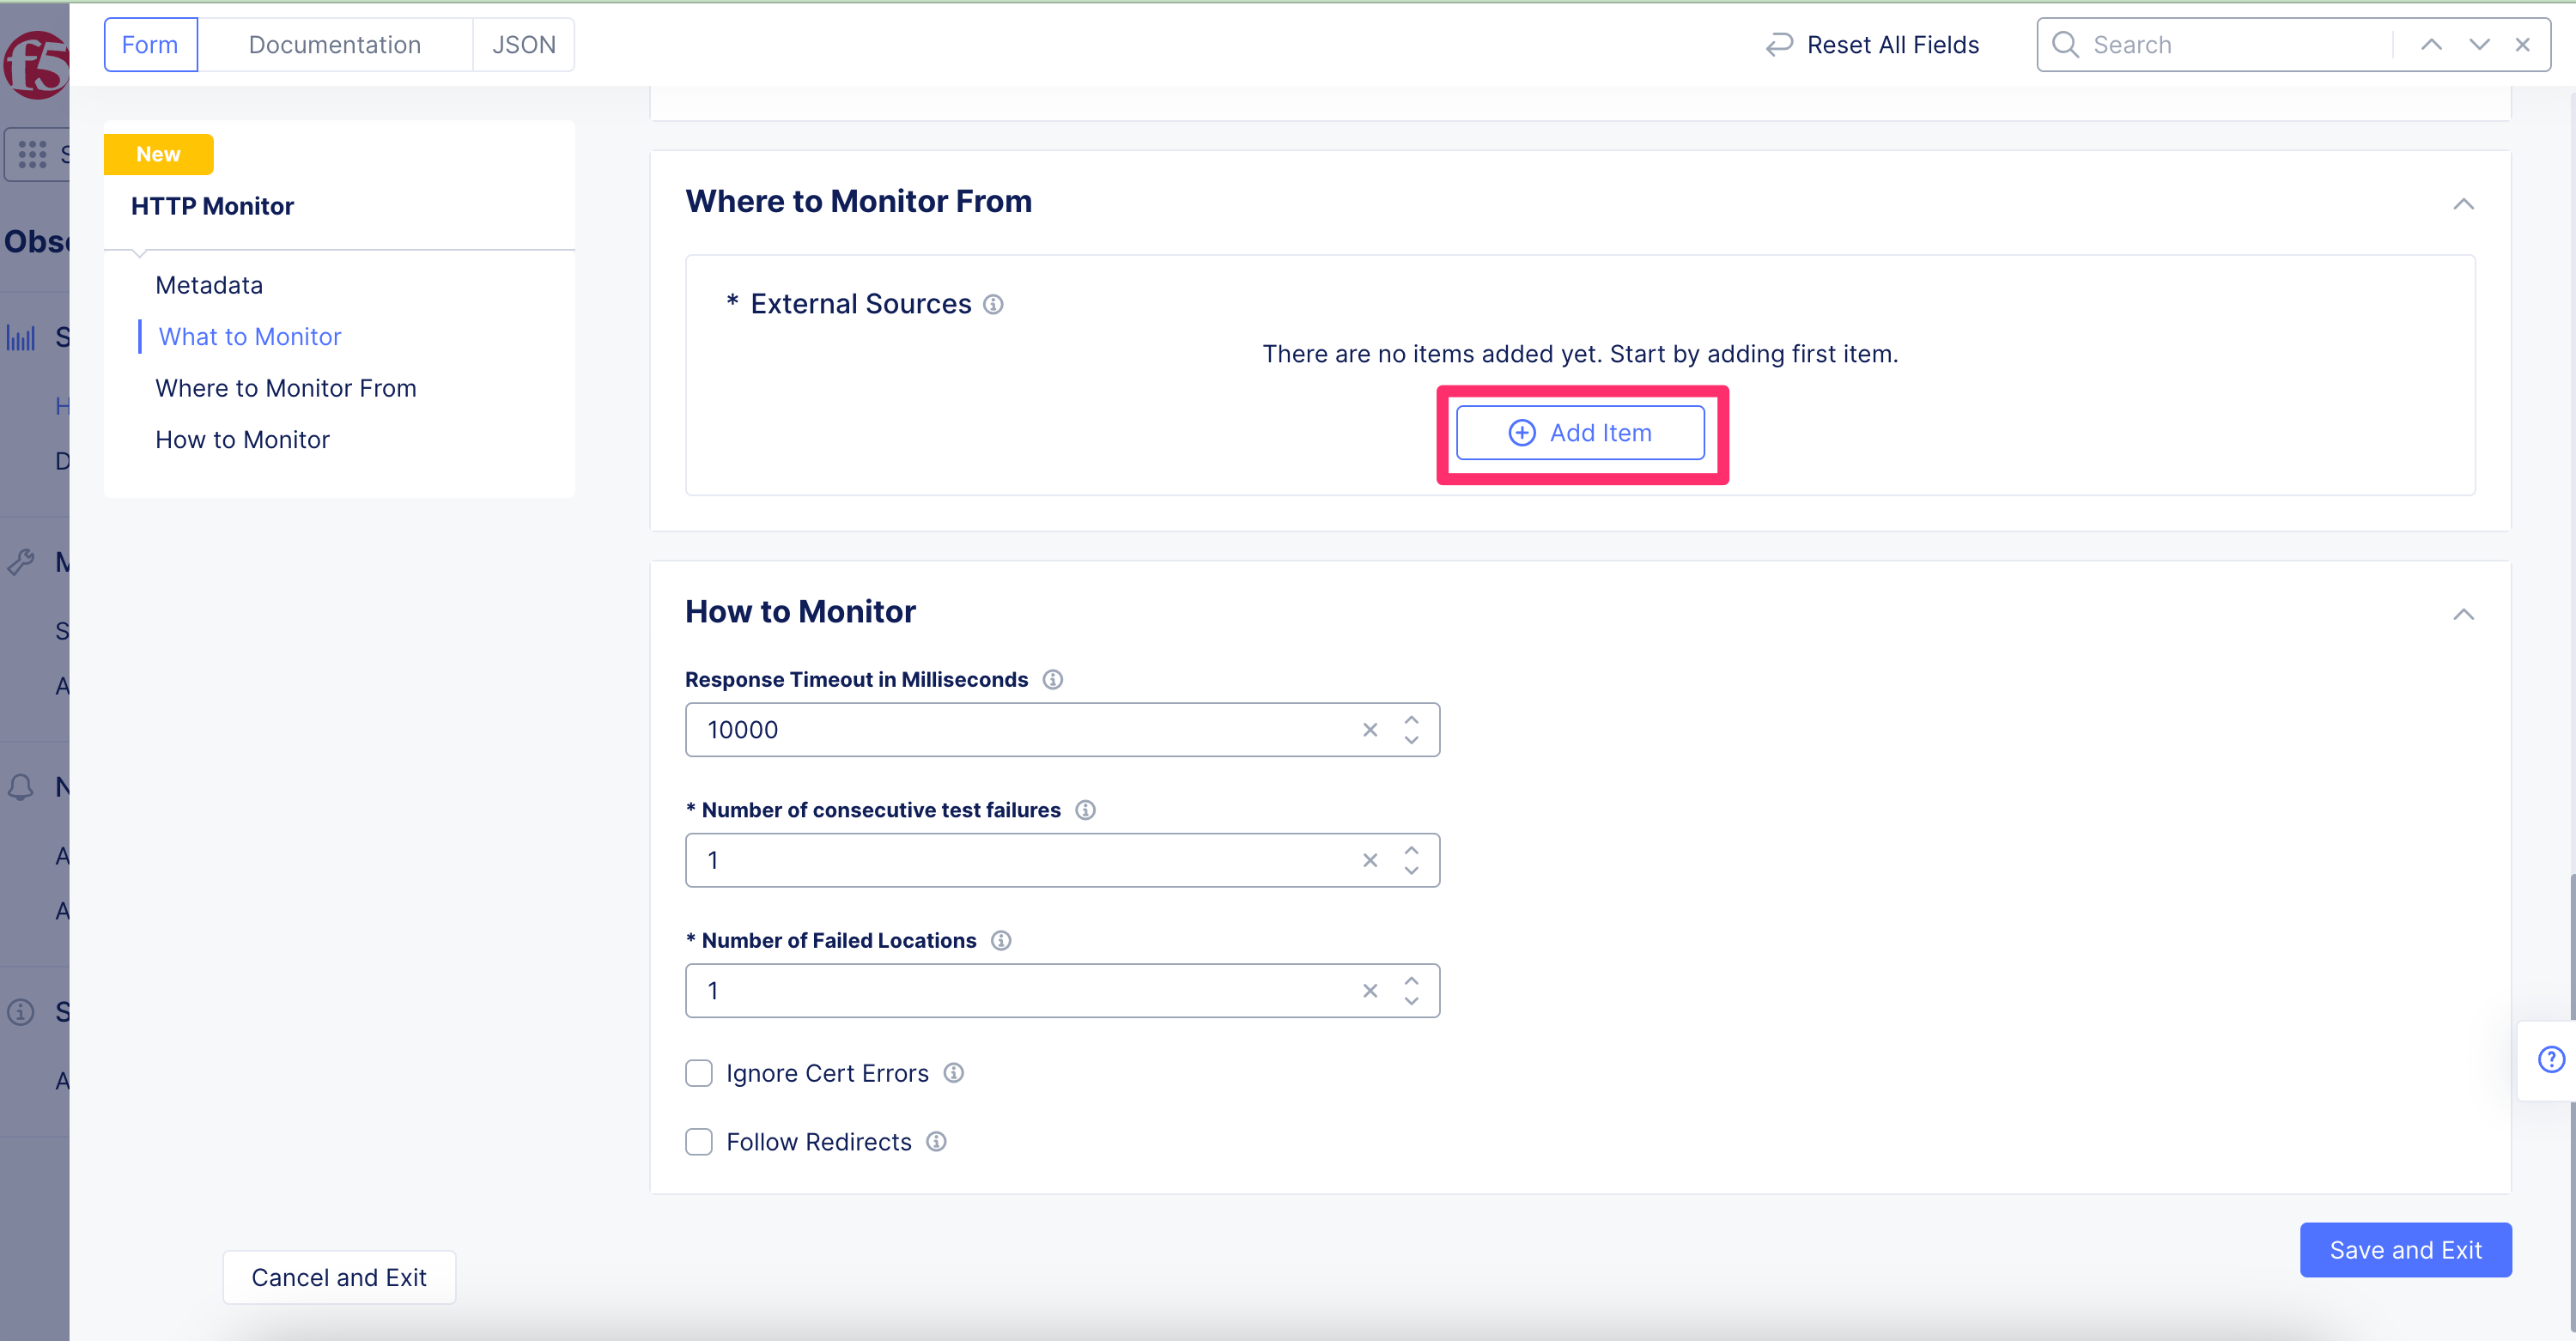
In the Regions field, select “us-east-2” and “us-west-1” and click Apply.
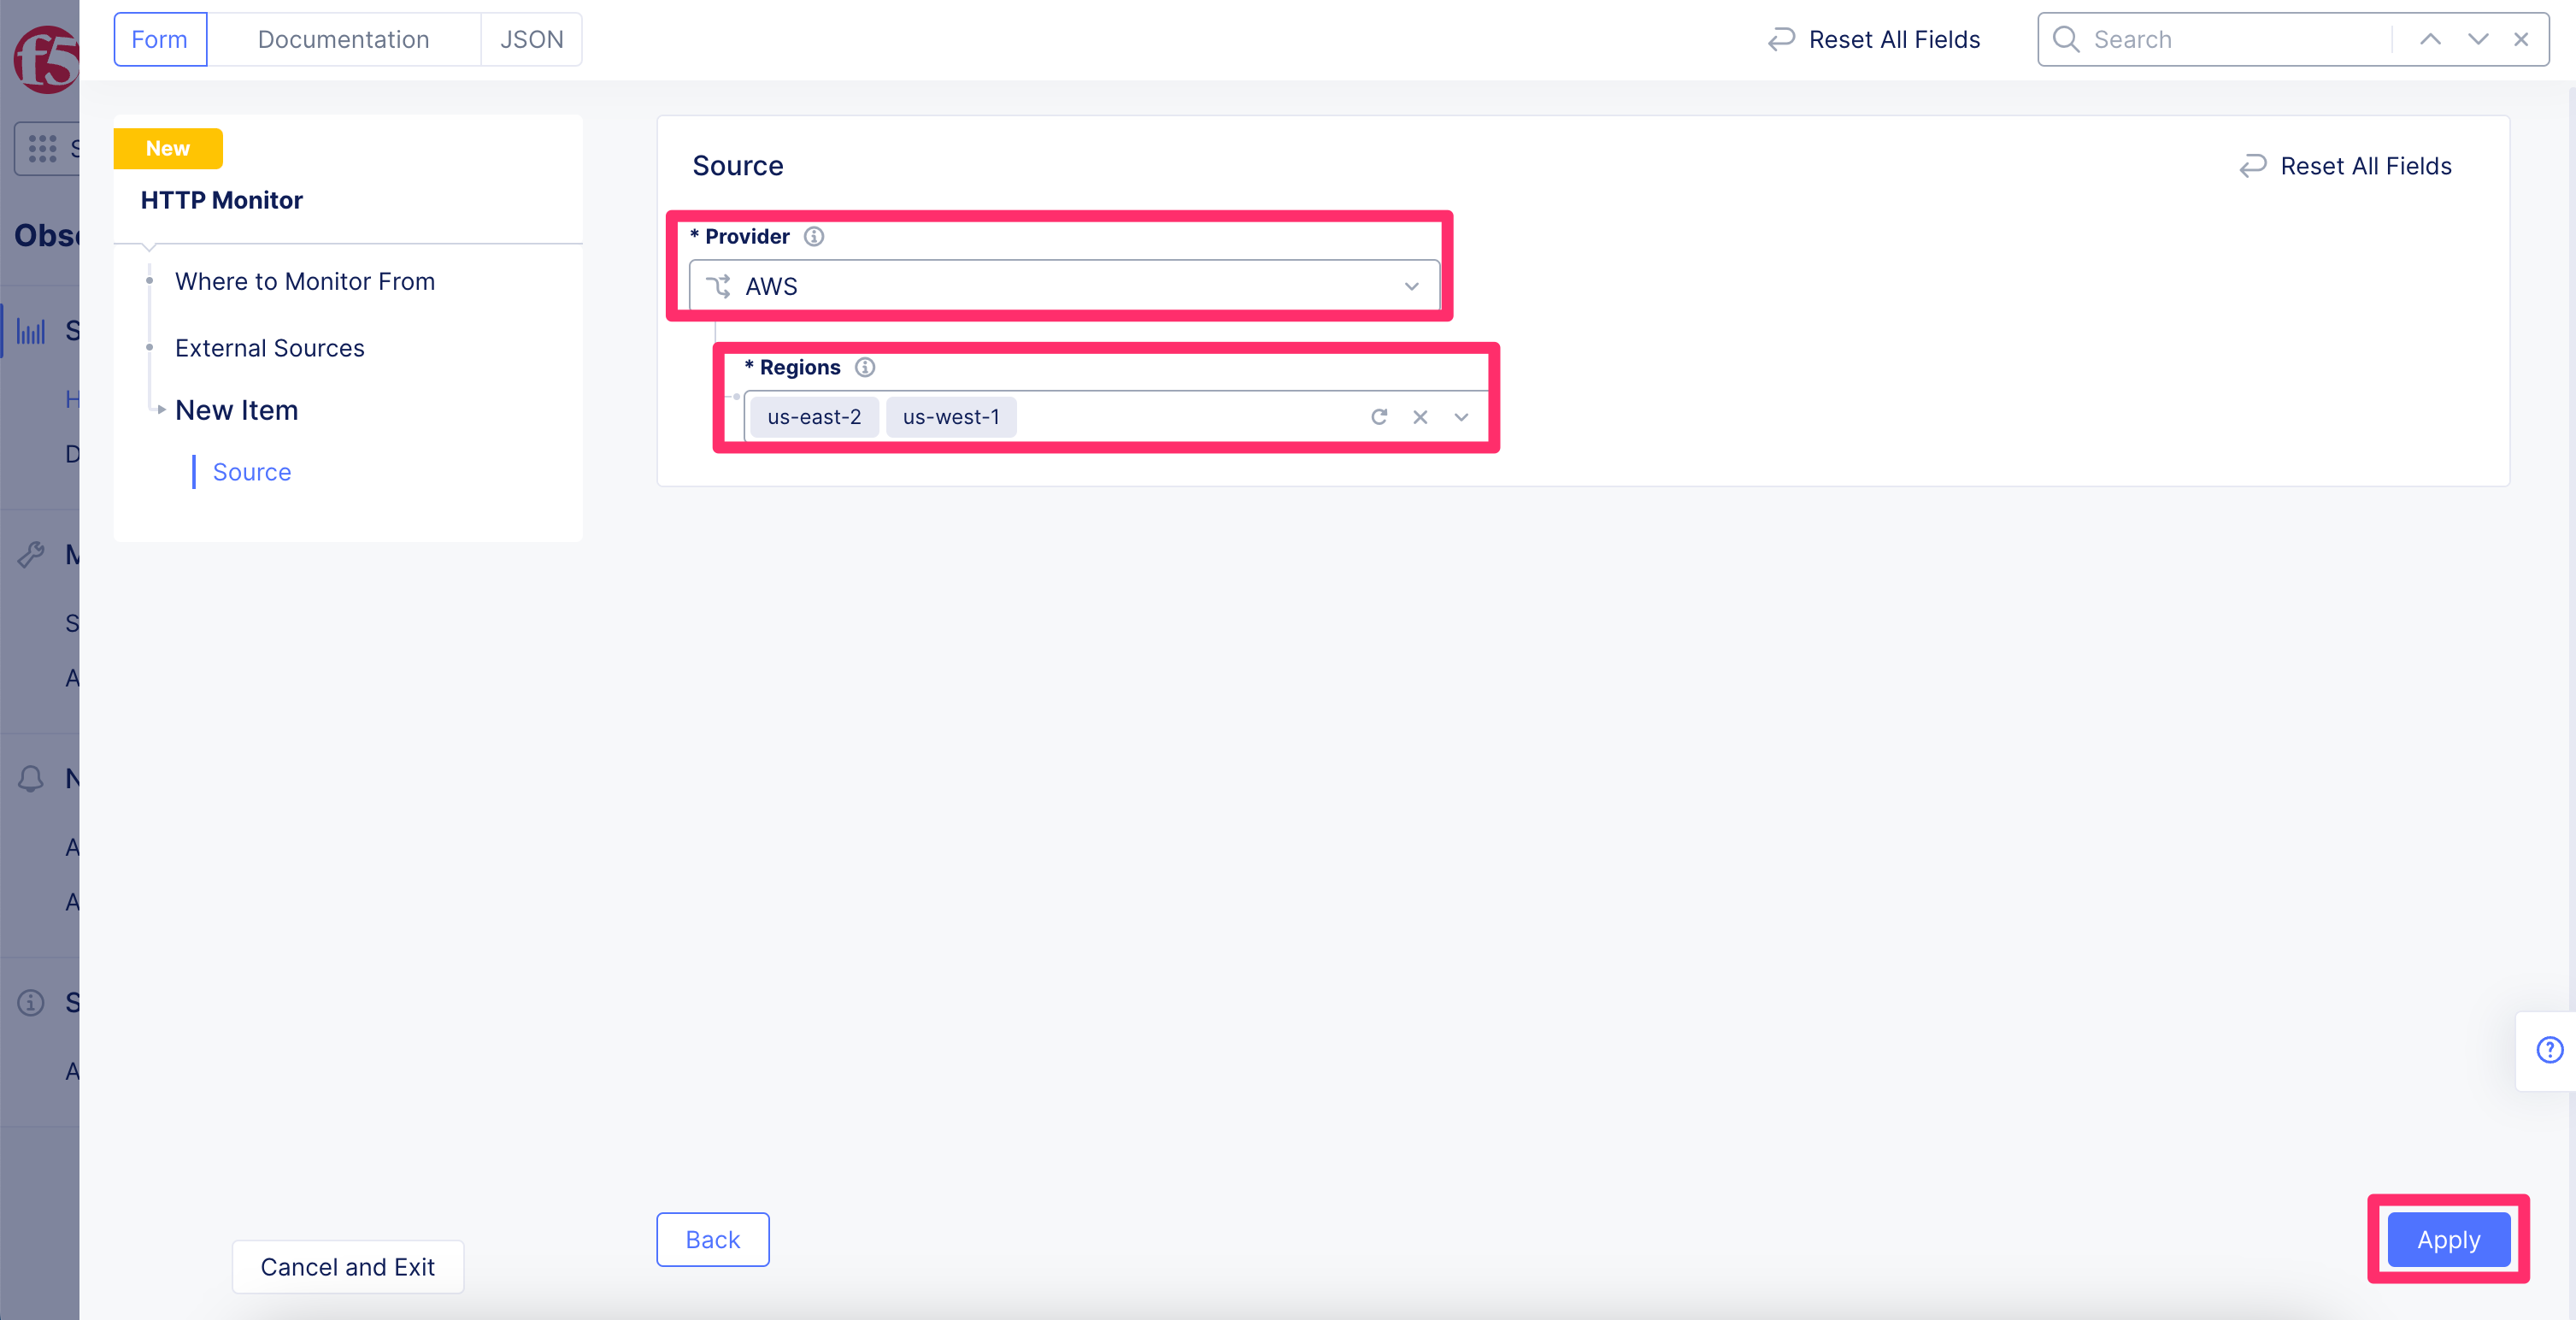
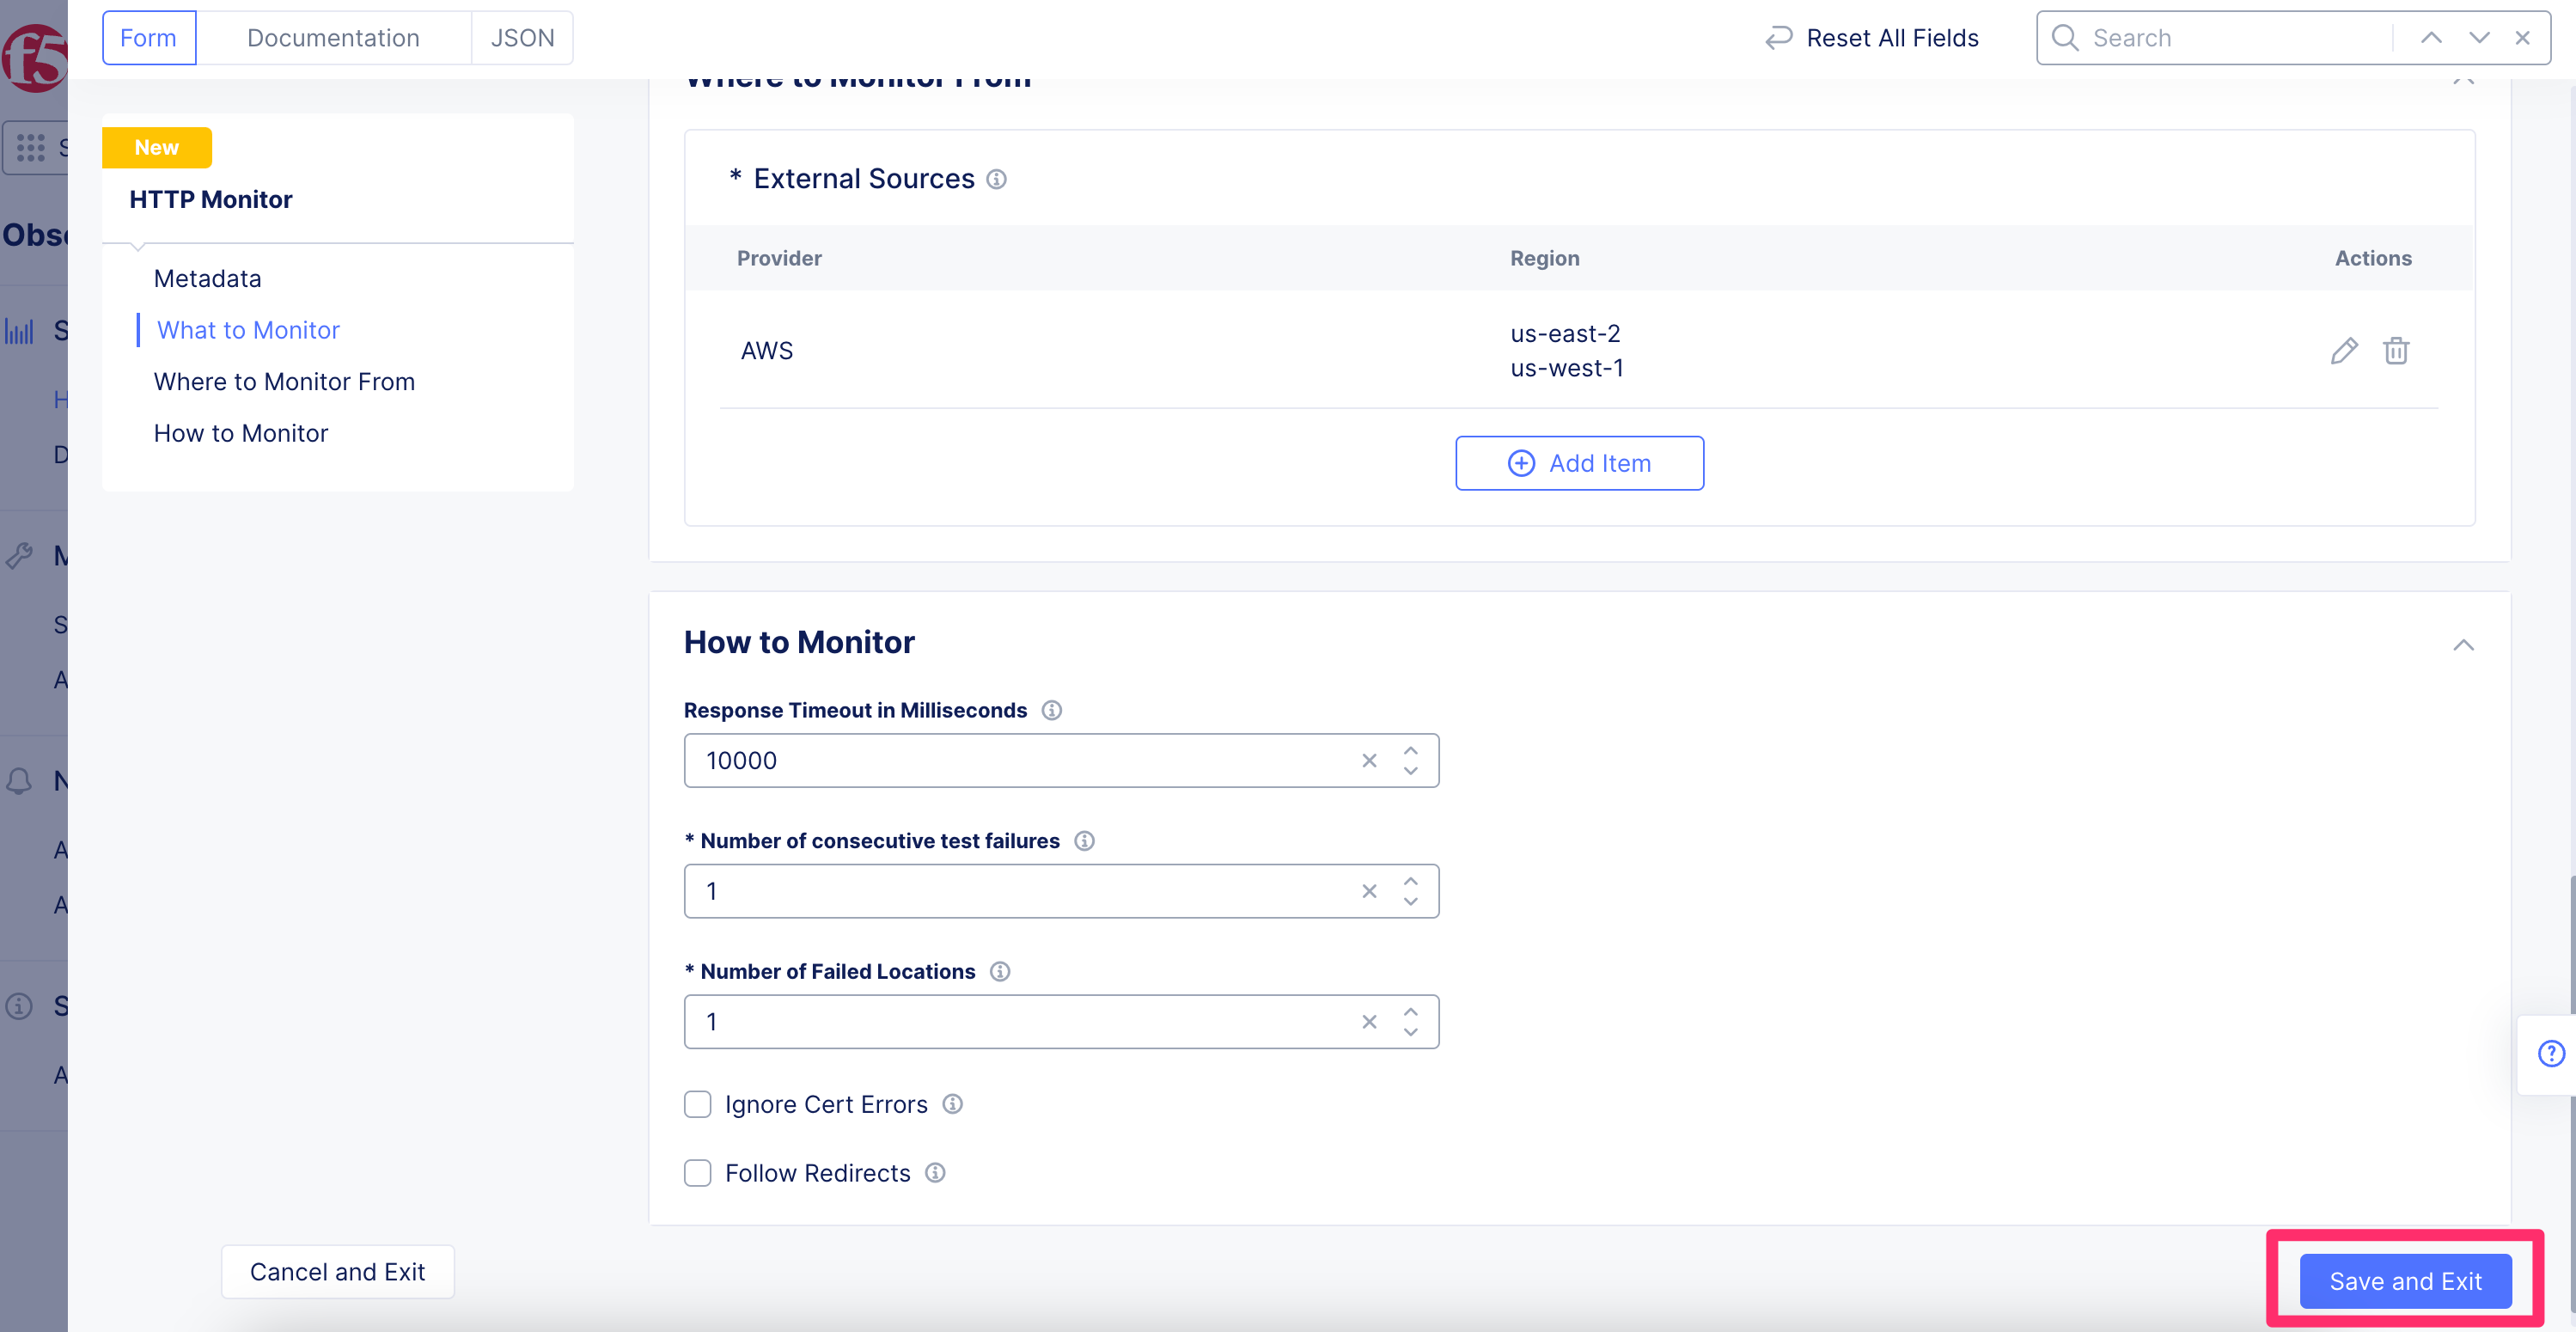
Click the “Save and Exit” button at the bottom right.
Wait 30-60 seconds for the monitors to update.
Task 2: Review the synthetic monitor data
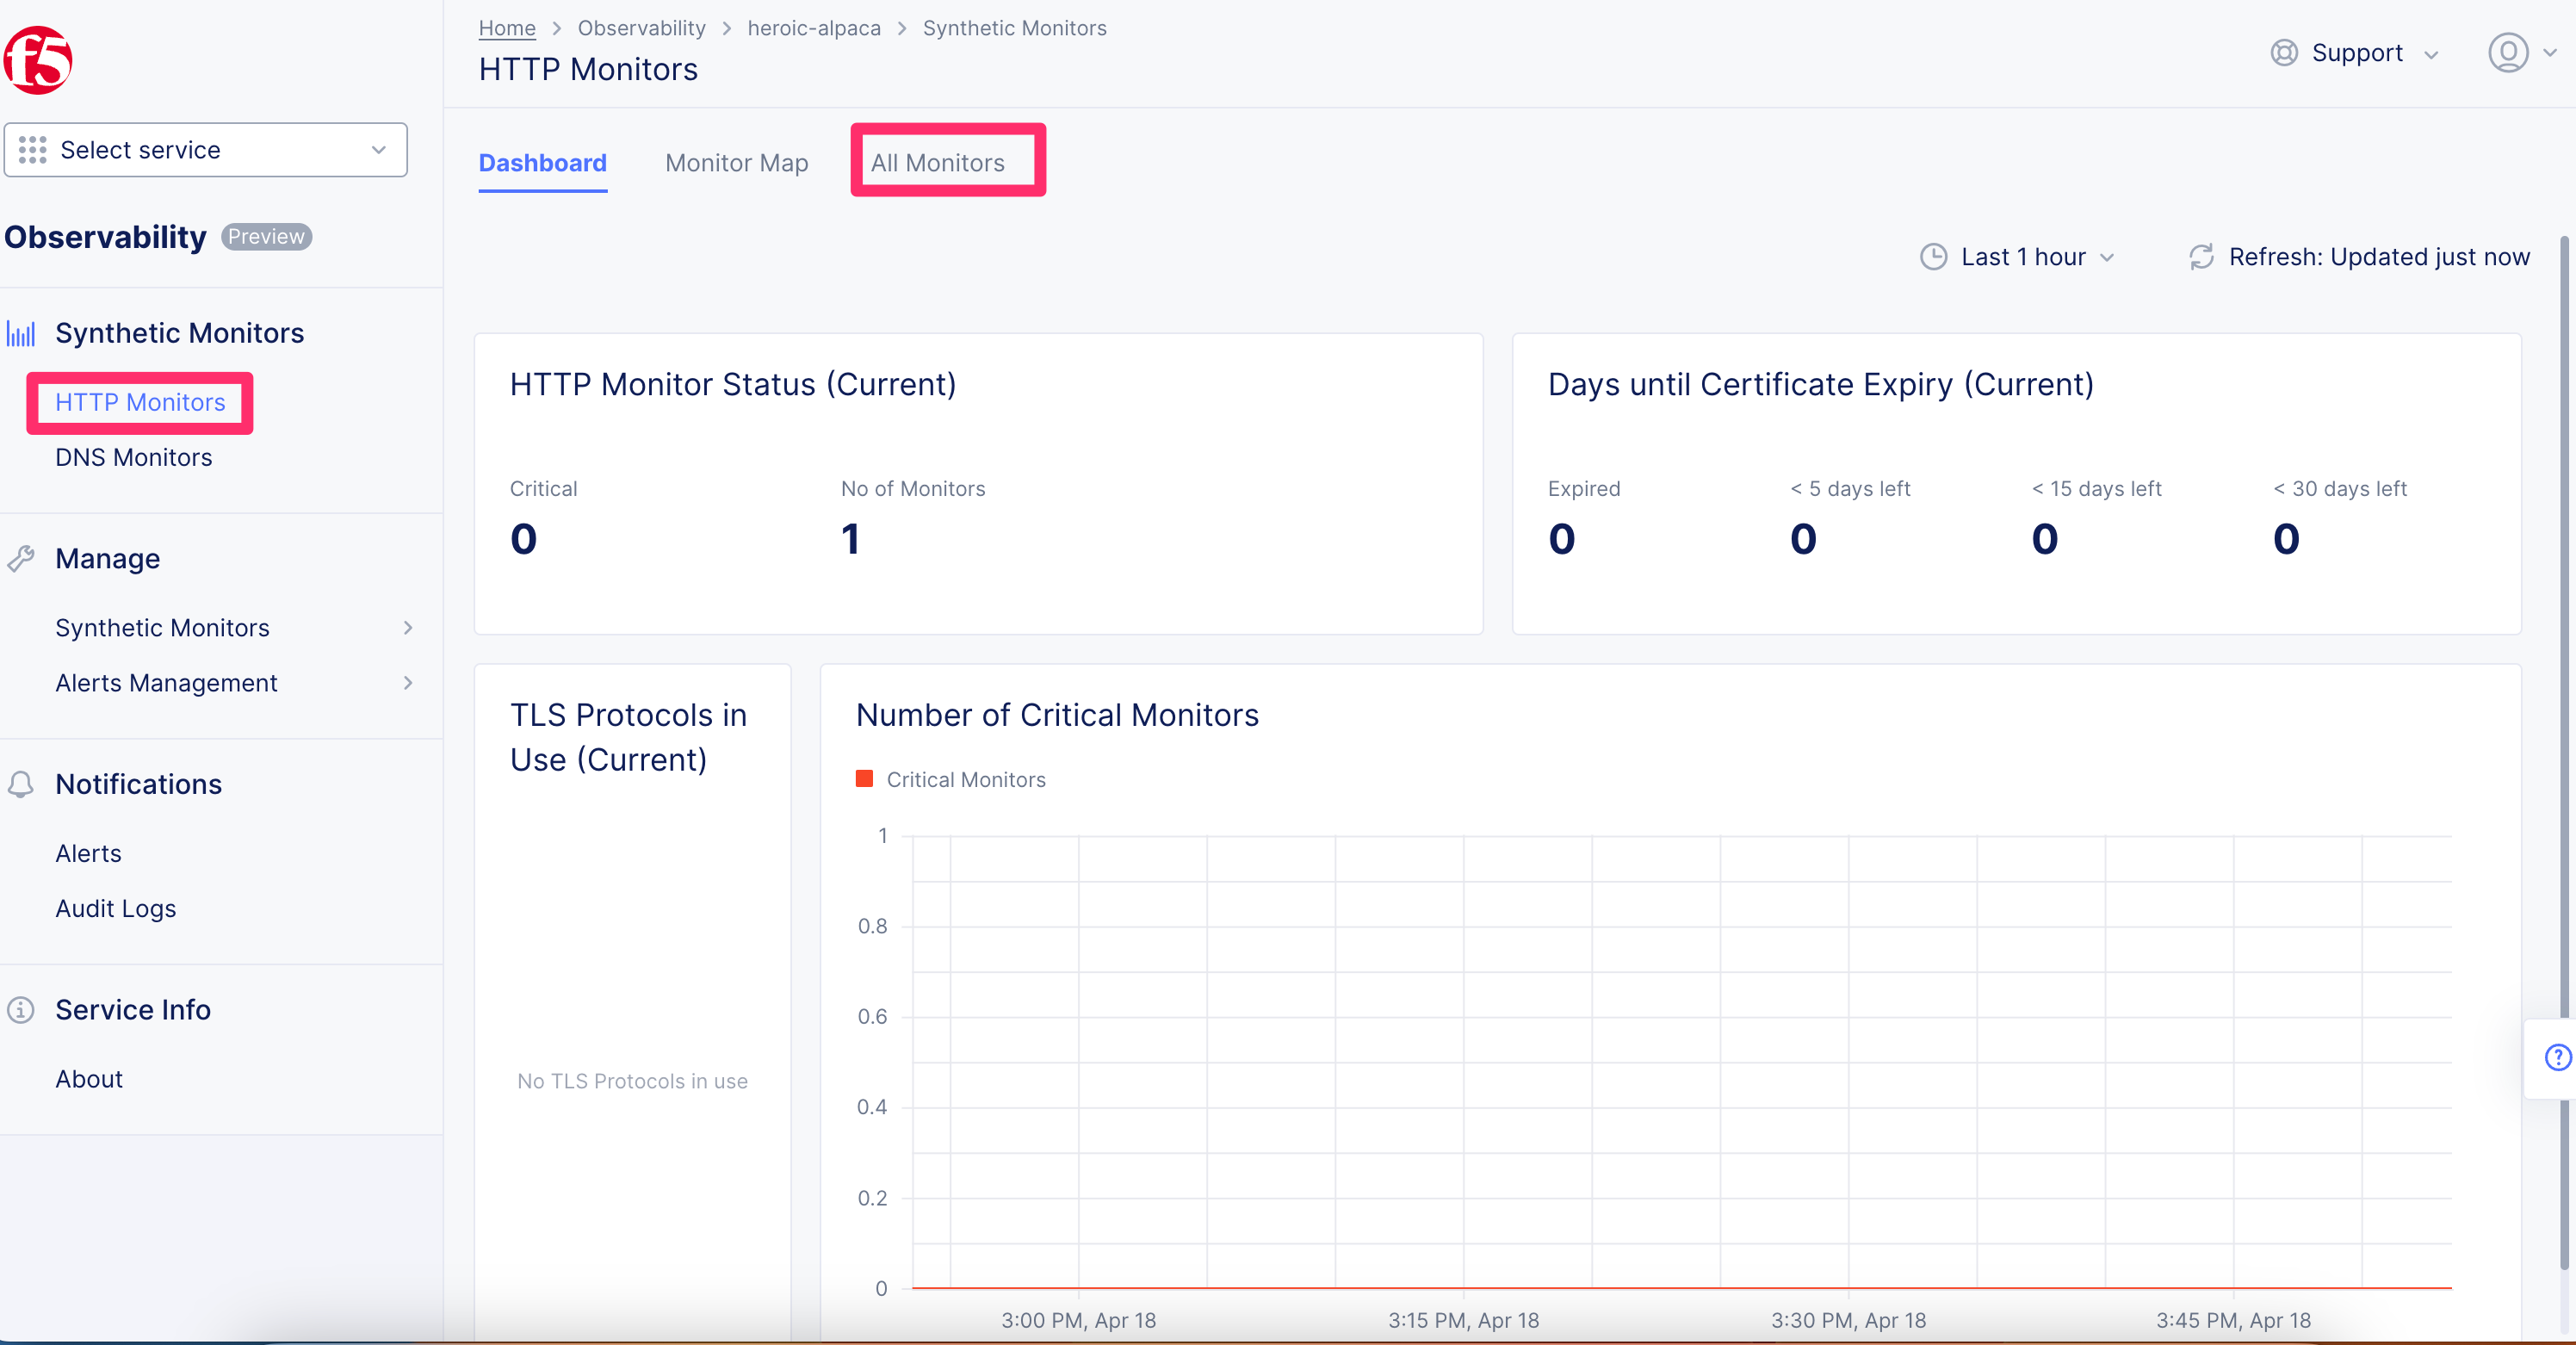
Click on HTTP Monitors in the sidebar.
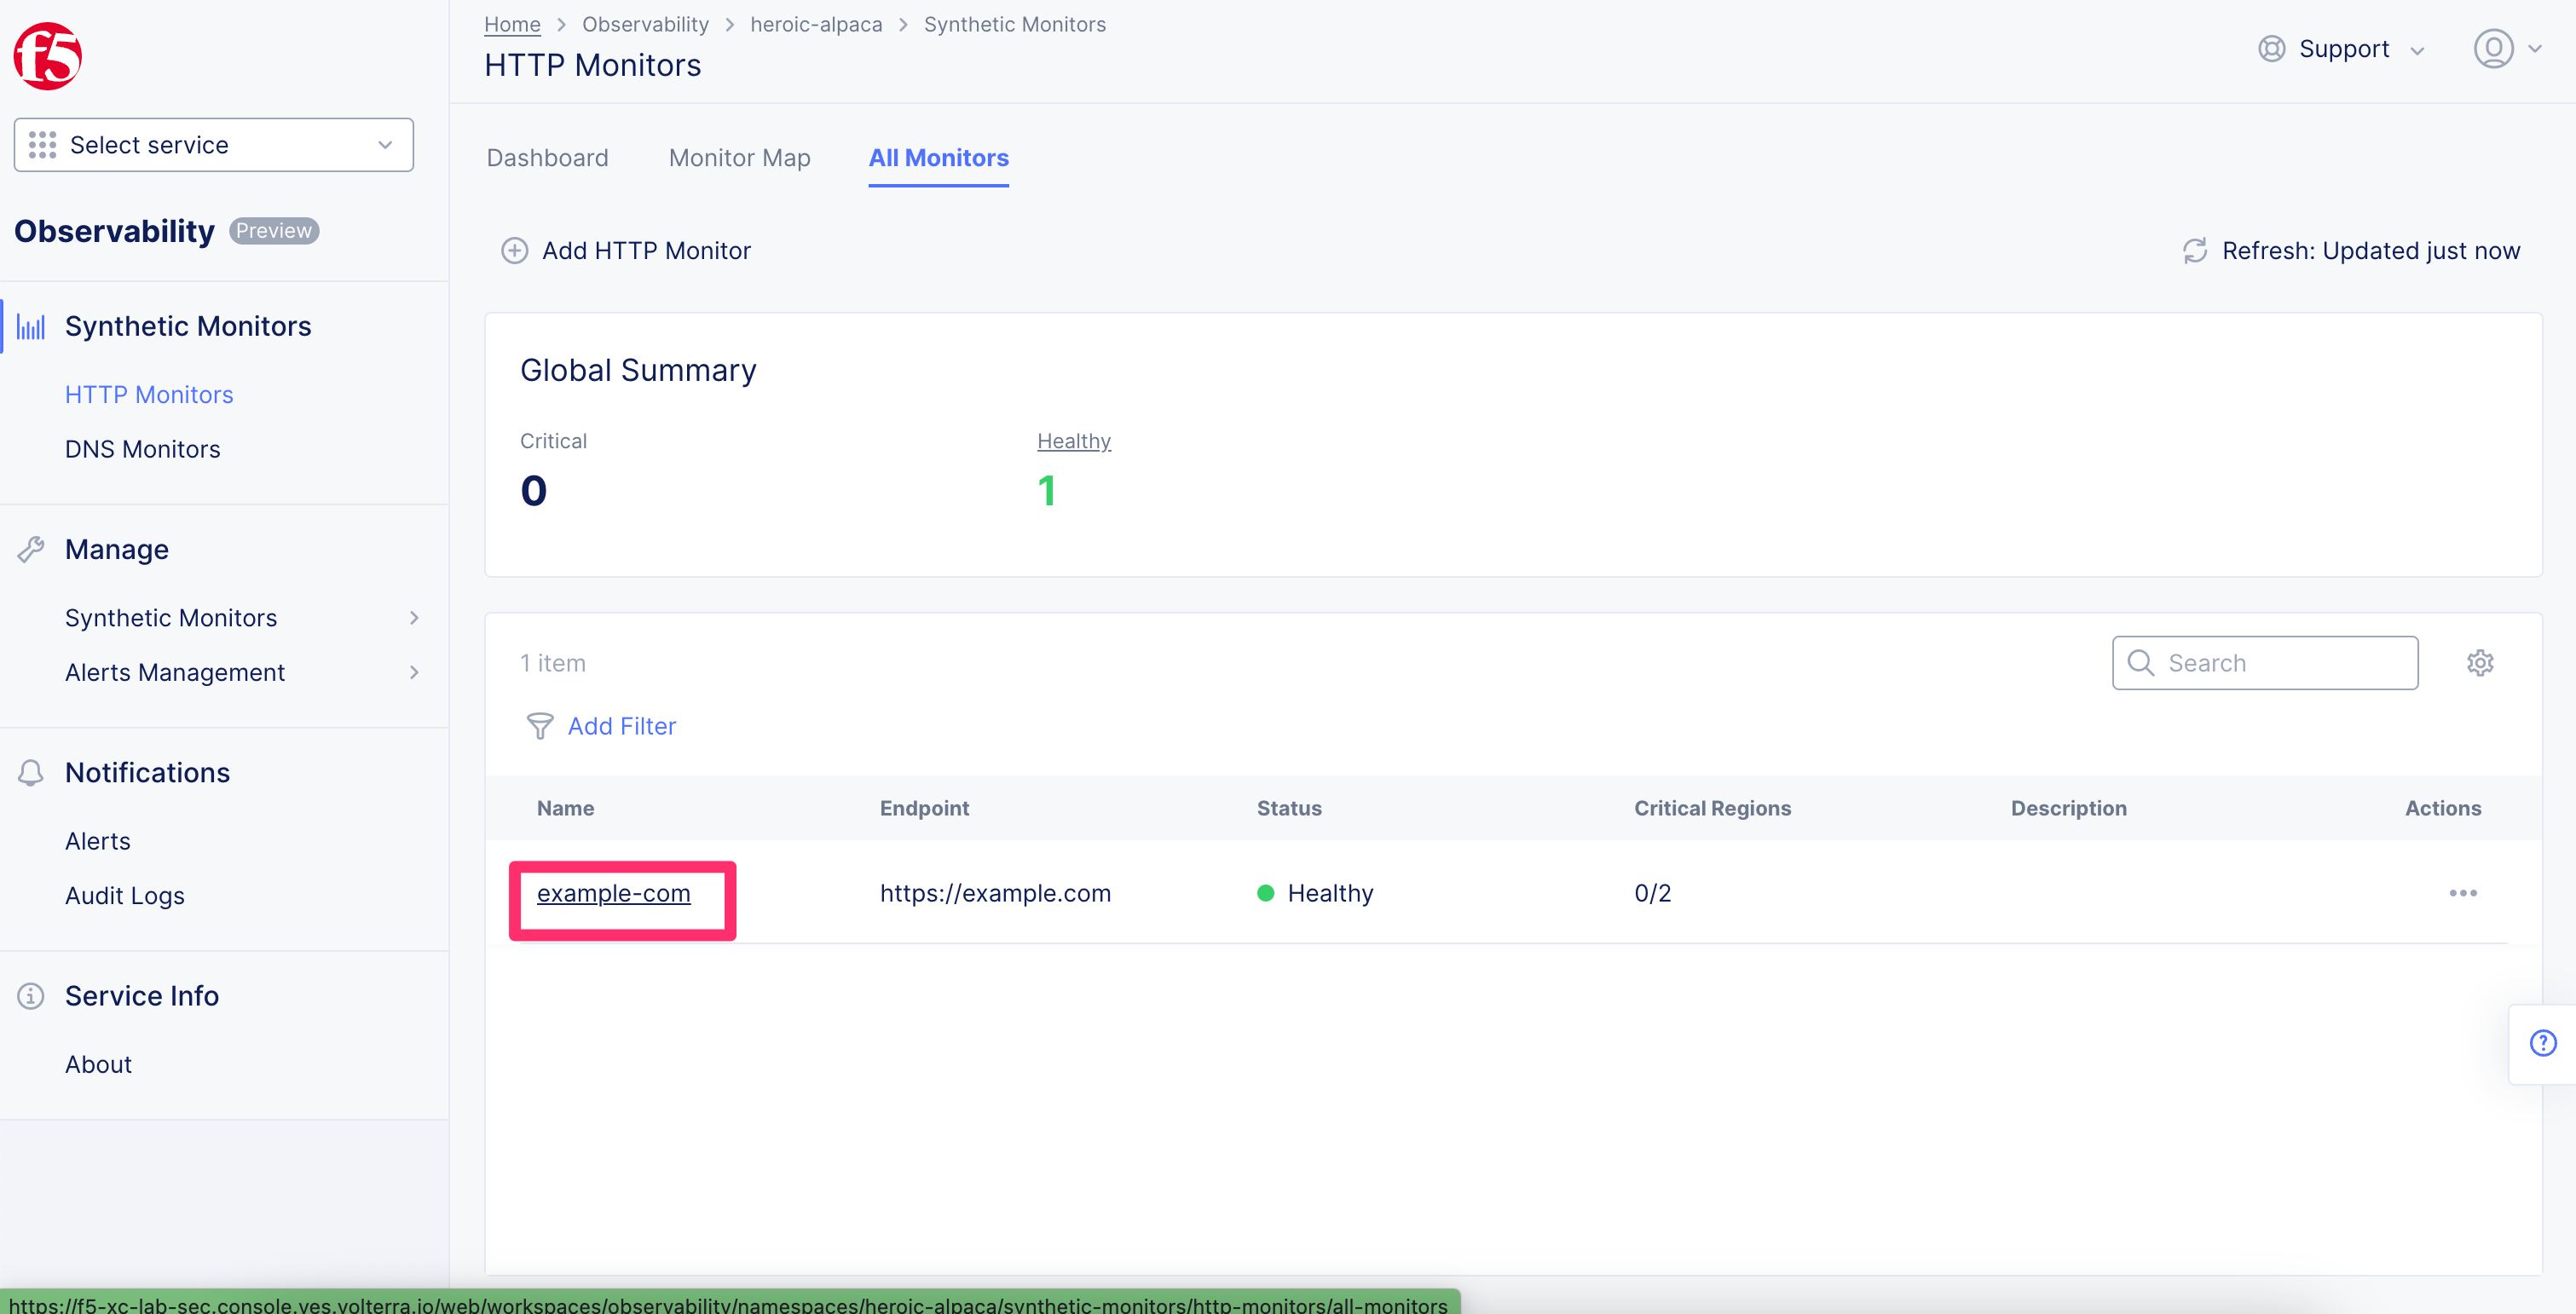
Click the All Monitors tab near the top of the screen.
Click the “example-com” monitor name that you created previously.
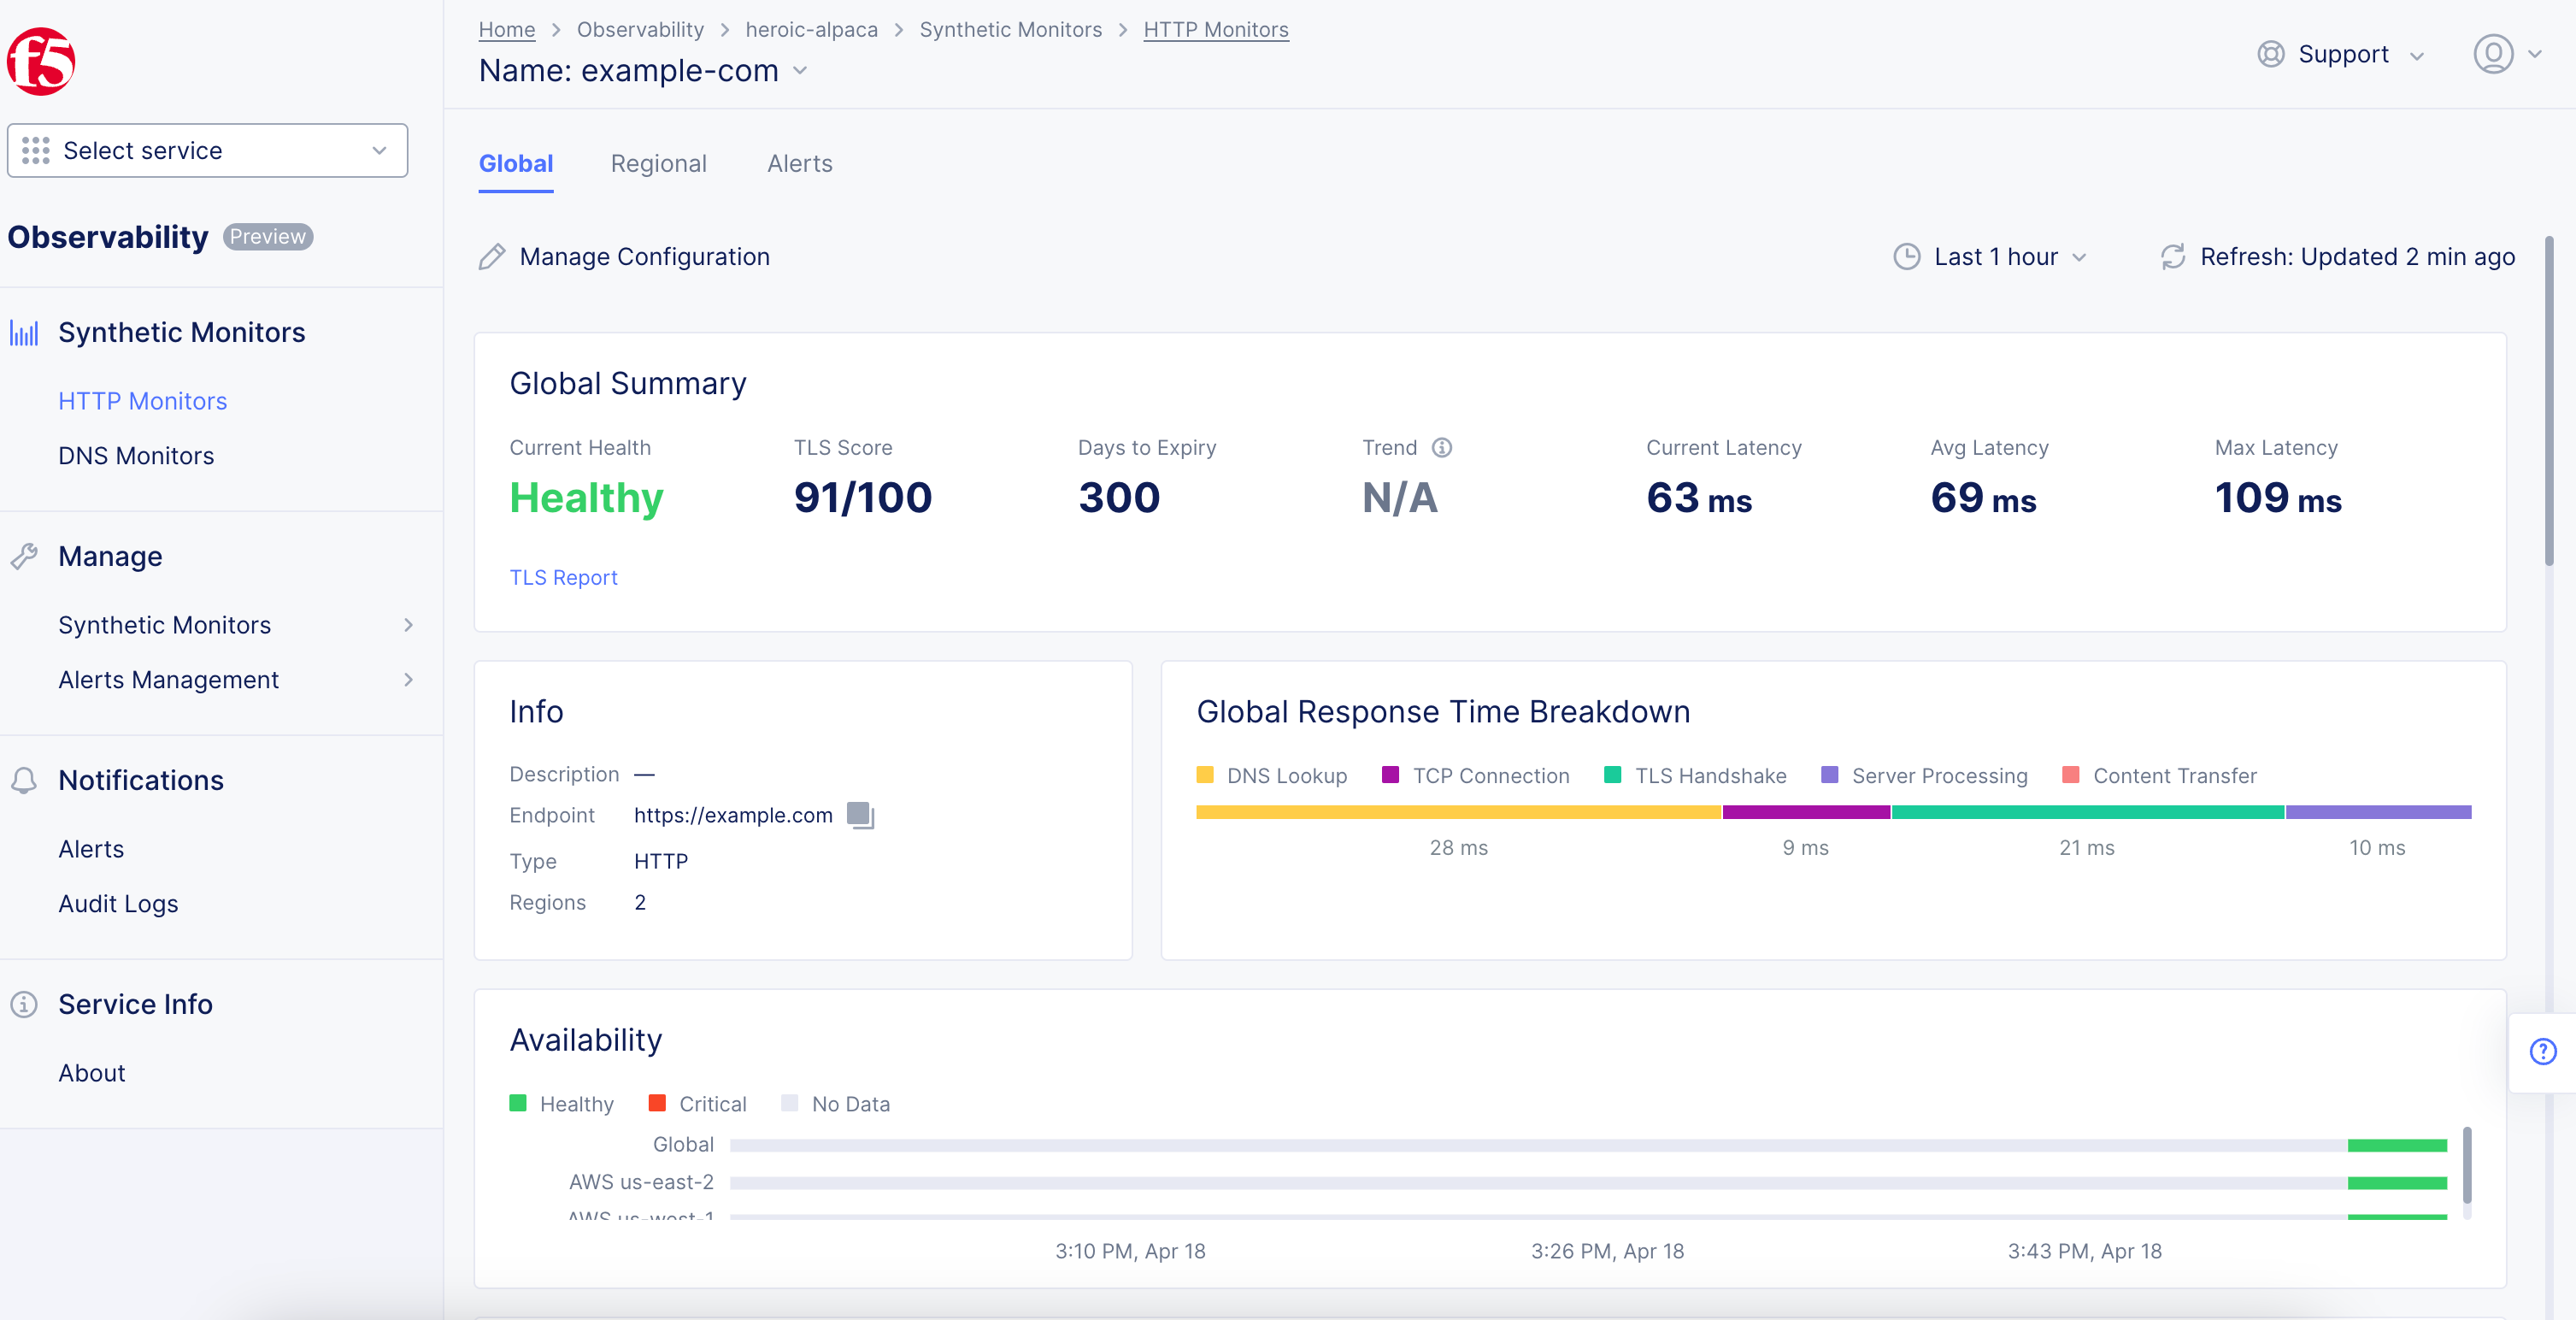
4. Please take a few minutes to review the information in the report, including: days until certificate expiration, latency, global response time breakdown, and response time by region (source).
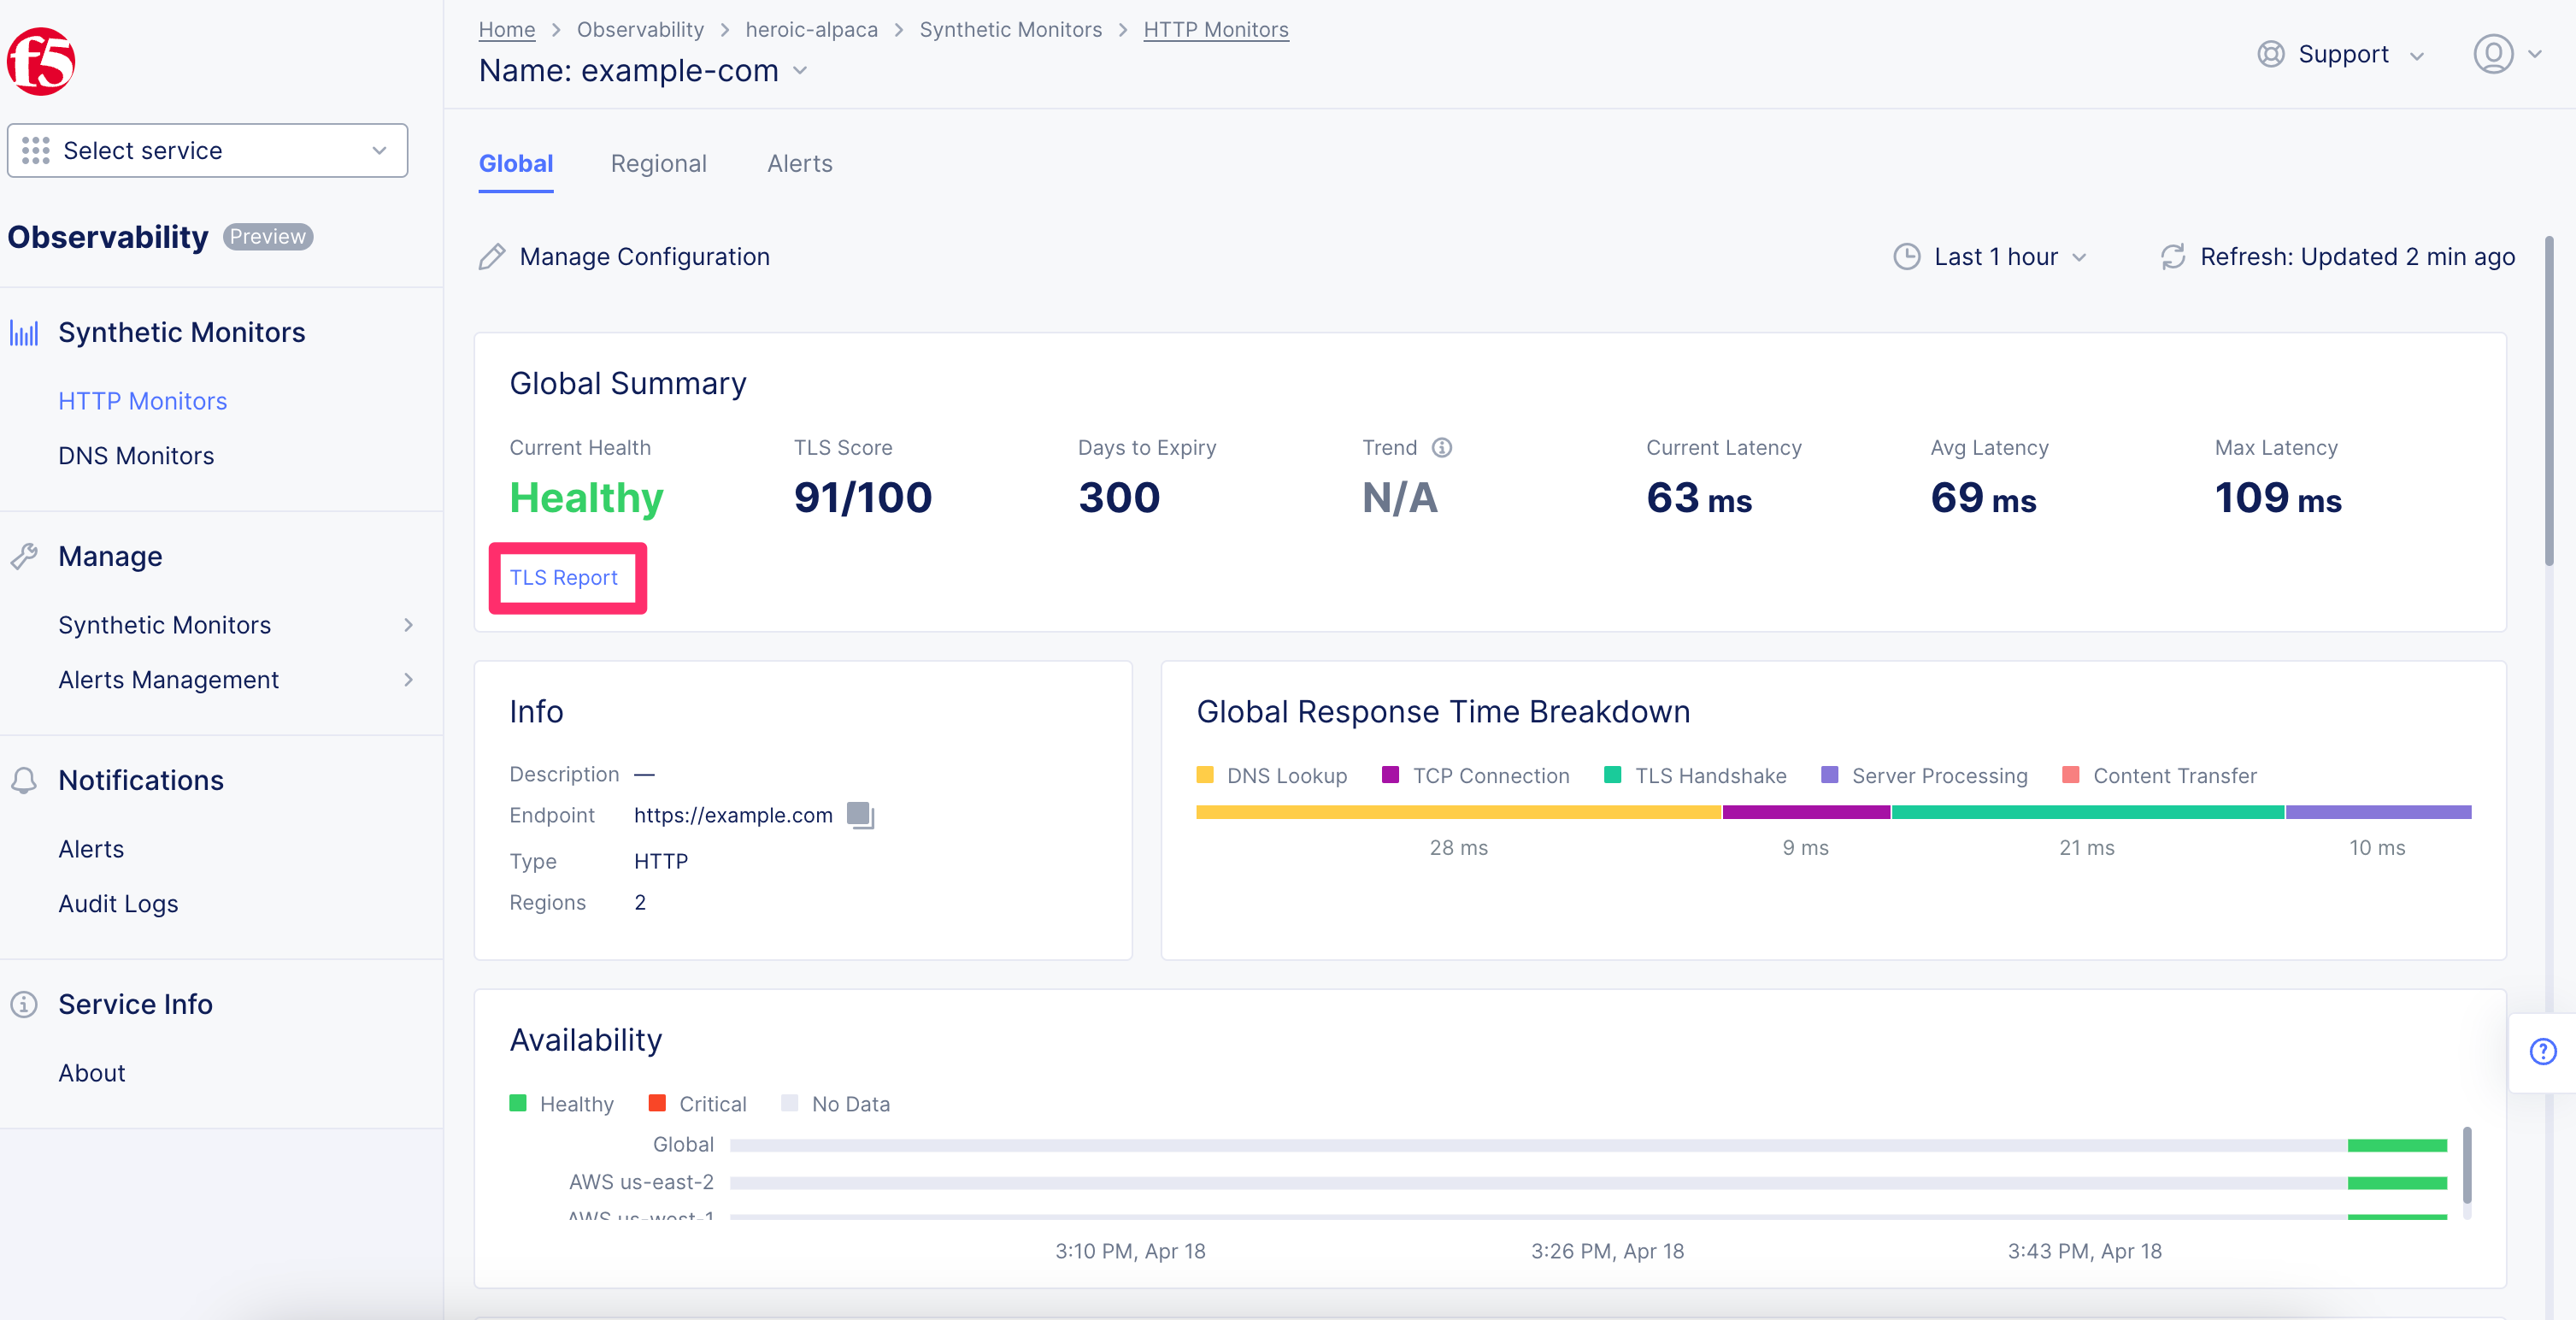
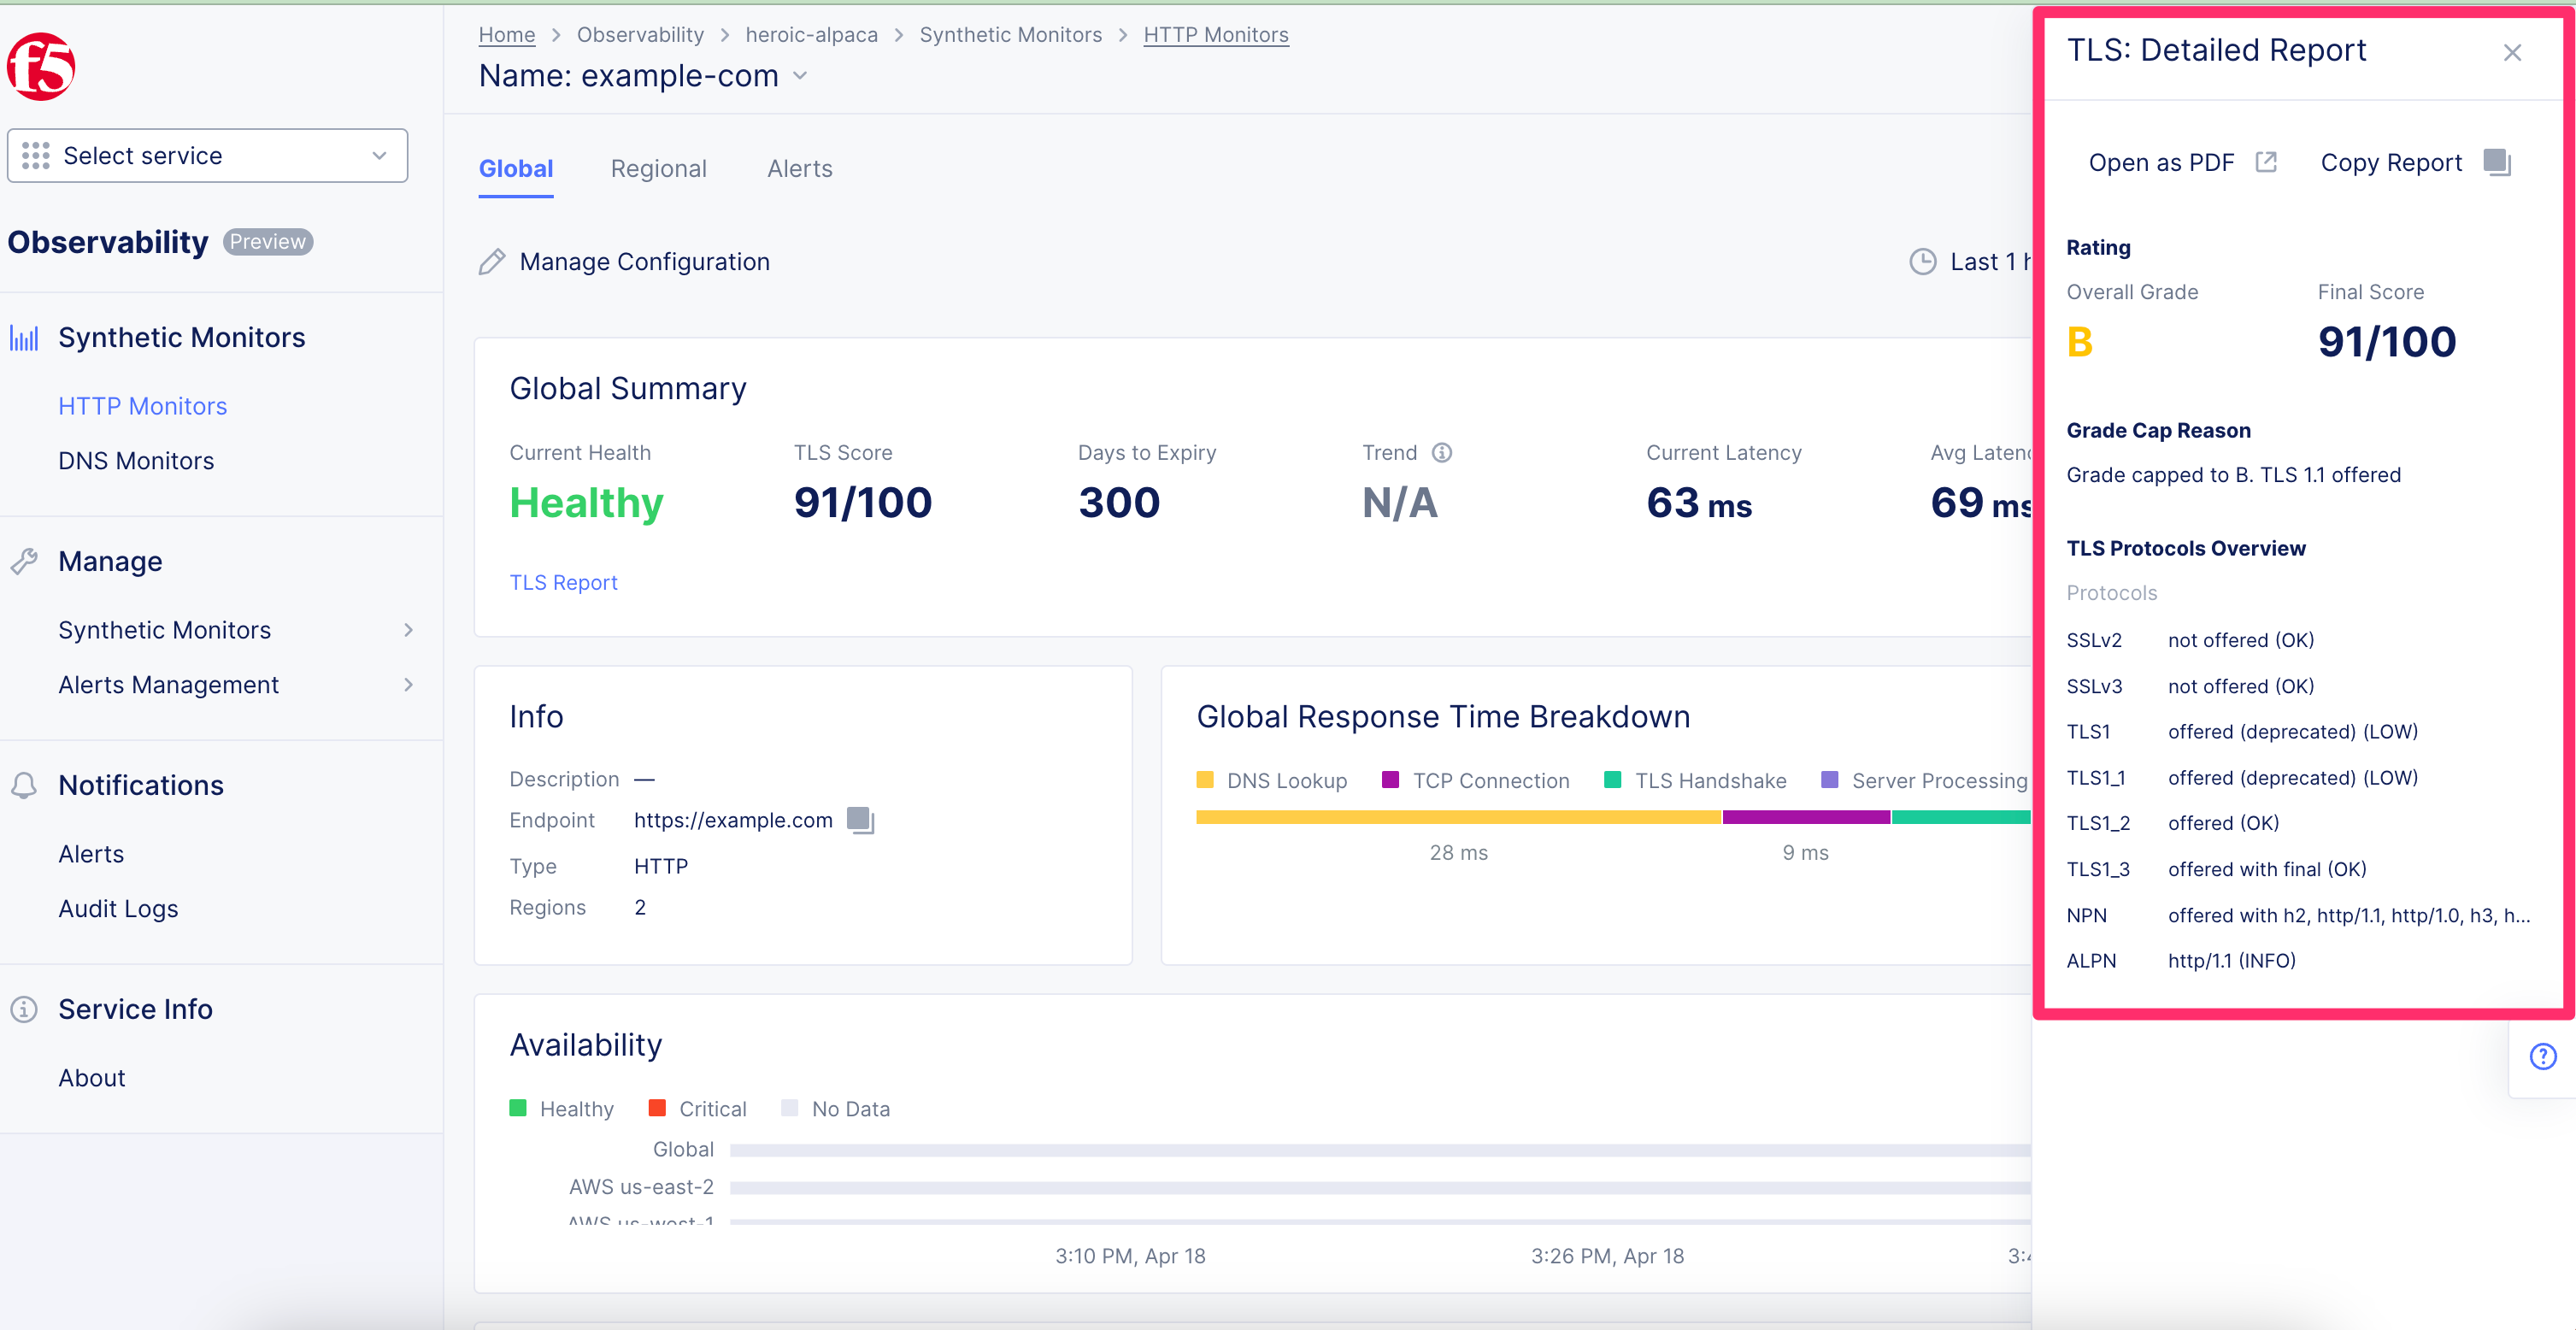
5. Click the “TLS Report” link and review the TLS detailed report. Press the X to close the report and return to the synthetic monitor statistics.
6. Note that you can configure alerts to be sent to you when monitor thresholds are exceeded, however alerts are out of scope for this lab.