NGINX Modern Apps > Class 5 - NGINX App Protect WAF & DoS > Module 1 - Test Driving NGINX Plus with App Protect WAF and NGINX Instance Manager Source | Edit on
View the NGINX Plus Instance in NIM
- Navigate to Applications on the menu bar and launch Firefox.
Caution
It may take several seconds for Firefox to launch the first time.
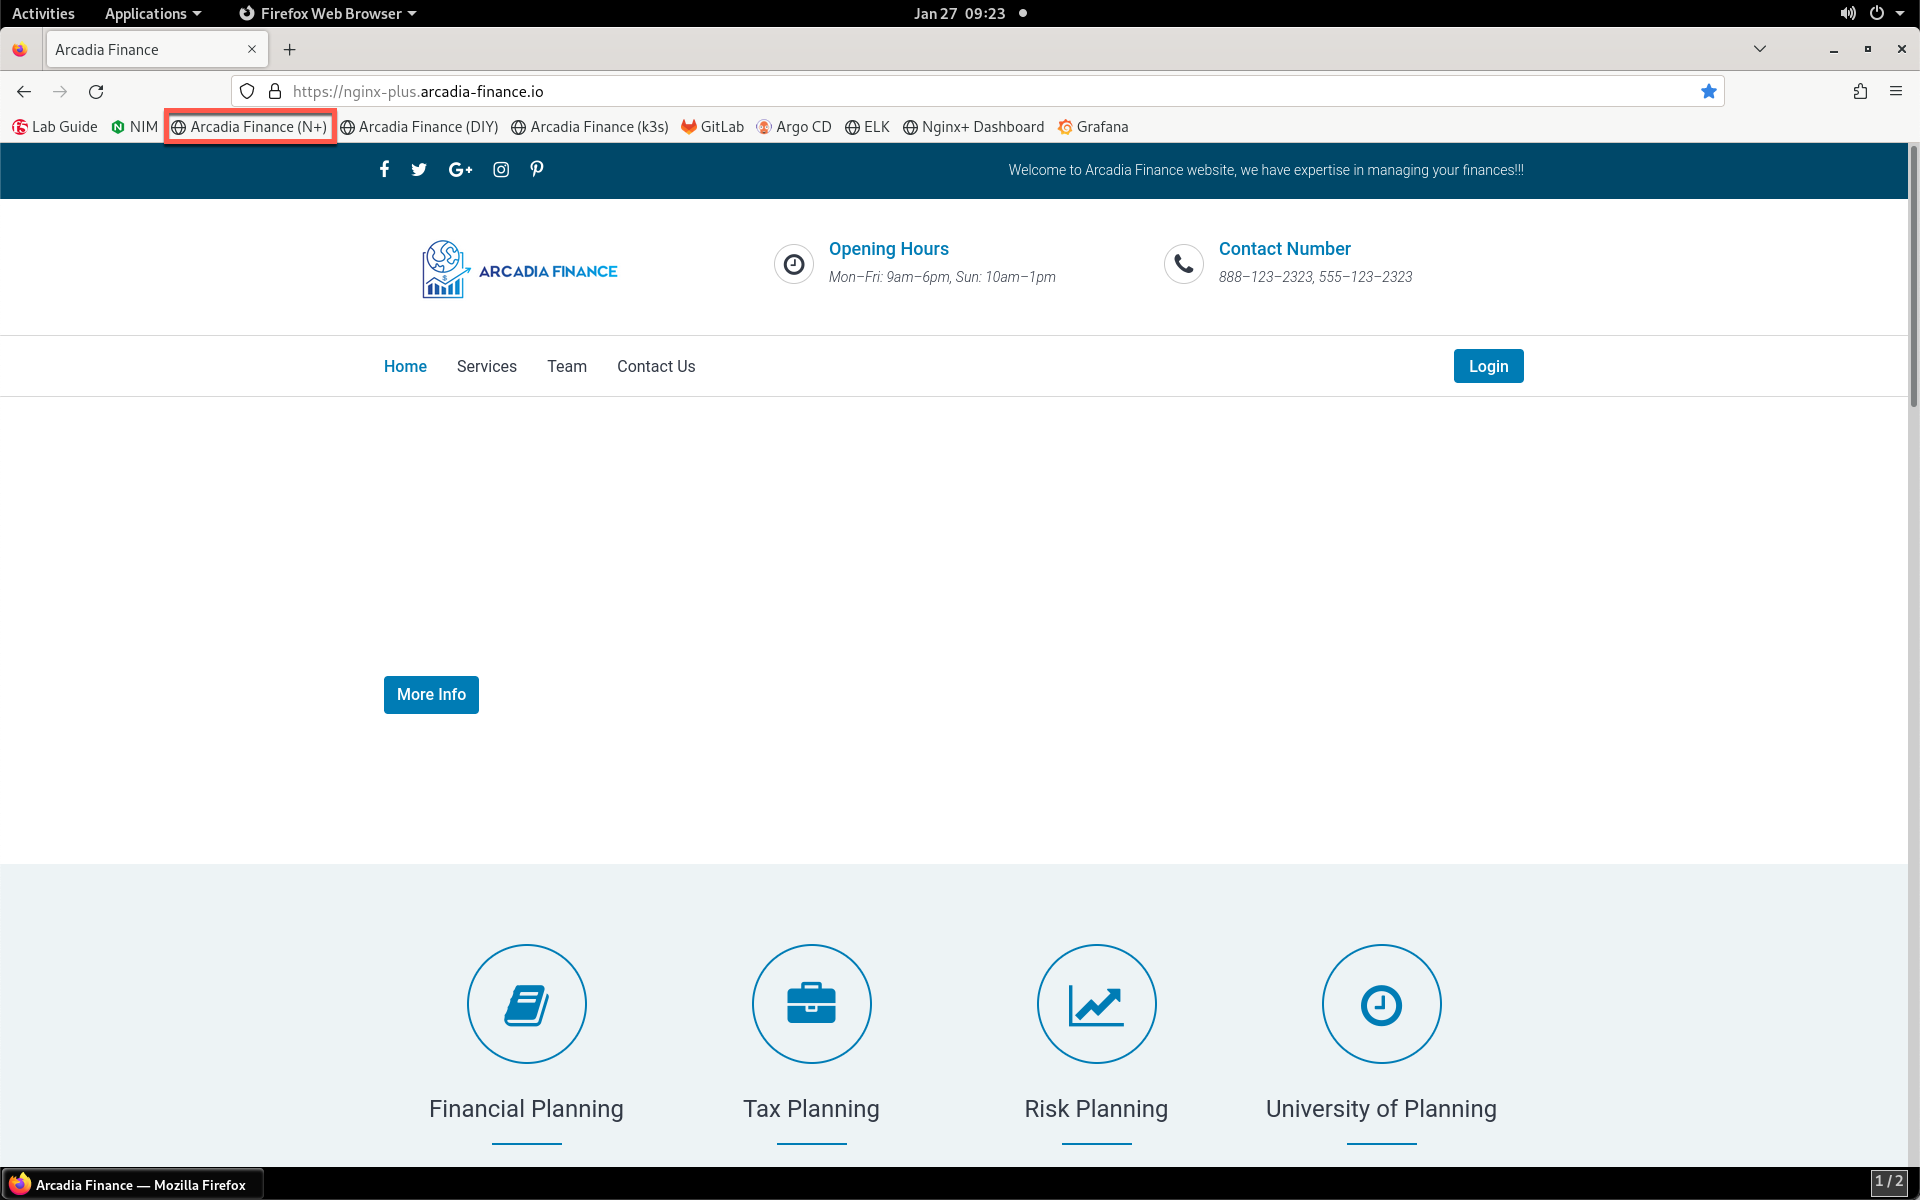
- In Firefox, click on the Arcadia Finance (N+) bookmark or navigate to https://nginx-plus.arcadia-finance.io/. You should see the application page load as shown below.
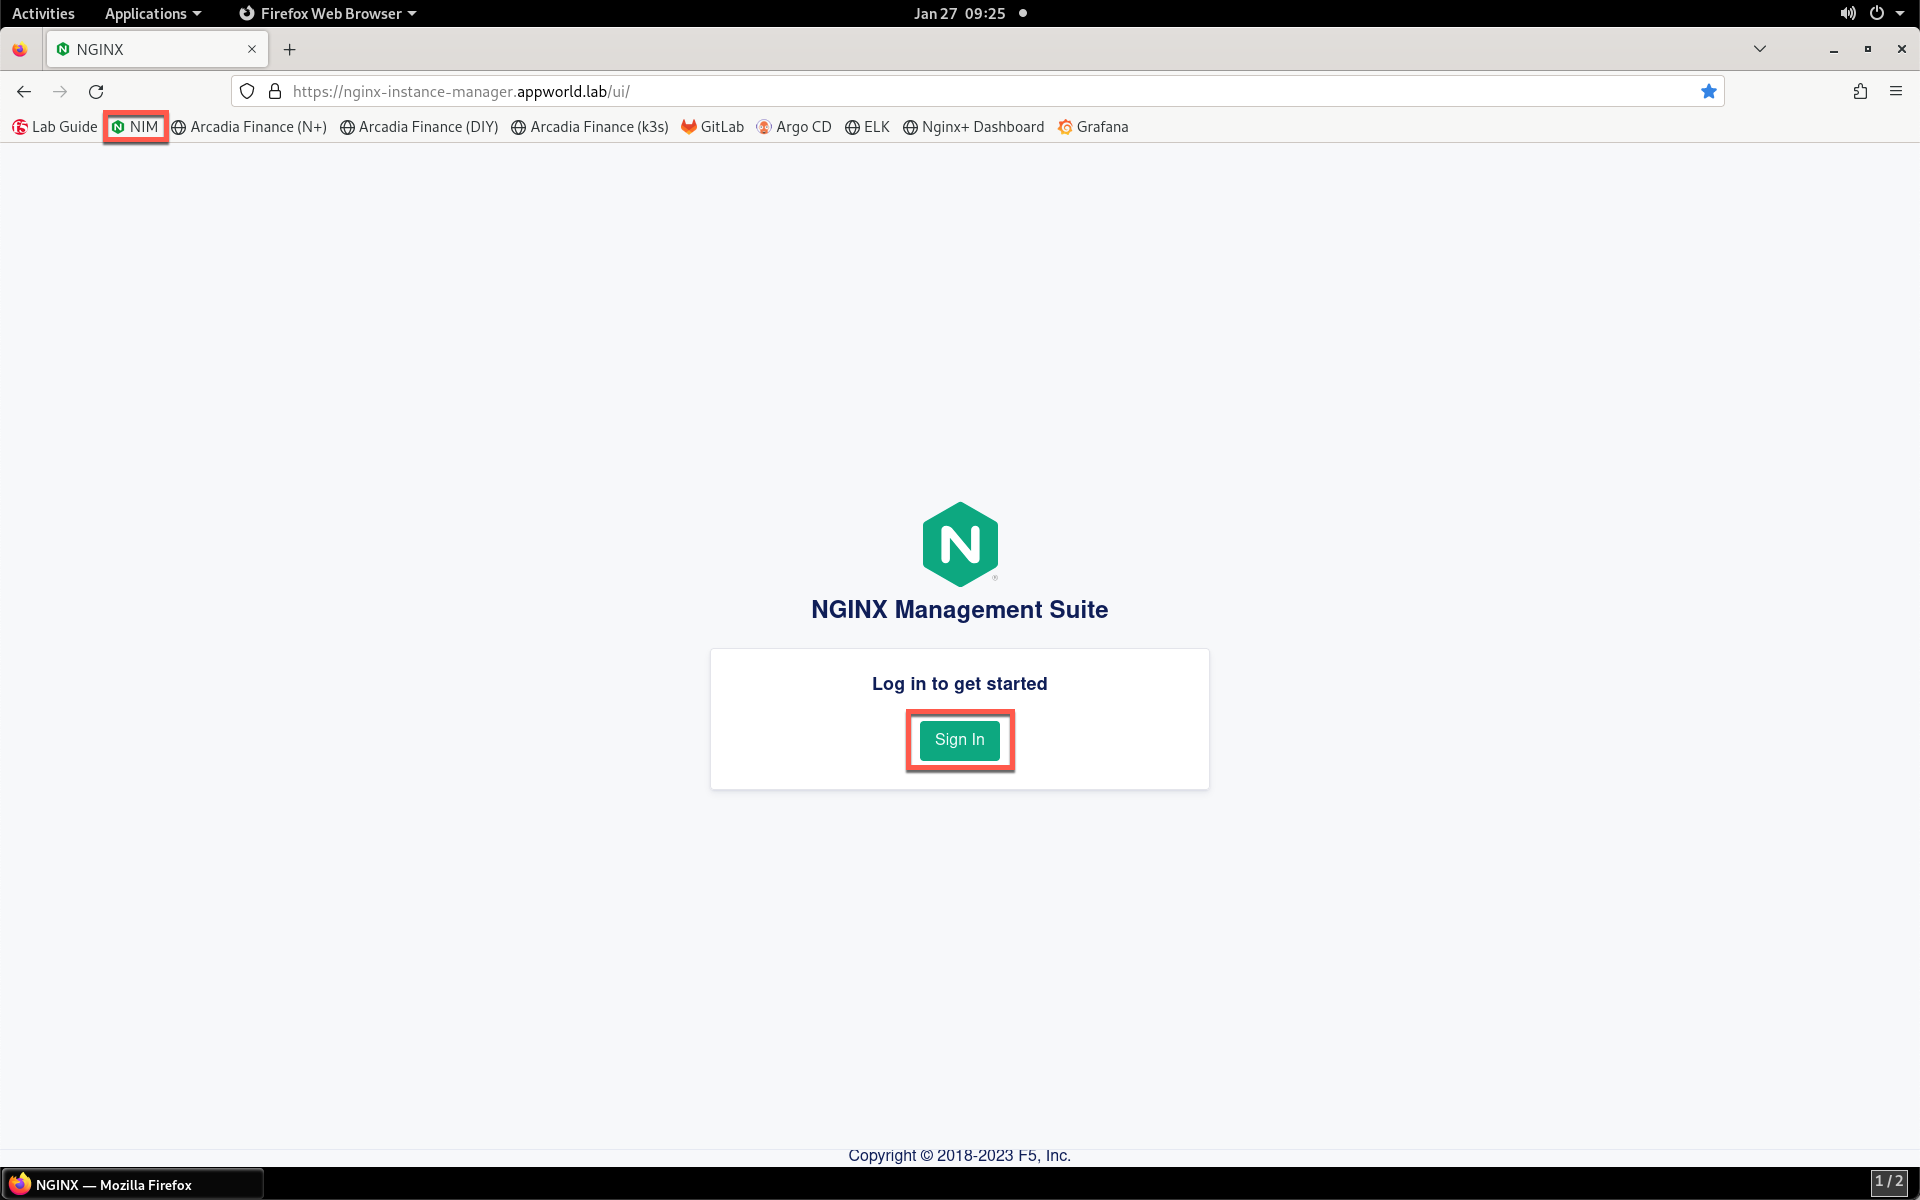
- This web application is being proxied by an NGINX Plus instance running NGINX App Protect WAF. This instance is being managed by NGINX Instance Manager. Take a look at NIM to view the configuration and instance/application metrics. Click on the NIM bookmark in Firefox or navigate to https://nginx-instance-manager.appworld.lab/ui/. You’ll be presented with the NIM login page. Click *Sign In*.
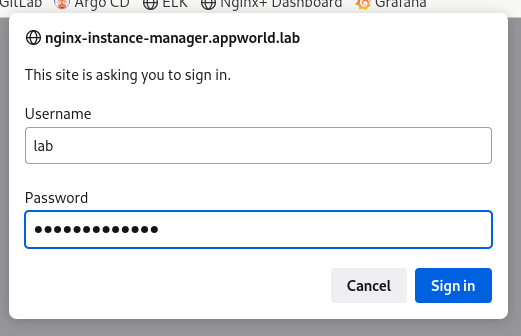
- You’ll see the login prompt. Log in using the lab / AppWorld2024! credentials.
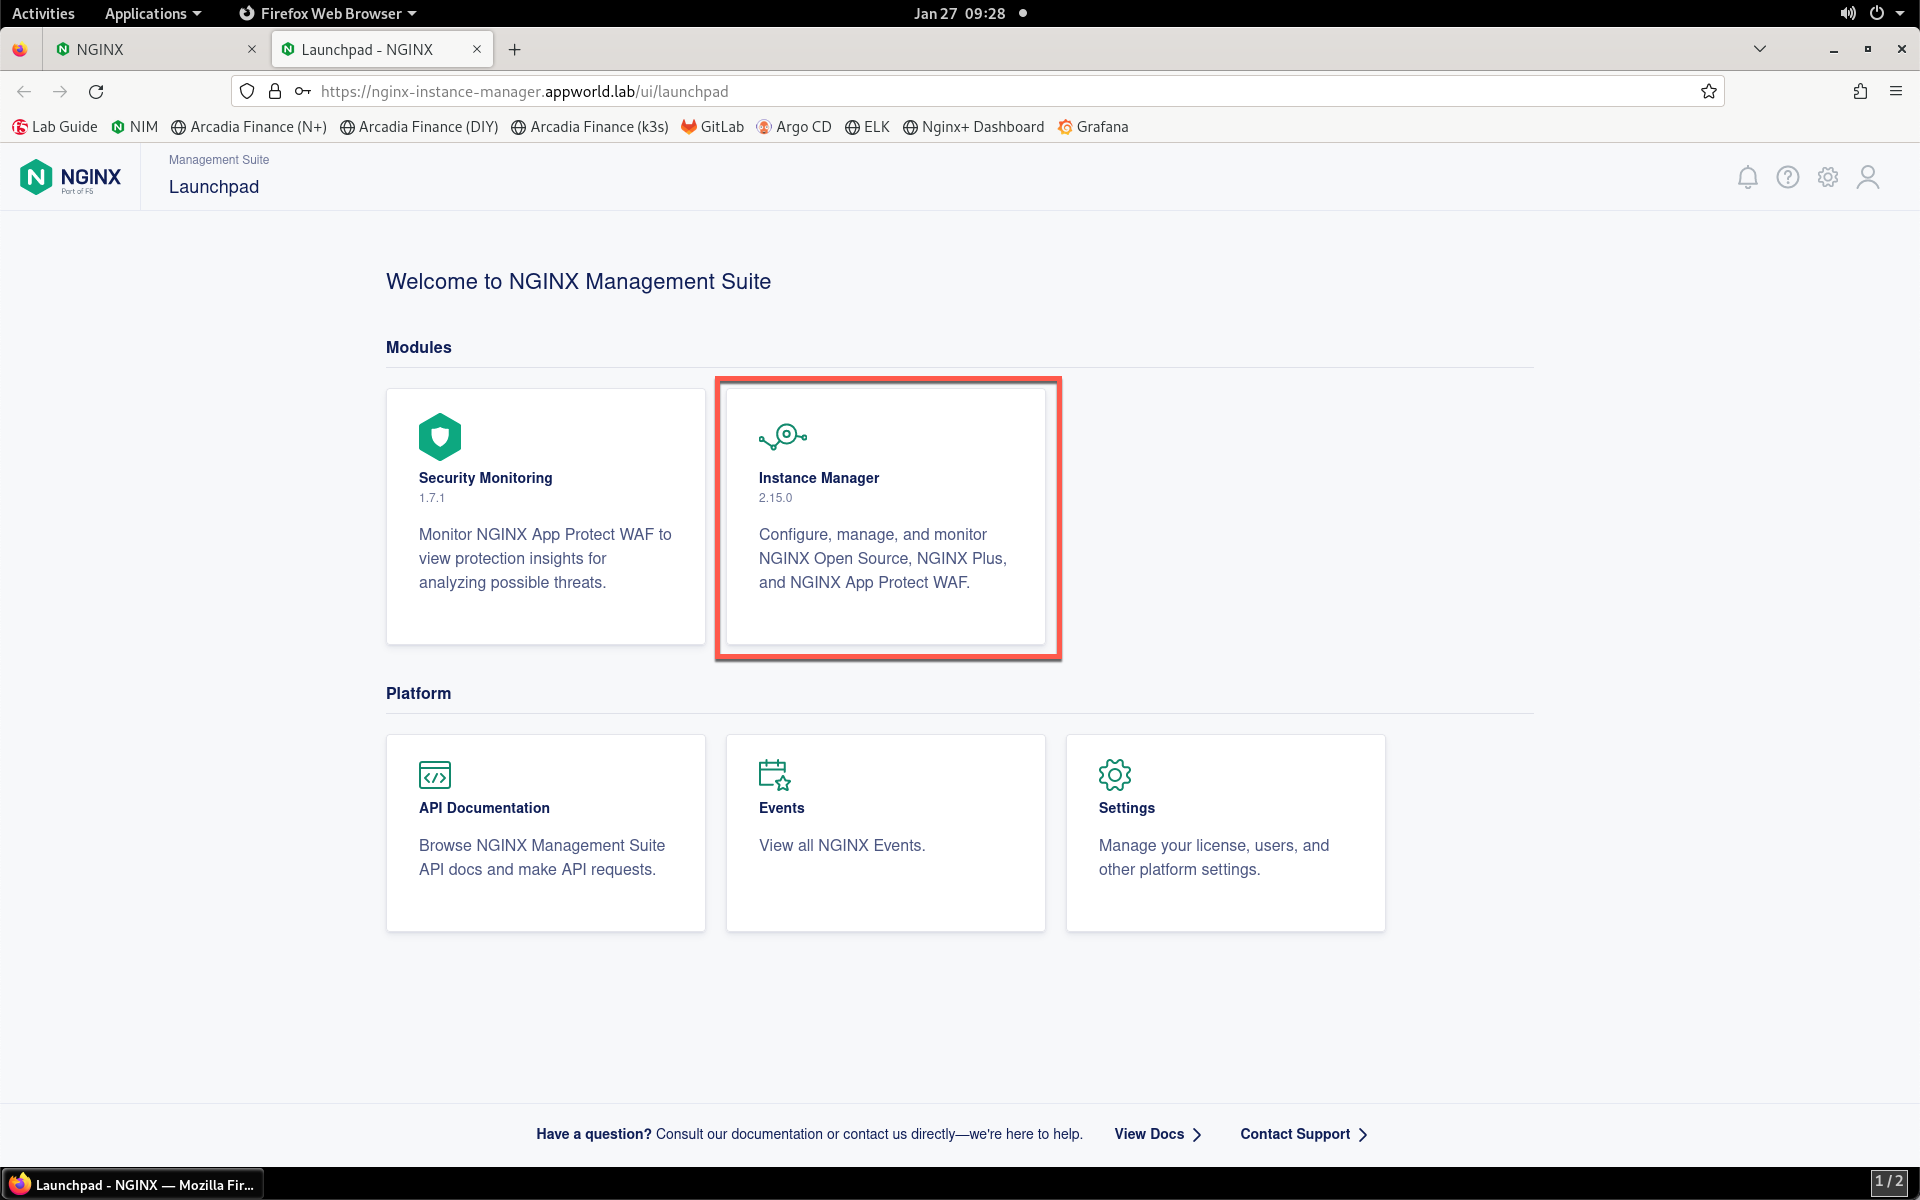
- You will see the NGINX Instance Manager Launchpad. Click on the Instance Manager button.
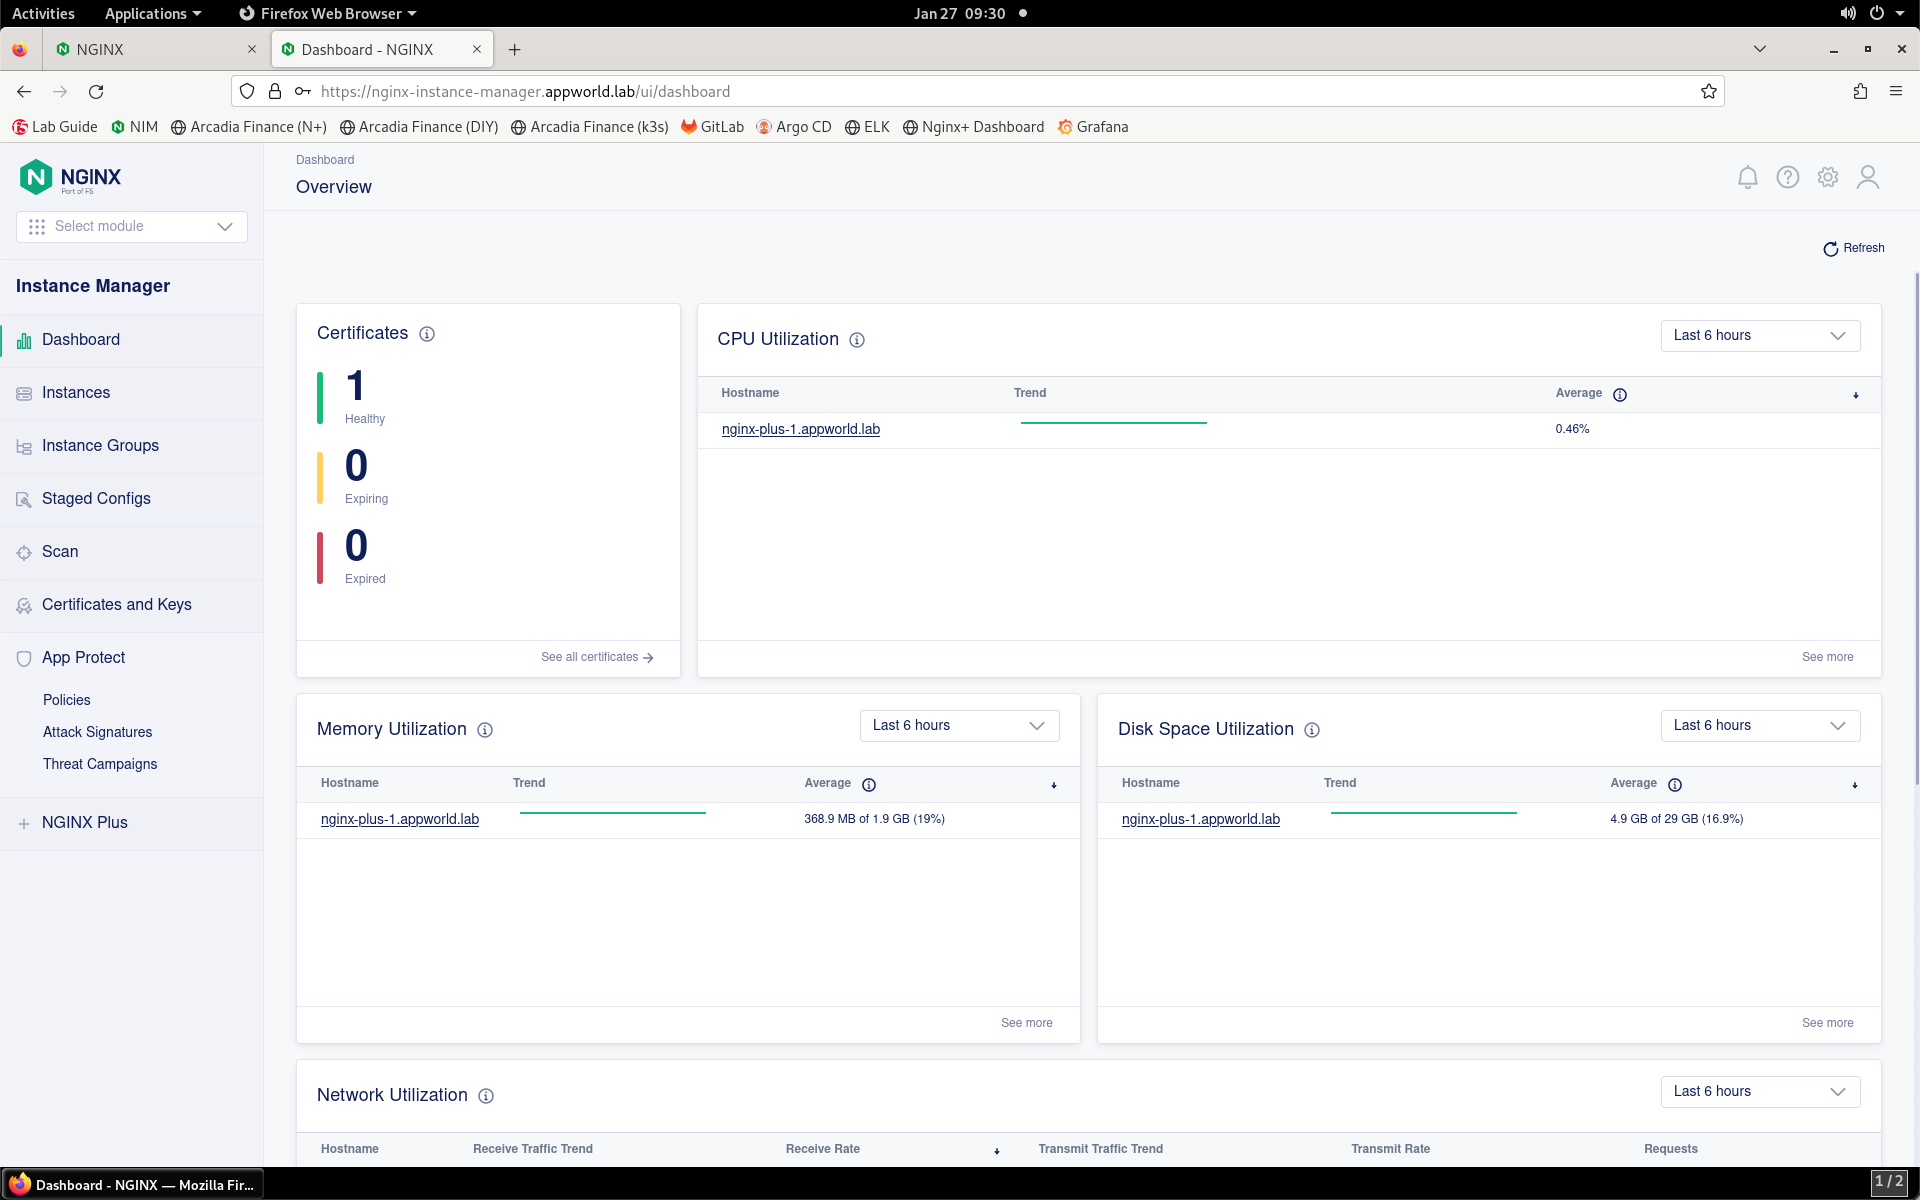
- You are presented with the Overview dashboard. This page shows the overall health of the manages instances.
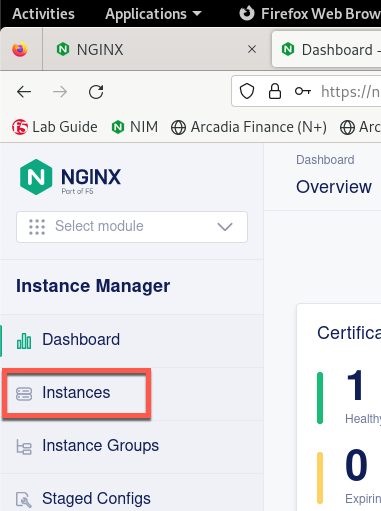
- Click the Instances button in the left navigation.
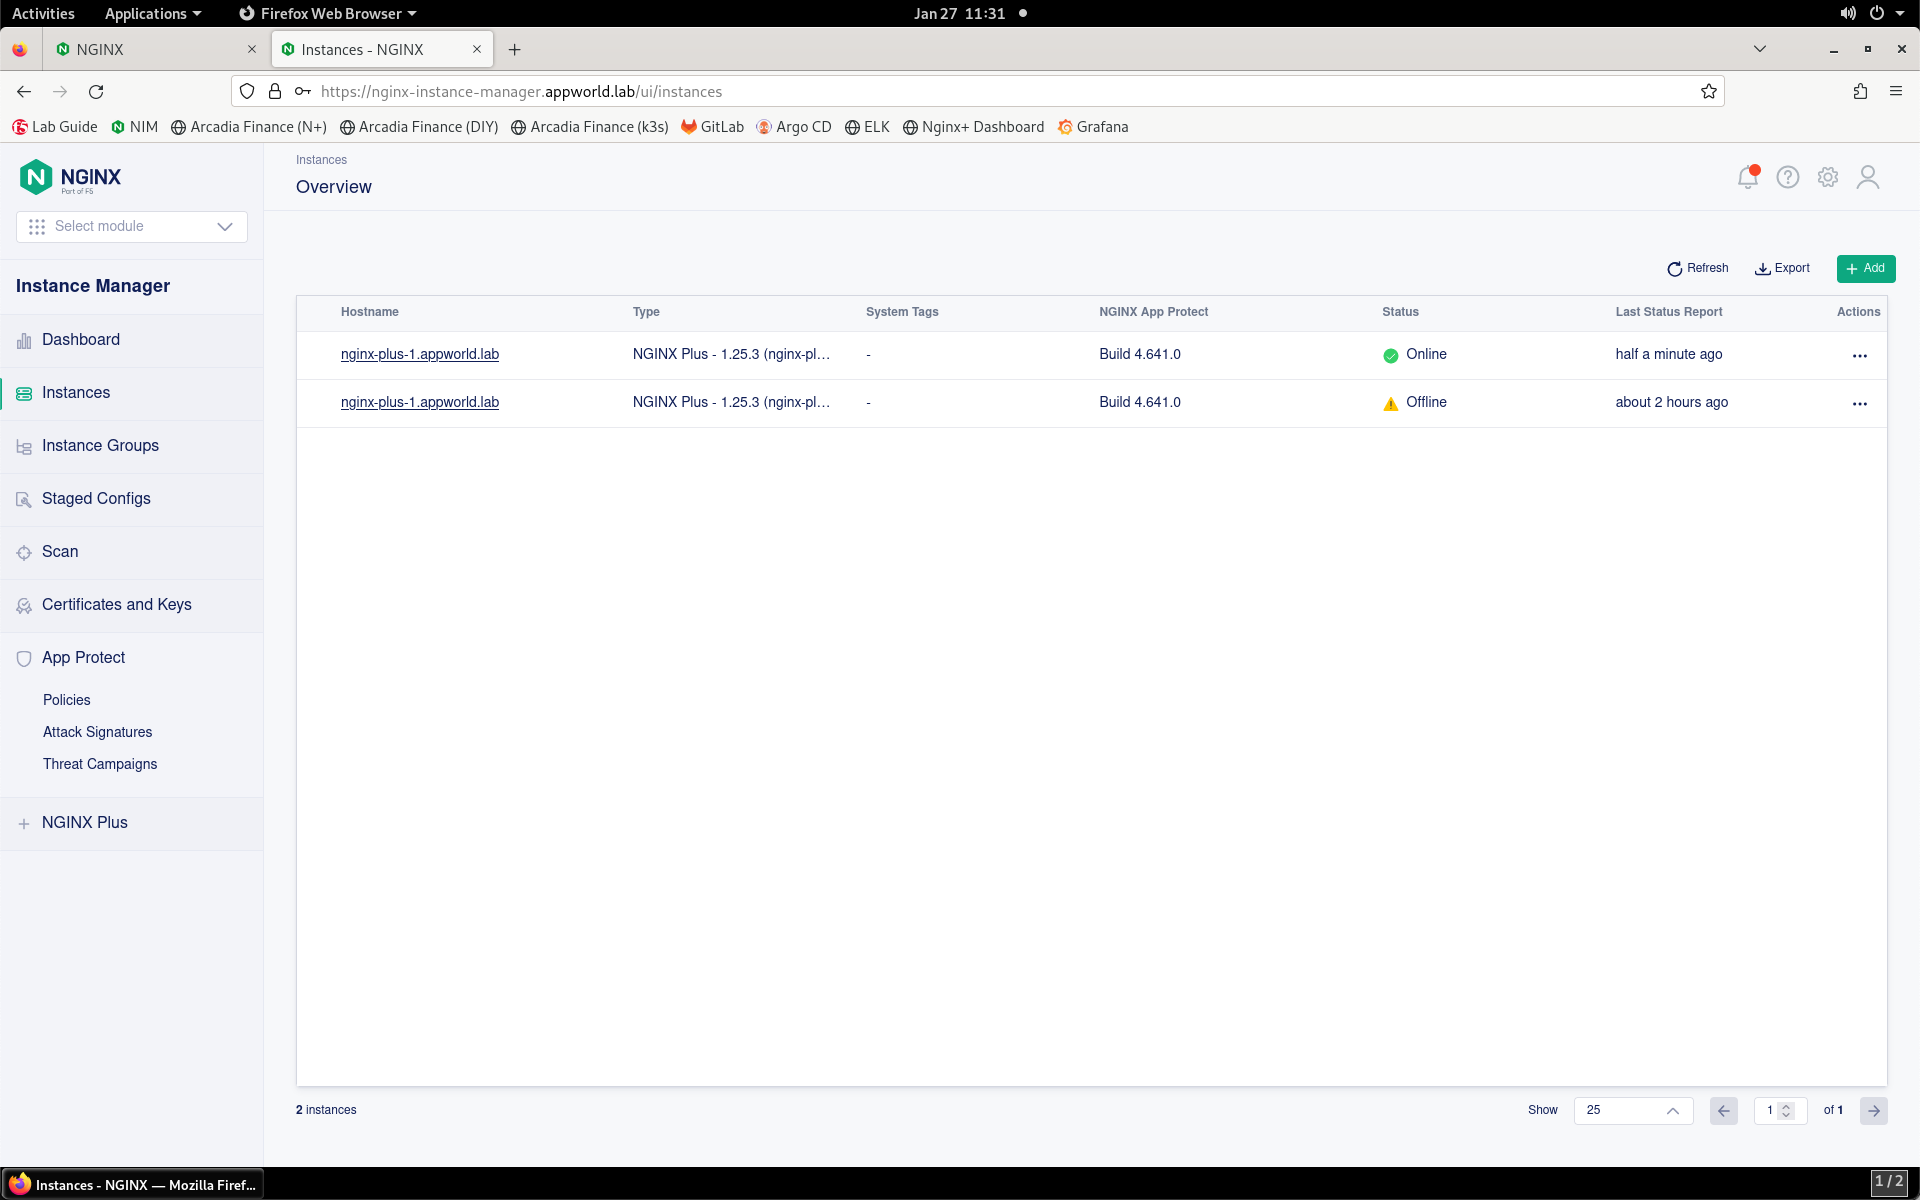
- You will now see the the Instance Manager Instances Overview page.
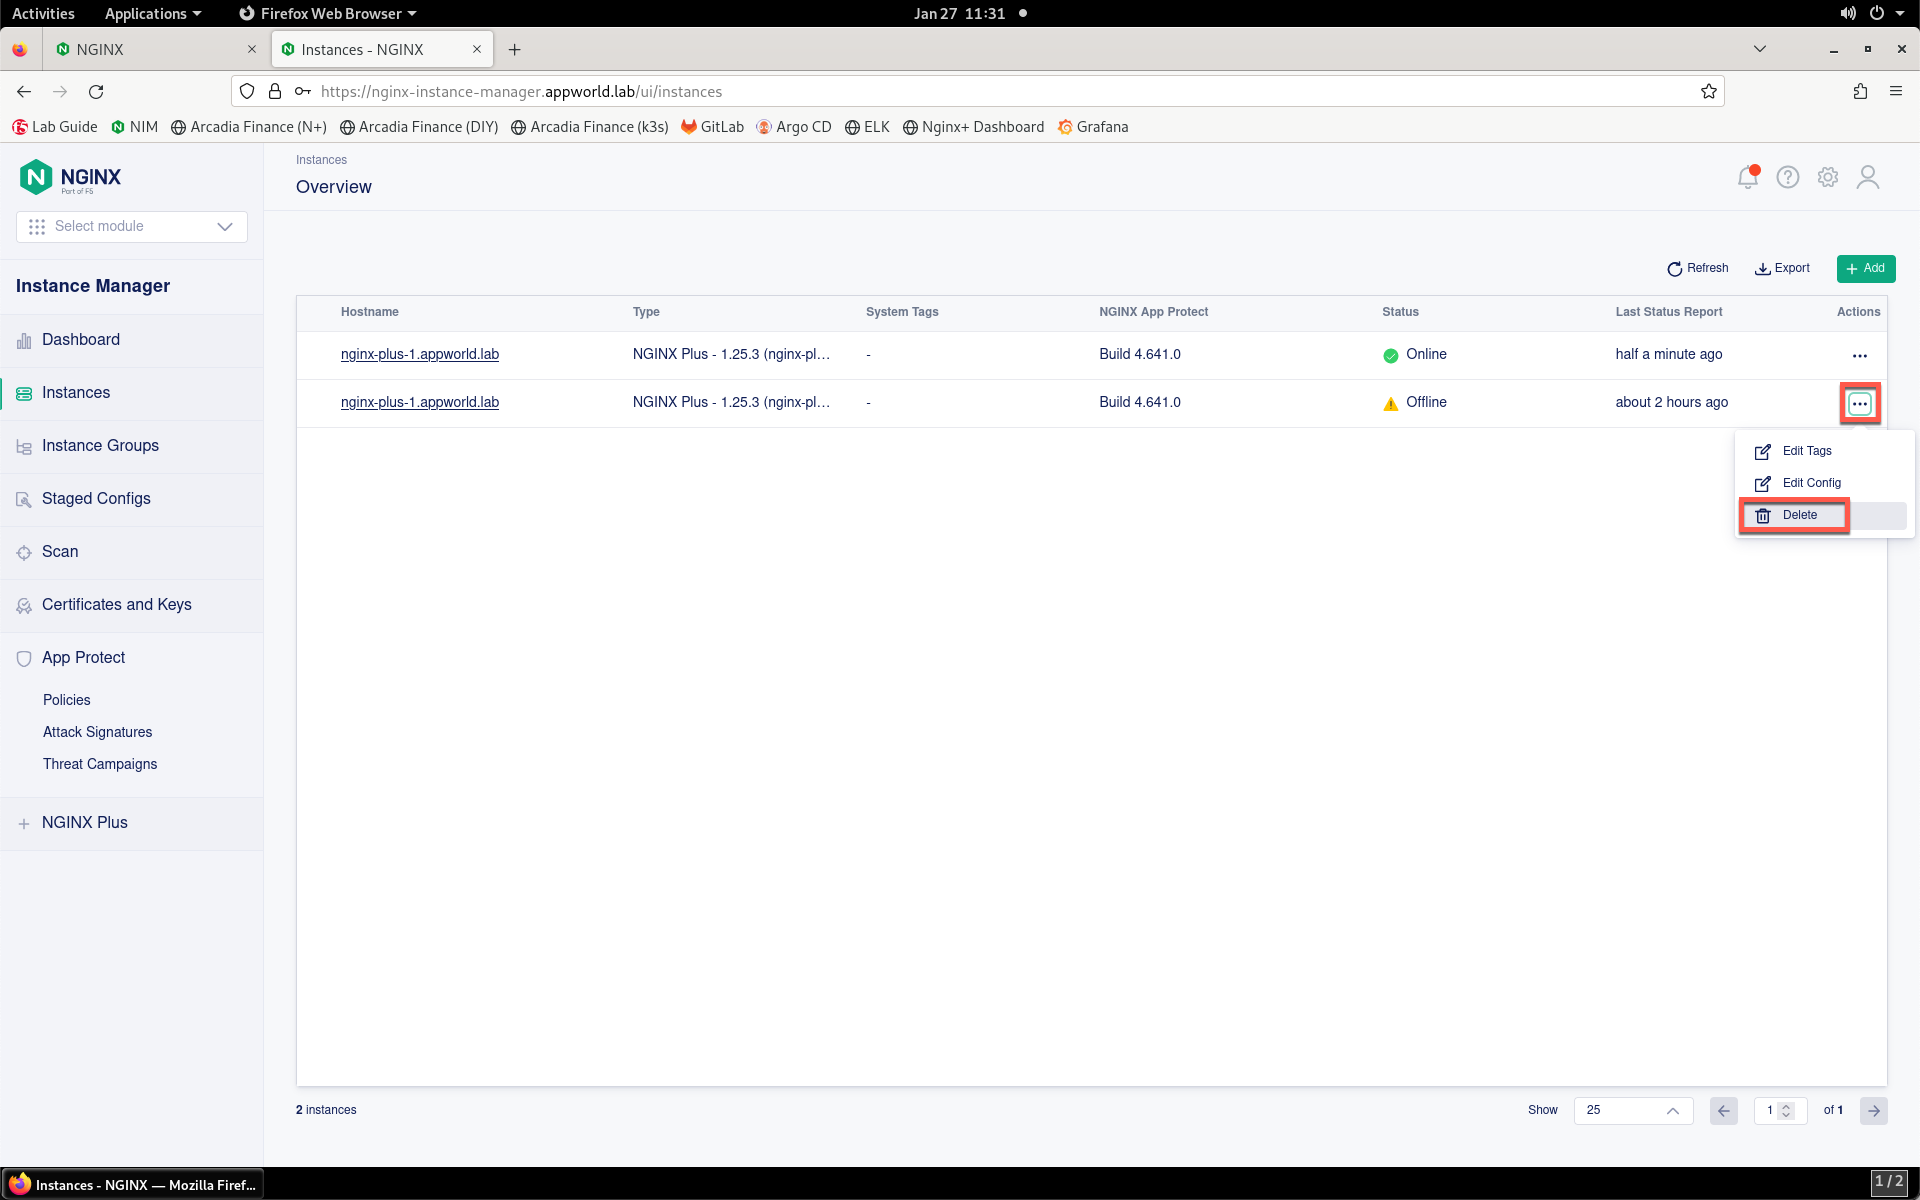
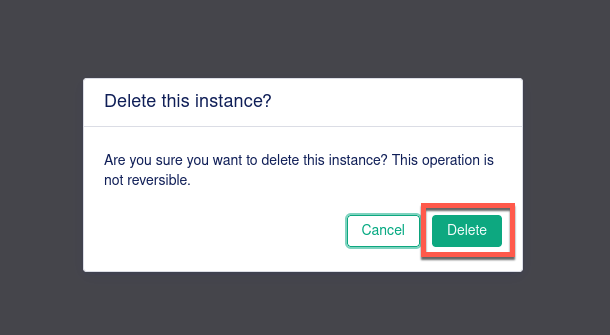
- Each instance of this lab runs in a virtual environment. Since new VMs are deployed for each instance, the operating system identifiers change, so each NGINX Plus instance is treated as a new instance. Thus, you may see previous instances listed. Delete only the Offline instances by clicking the three dot icon under the Actions column and selecting Delete, as shown in the image below.
Warning
Do not delete the active instance at the top of the list!
- Click on the nginx-plus-1.appworld.lab instance in the list that shows Online under the Status column. The Instance Detail screen loads.
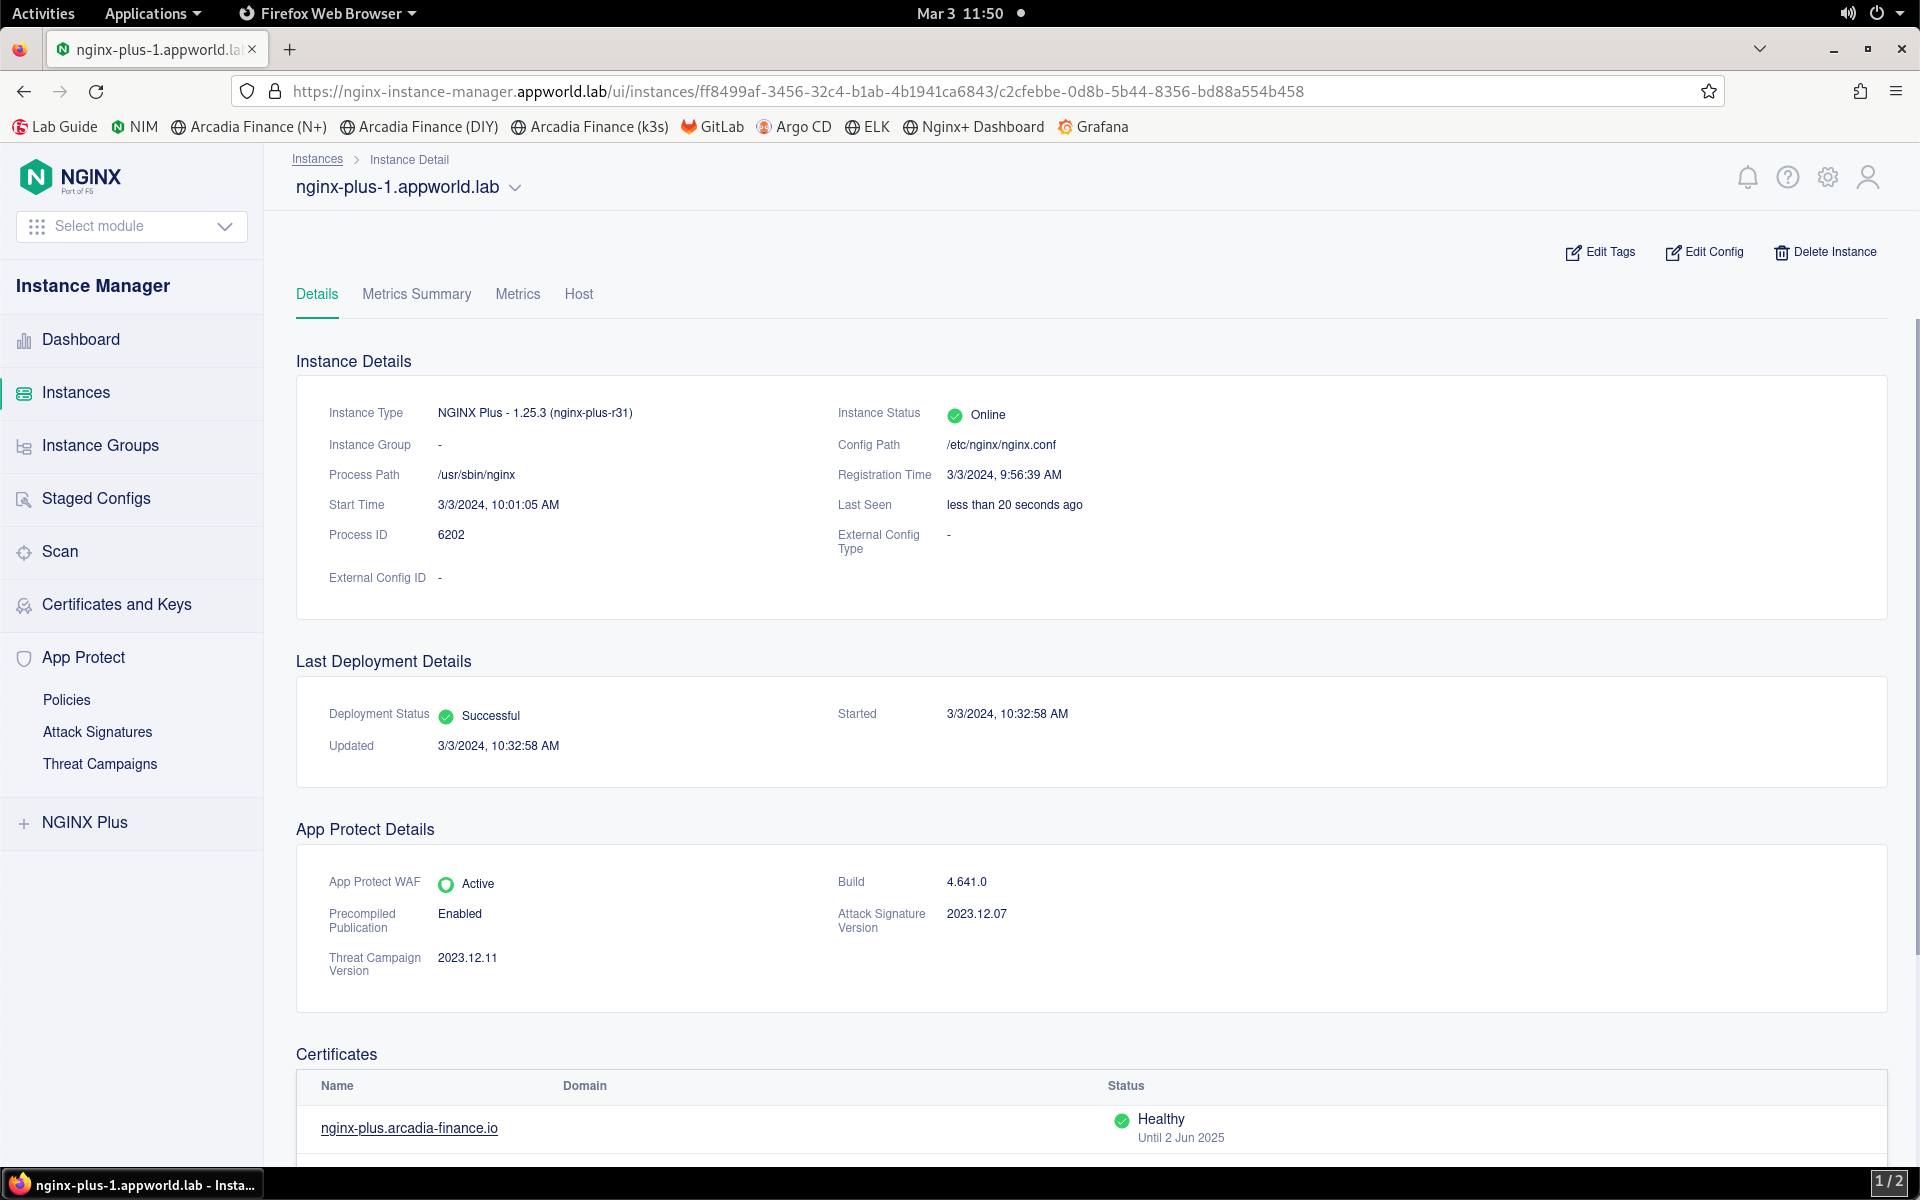
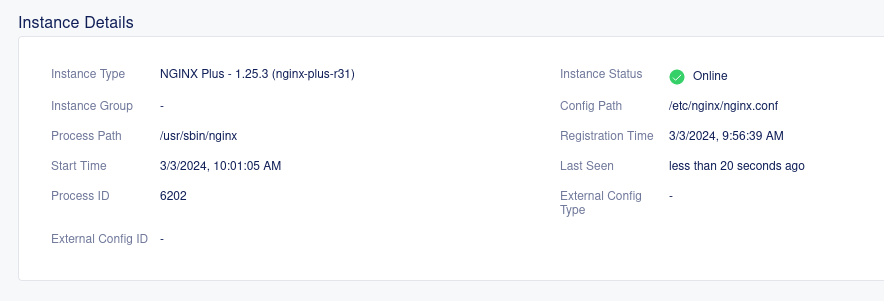
- Notice that the Details tab is loaded by default in this screen. Scroll through the contents of the Details tab. In the first section titled Instance Details, notice that you can see details about the NGINX Instance itself, including version, status, configuration path, and more.
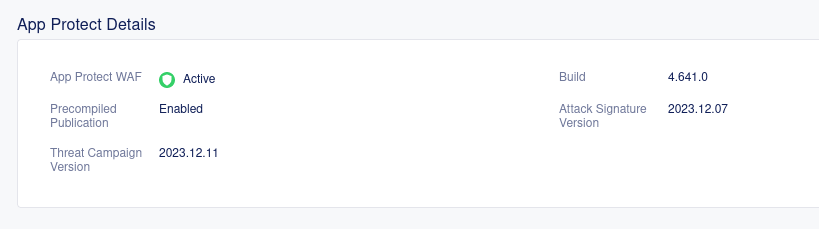
- In the App Protect Details section, you can clearly see that NGINX App Protect has been installed and is active.
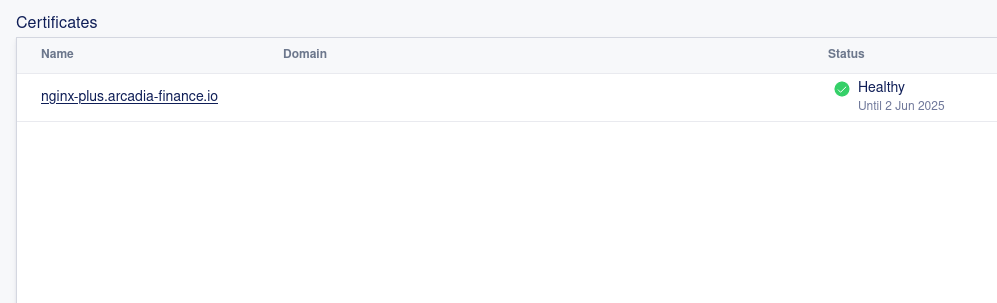
- Scroll down to Certificates to view the state of any certificates that this instance references.
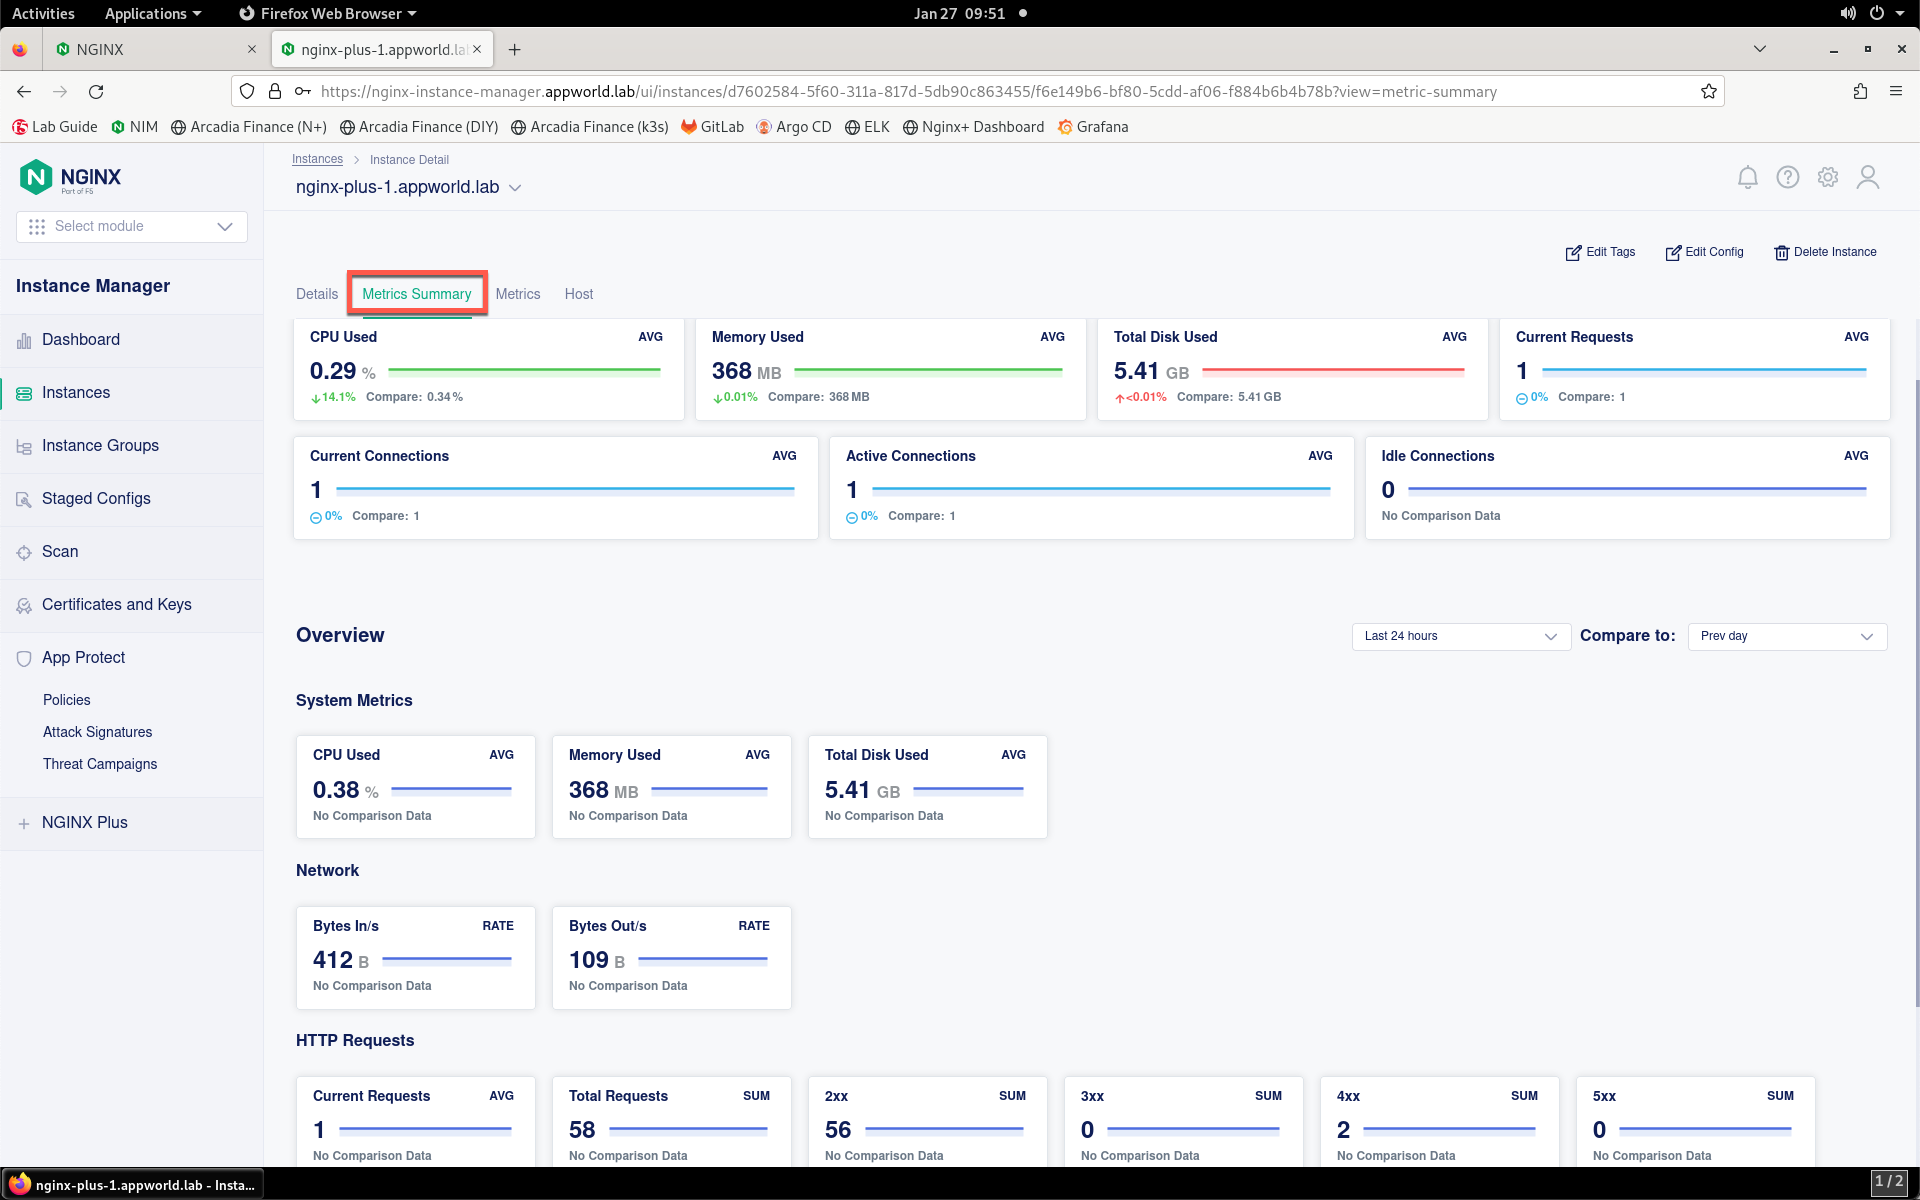
- Next, click on the Metrics Summary tab. In this tab, you can see visualized metrics around instance resource utilization, including CPU, memory, overall connection counts, HTTP connection counts and more.
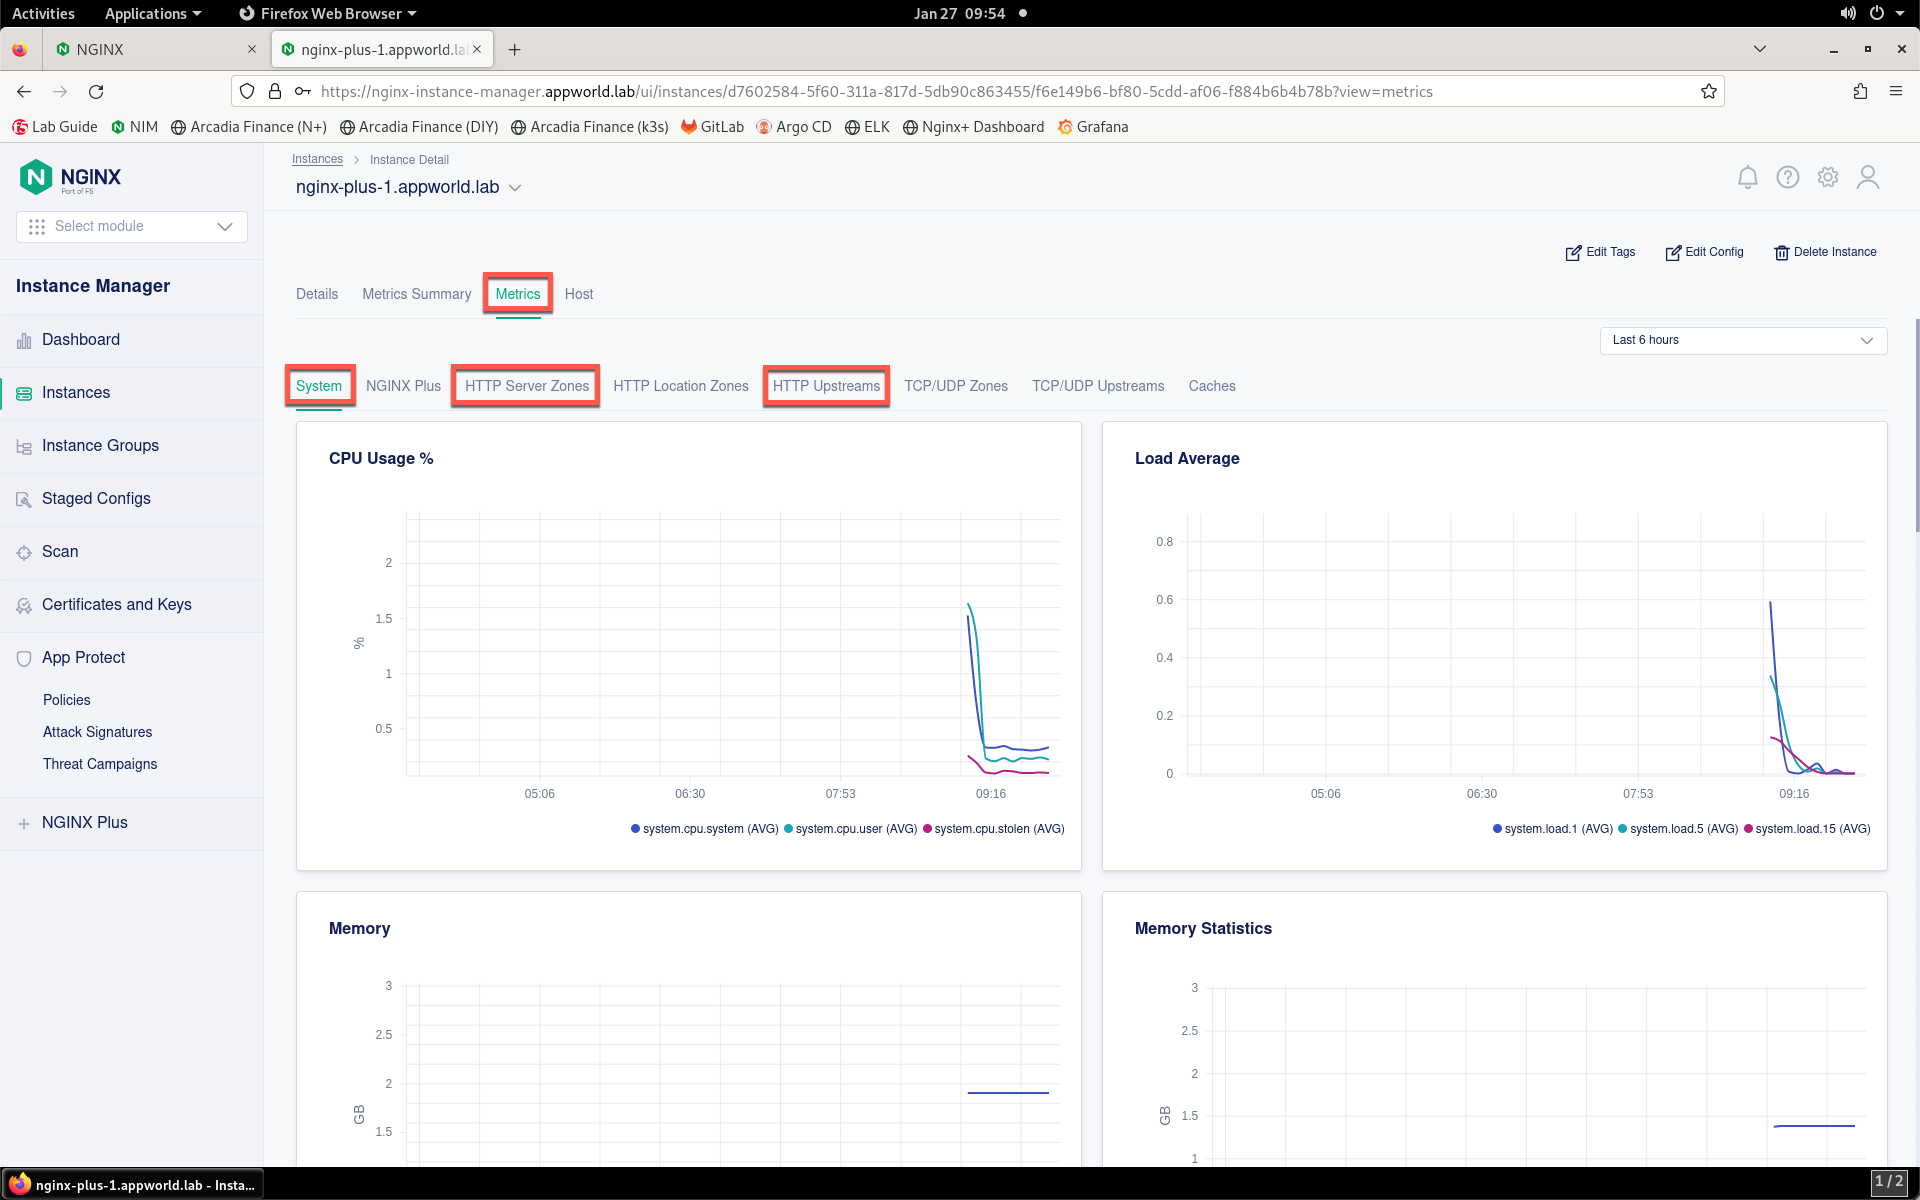
- Click on the Metrics tab to drill-down into the component-level, real-time values of all metrics available for the instance. Click through the sub-tabs, such as System, HTTP Server Zones and HTTP Upstreams. These graphs provide a quick way to identify anomalies in load and performance.
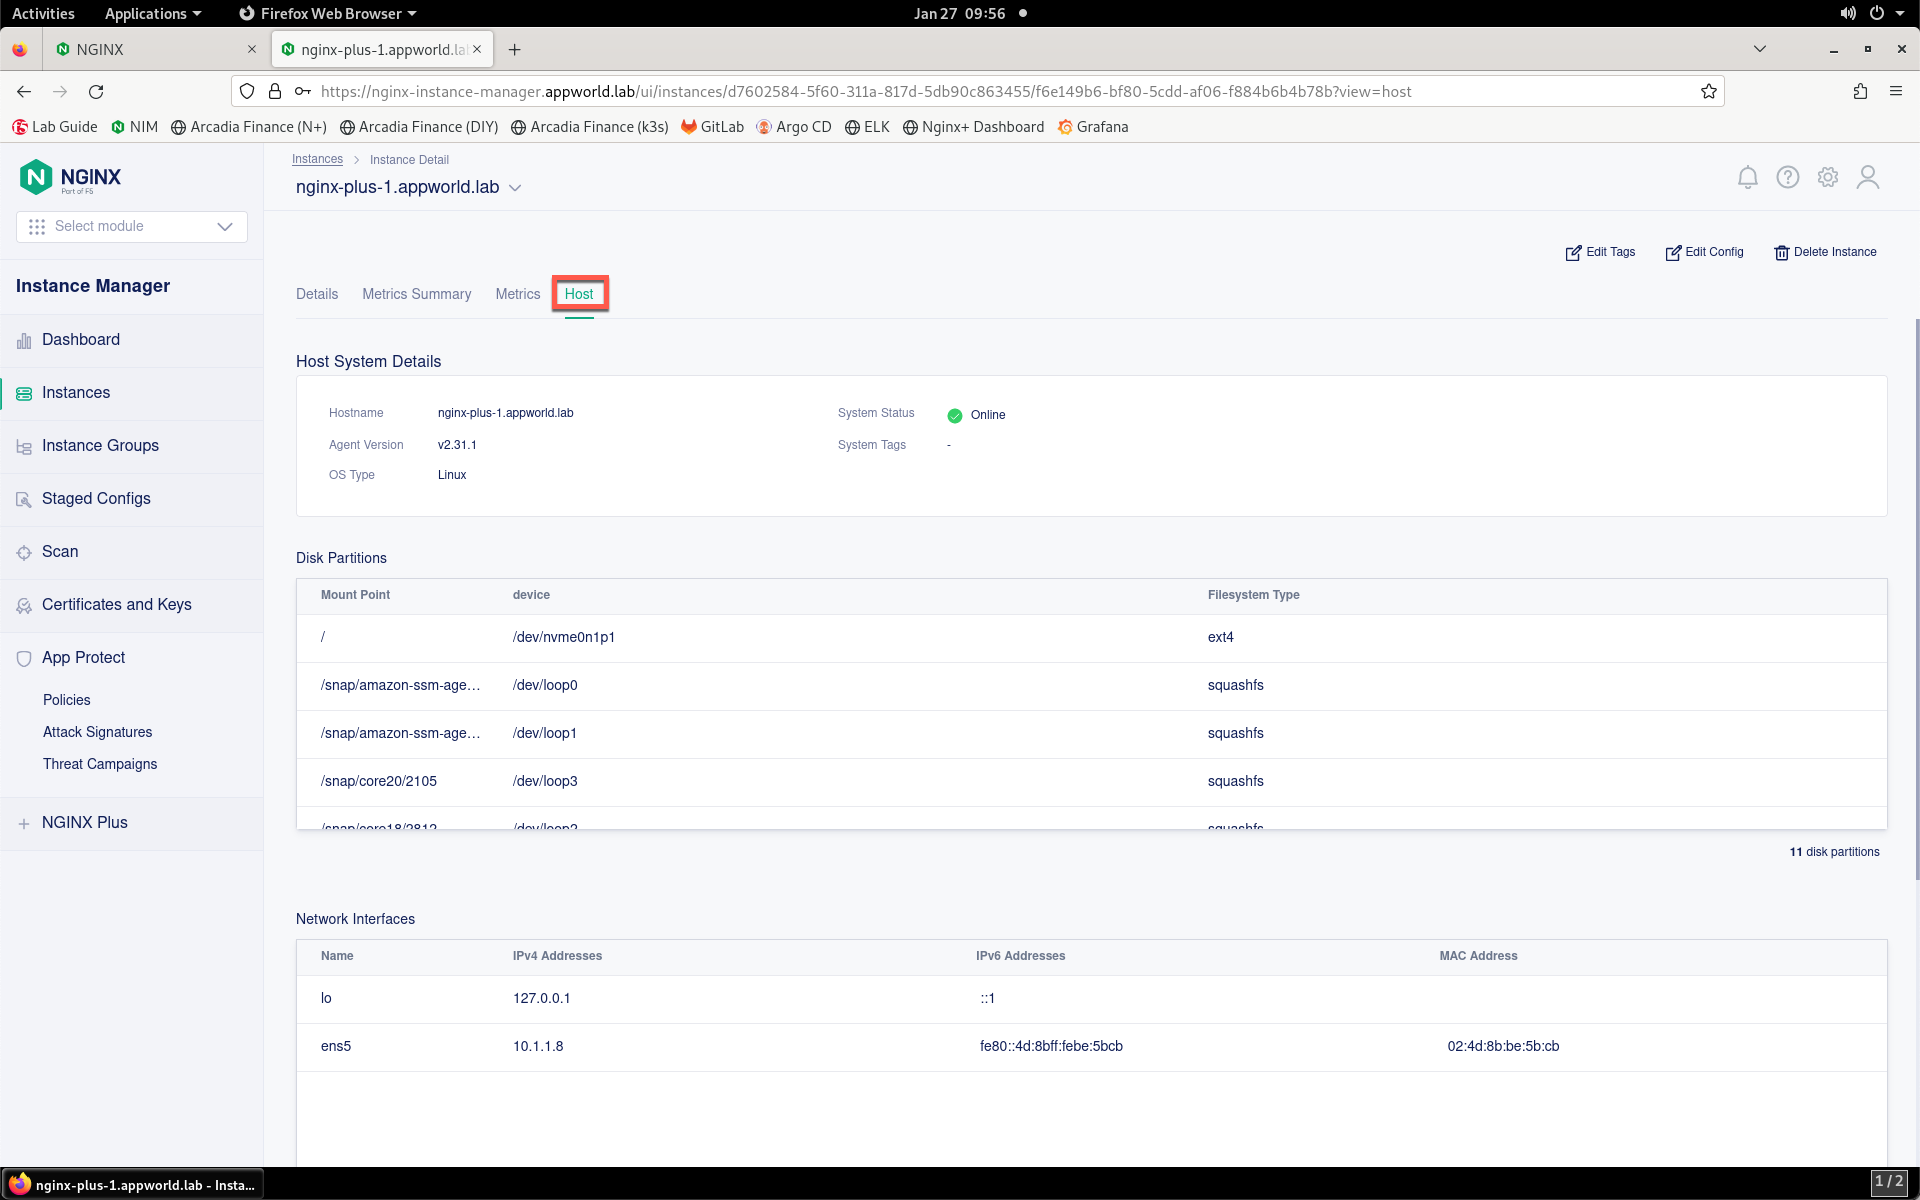
- Finally, click on the Host tab to display detailed host information about the instance. Values such as hostname, file system info and network interfaces will be displayed here.
Now that you are familiar with viewing metrics of the NGINX Plus instance in NIM, we’ll continue to the next lab.