NGINX Modern Apps > Class 5 - NGINX App Protect WAF & DoS > Module 2 - Protect the Arcadia Finance App with NGINX App Protect WAF Source | Edit on
Adding the NGINX Plus with App Protect Instance to NGINX Instance Manager
Since this lab utilizes NIM, we’re going to install the NGINX Agent and add the instance to the NGINX Instance Manager for centralized management and analytics.
Warning
If you’re installing the NGINX Agent in your environment, a few steps are required before starting the installation process. See https://docs.nginx.com/nginx-management-suite/nginx-agent/install-nginx-agent/ for more information. In this lab, these have been checked for you.
- Connect to the NGINX Plus 2 instance via SSH, if not already connected.
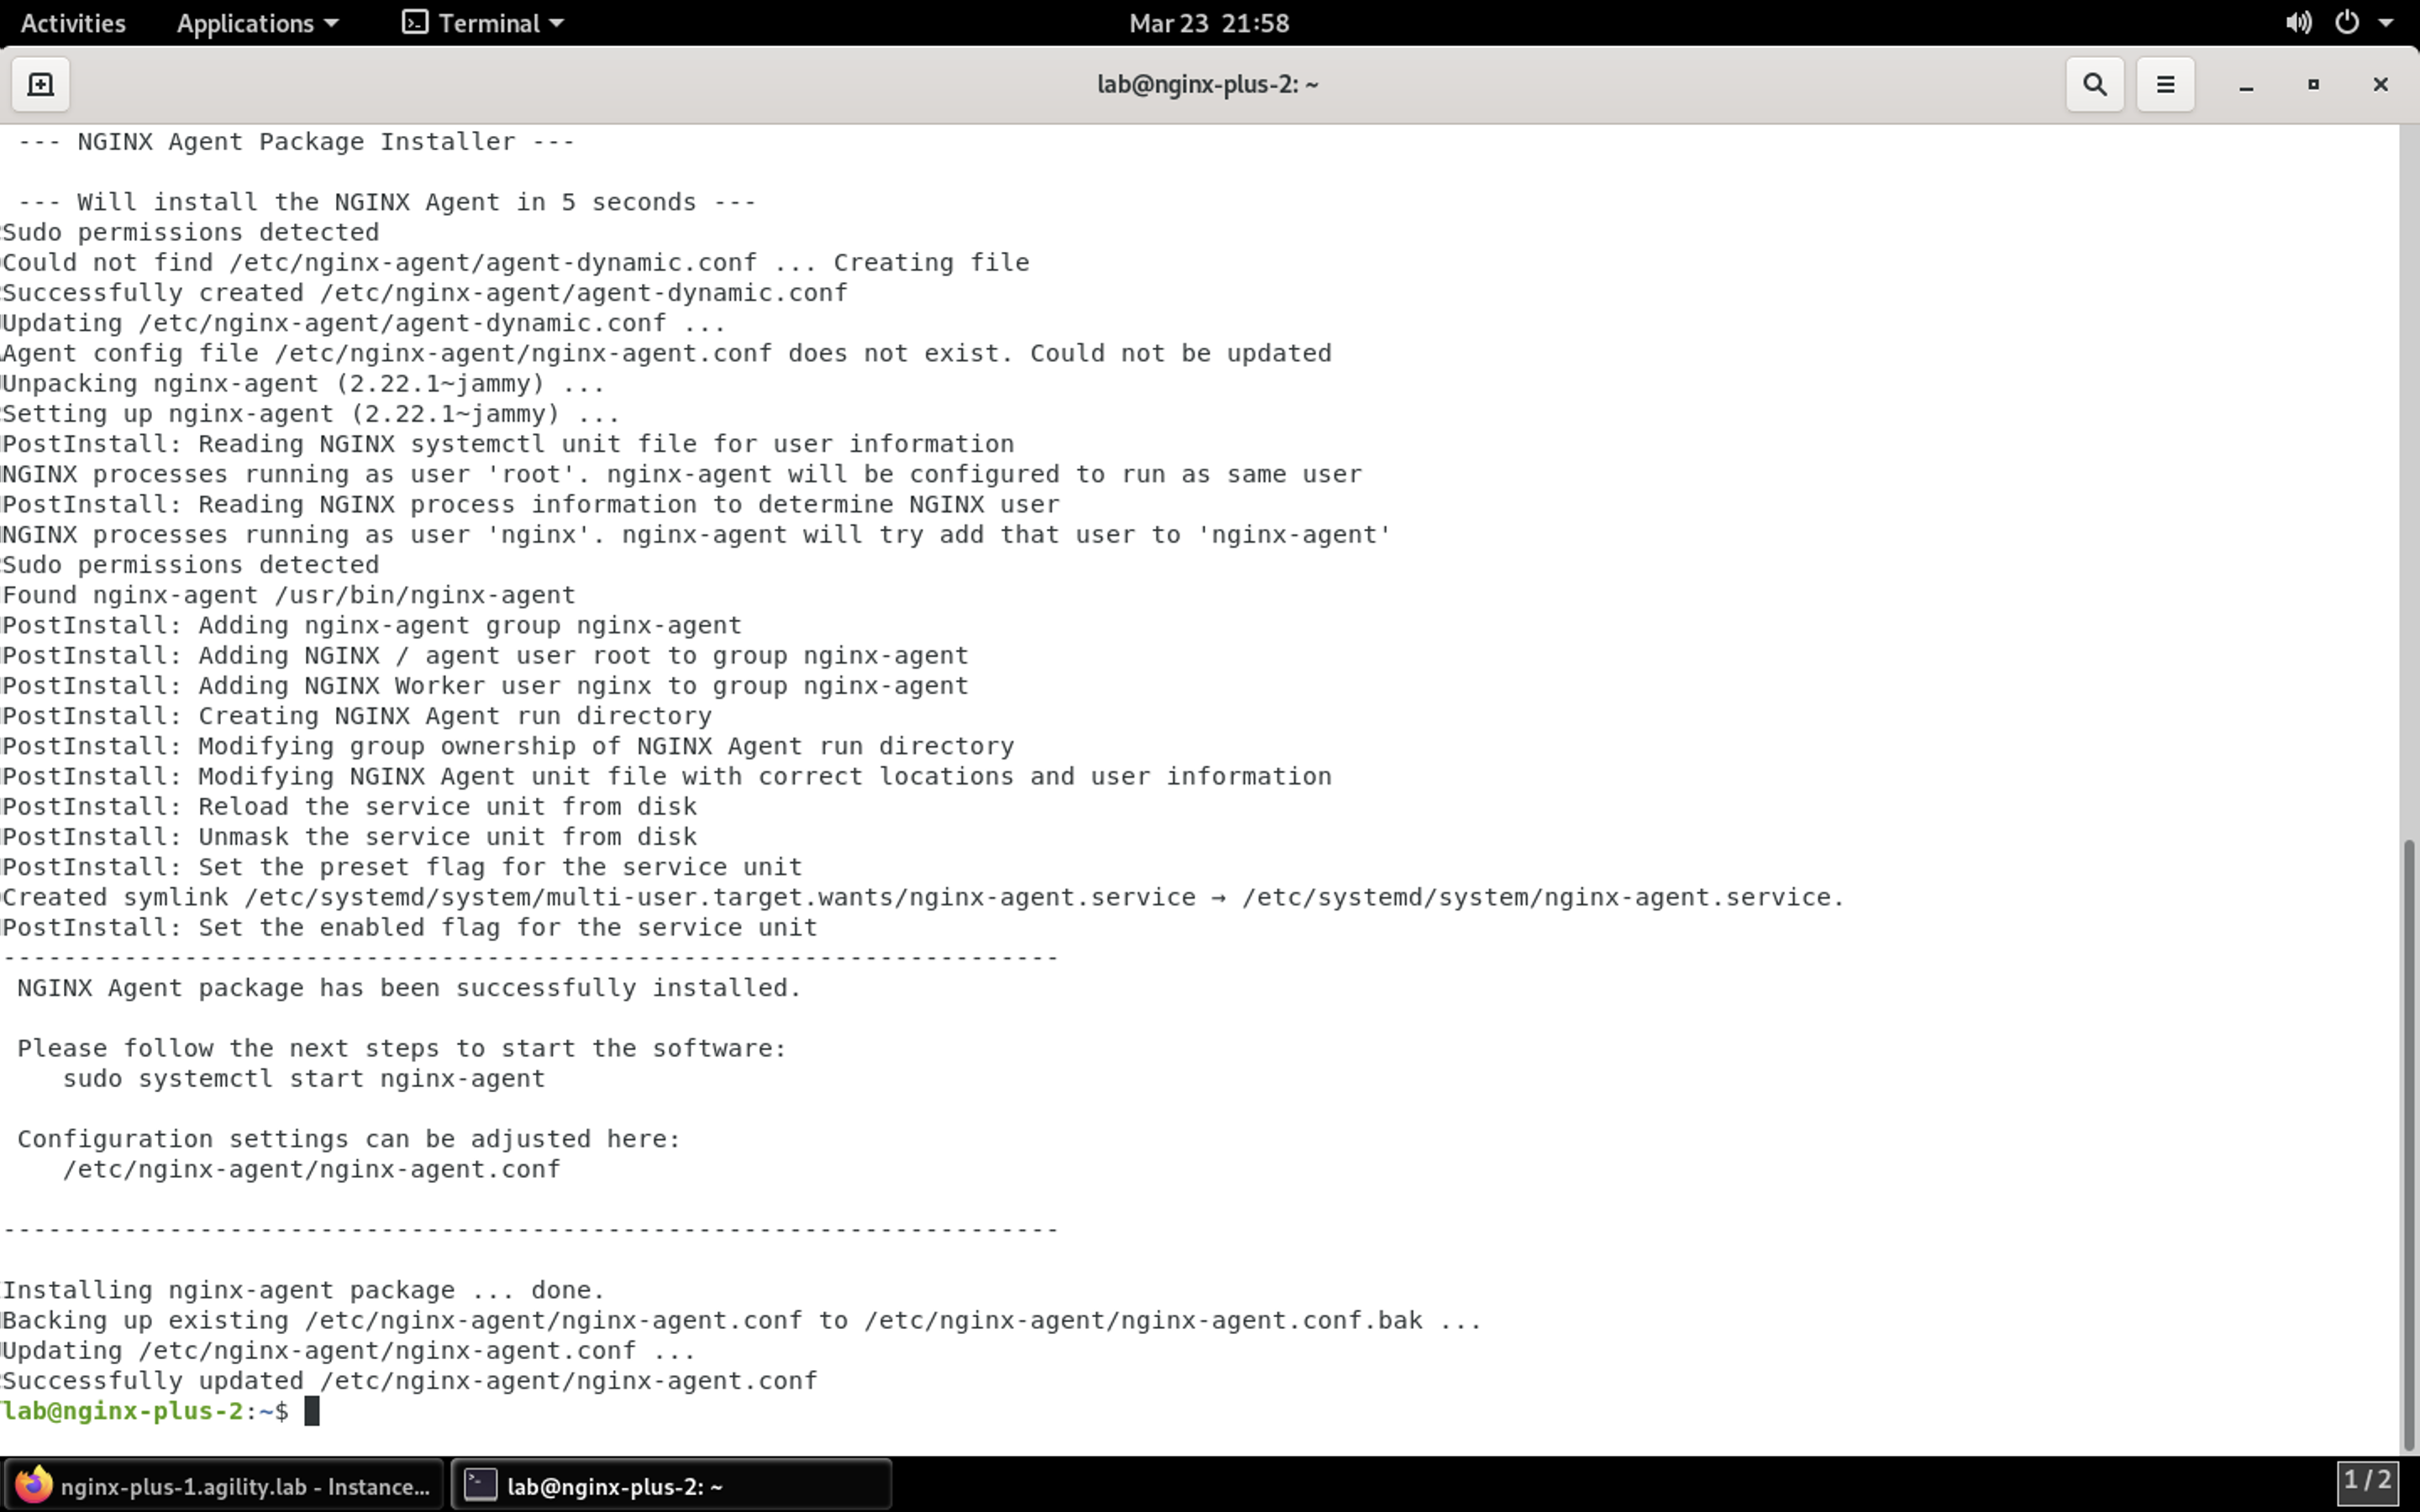
- The NGINX Agent will be pulled from the NGINX Instance Manager server and installed:
curl -k https://nginx-instance-manager.appworld.lab/install/nginx-agent | sudo sh
sudo systemctl restart nginx-agent
Result
- Configure the NGINX Agent
Now you’ll need to configure NGINX Agent to perform additional tasks for NGINX App Protect.
Load the file into a file editor:
sudo nano /etc/nginx-agent/nginx-agent.conf
Near the end of the file, modify the line starting with “config_dirs” so it looks like the following:
config_dirs: "/etc/nginx:/usr/local/etc/nginx:/usr/share/nginx/modules:/etc/nms:/etc/app_protect"
Next, add the following configuration block to the end of the file:
Caution
When you paste the block below, extra line breaks may be included. Please remove those line spaces and ensure the lines are indented properly to ensure no errors occur.
events:
  # report data plane events back to the management plane
  enable: true

# Enable reporting NGINX App Protect details to the management plane.
extensions:
  - nginx-app-protect
  - nap-monitoring

# Enable reporting NGINX App Protect details to the control plane.
nginx_app_protect:
  # Report interval for NGINX App Protect details - the frequency the NGINX Agent checks NGINX App Protect for changes.
  report_interval: 15s
  # Enable precompiled publication from the NGINX Instance Manager (true) or perform compilation on the data plane host (false).
  precompiled_publication: true
# NGINX App Protect Monitoring config
nap_monitoring:
  # Buffer size for collector. Will contain log lines and parsed log lines
  collector_buffer_size: 50000
  # Buffer size for processor. Will contain log lines and parsed log lines
  processor_buffer_size: 50000
  # Syslog server IP address the collector will be listening to
  syslog_ip: "127.0.0.1"
  # Syslog server port the collector will be listening to
  syslog_port: 514
Prior to saving, your screen should look the same as below:
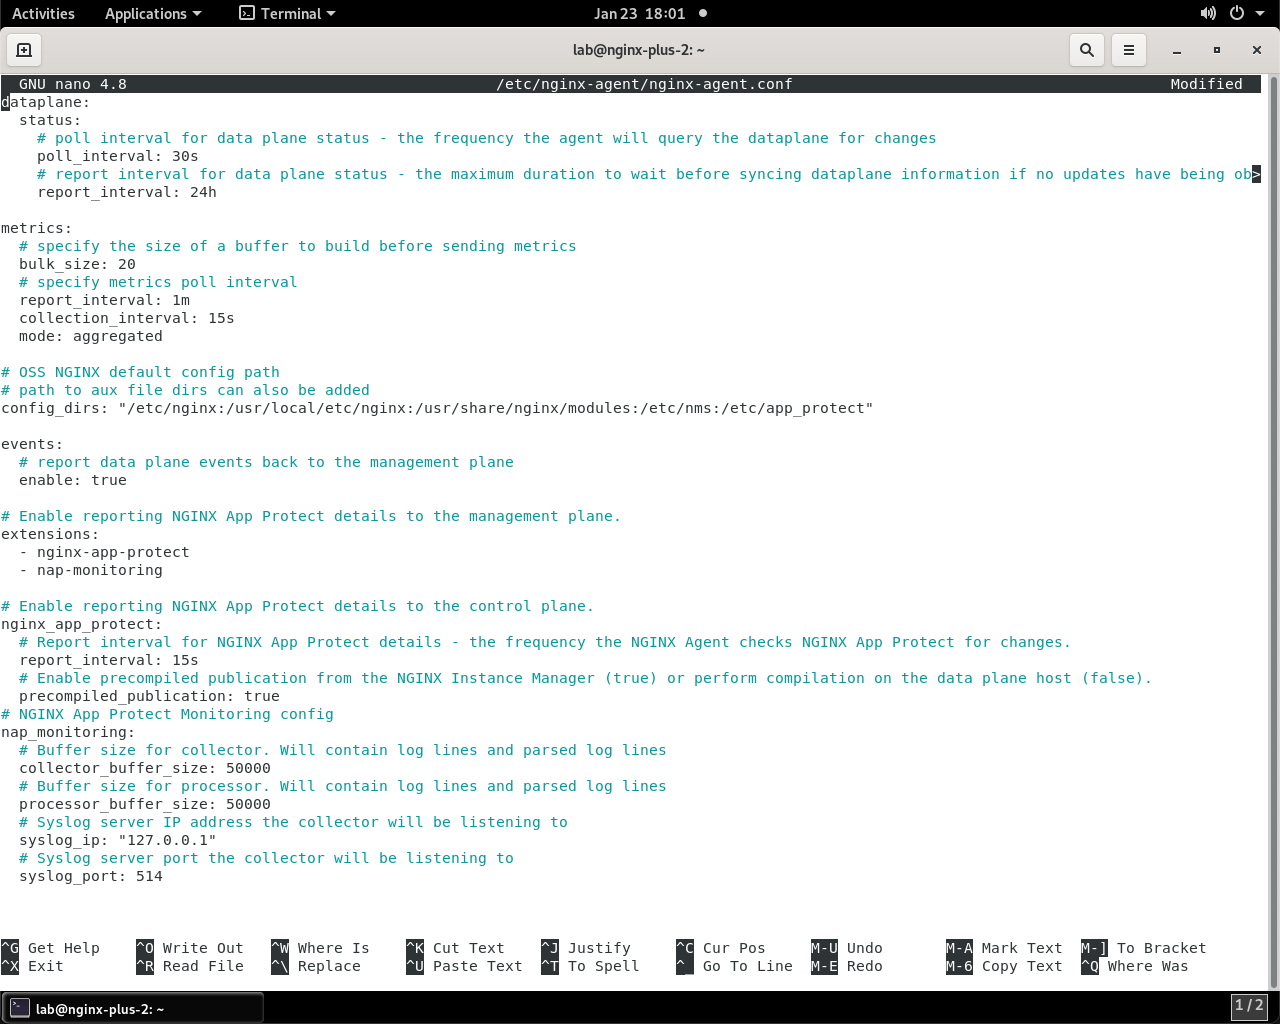
Press CTRL + X to save the file, followed by Y when asked to save the buffer, then enter when asked for the filename.
In this example, we’ve configured NGINX Agent to:
- Check for configuration changes every 15 seconds
- Allow for precompiled policies, meaning that NIM will compile the policy before sending to the NGINX Plus/NAP instance
- Enable large buffers for NGINX App Protect Monitoring
- Enable NGINX Agent to run a syslog daemon that will forward logs to NIM Security Monitoring
- Start the NGINX Agent and set to start at boot:
sudo systemctl enable --now nginx-agent
Create the Metrics service on NGINX
The NGINX Agent is now configured and started. We’ll need a few more configuration pieces to finish the installation.
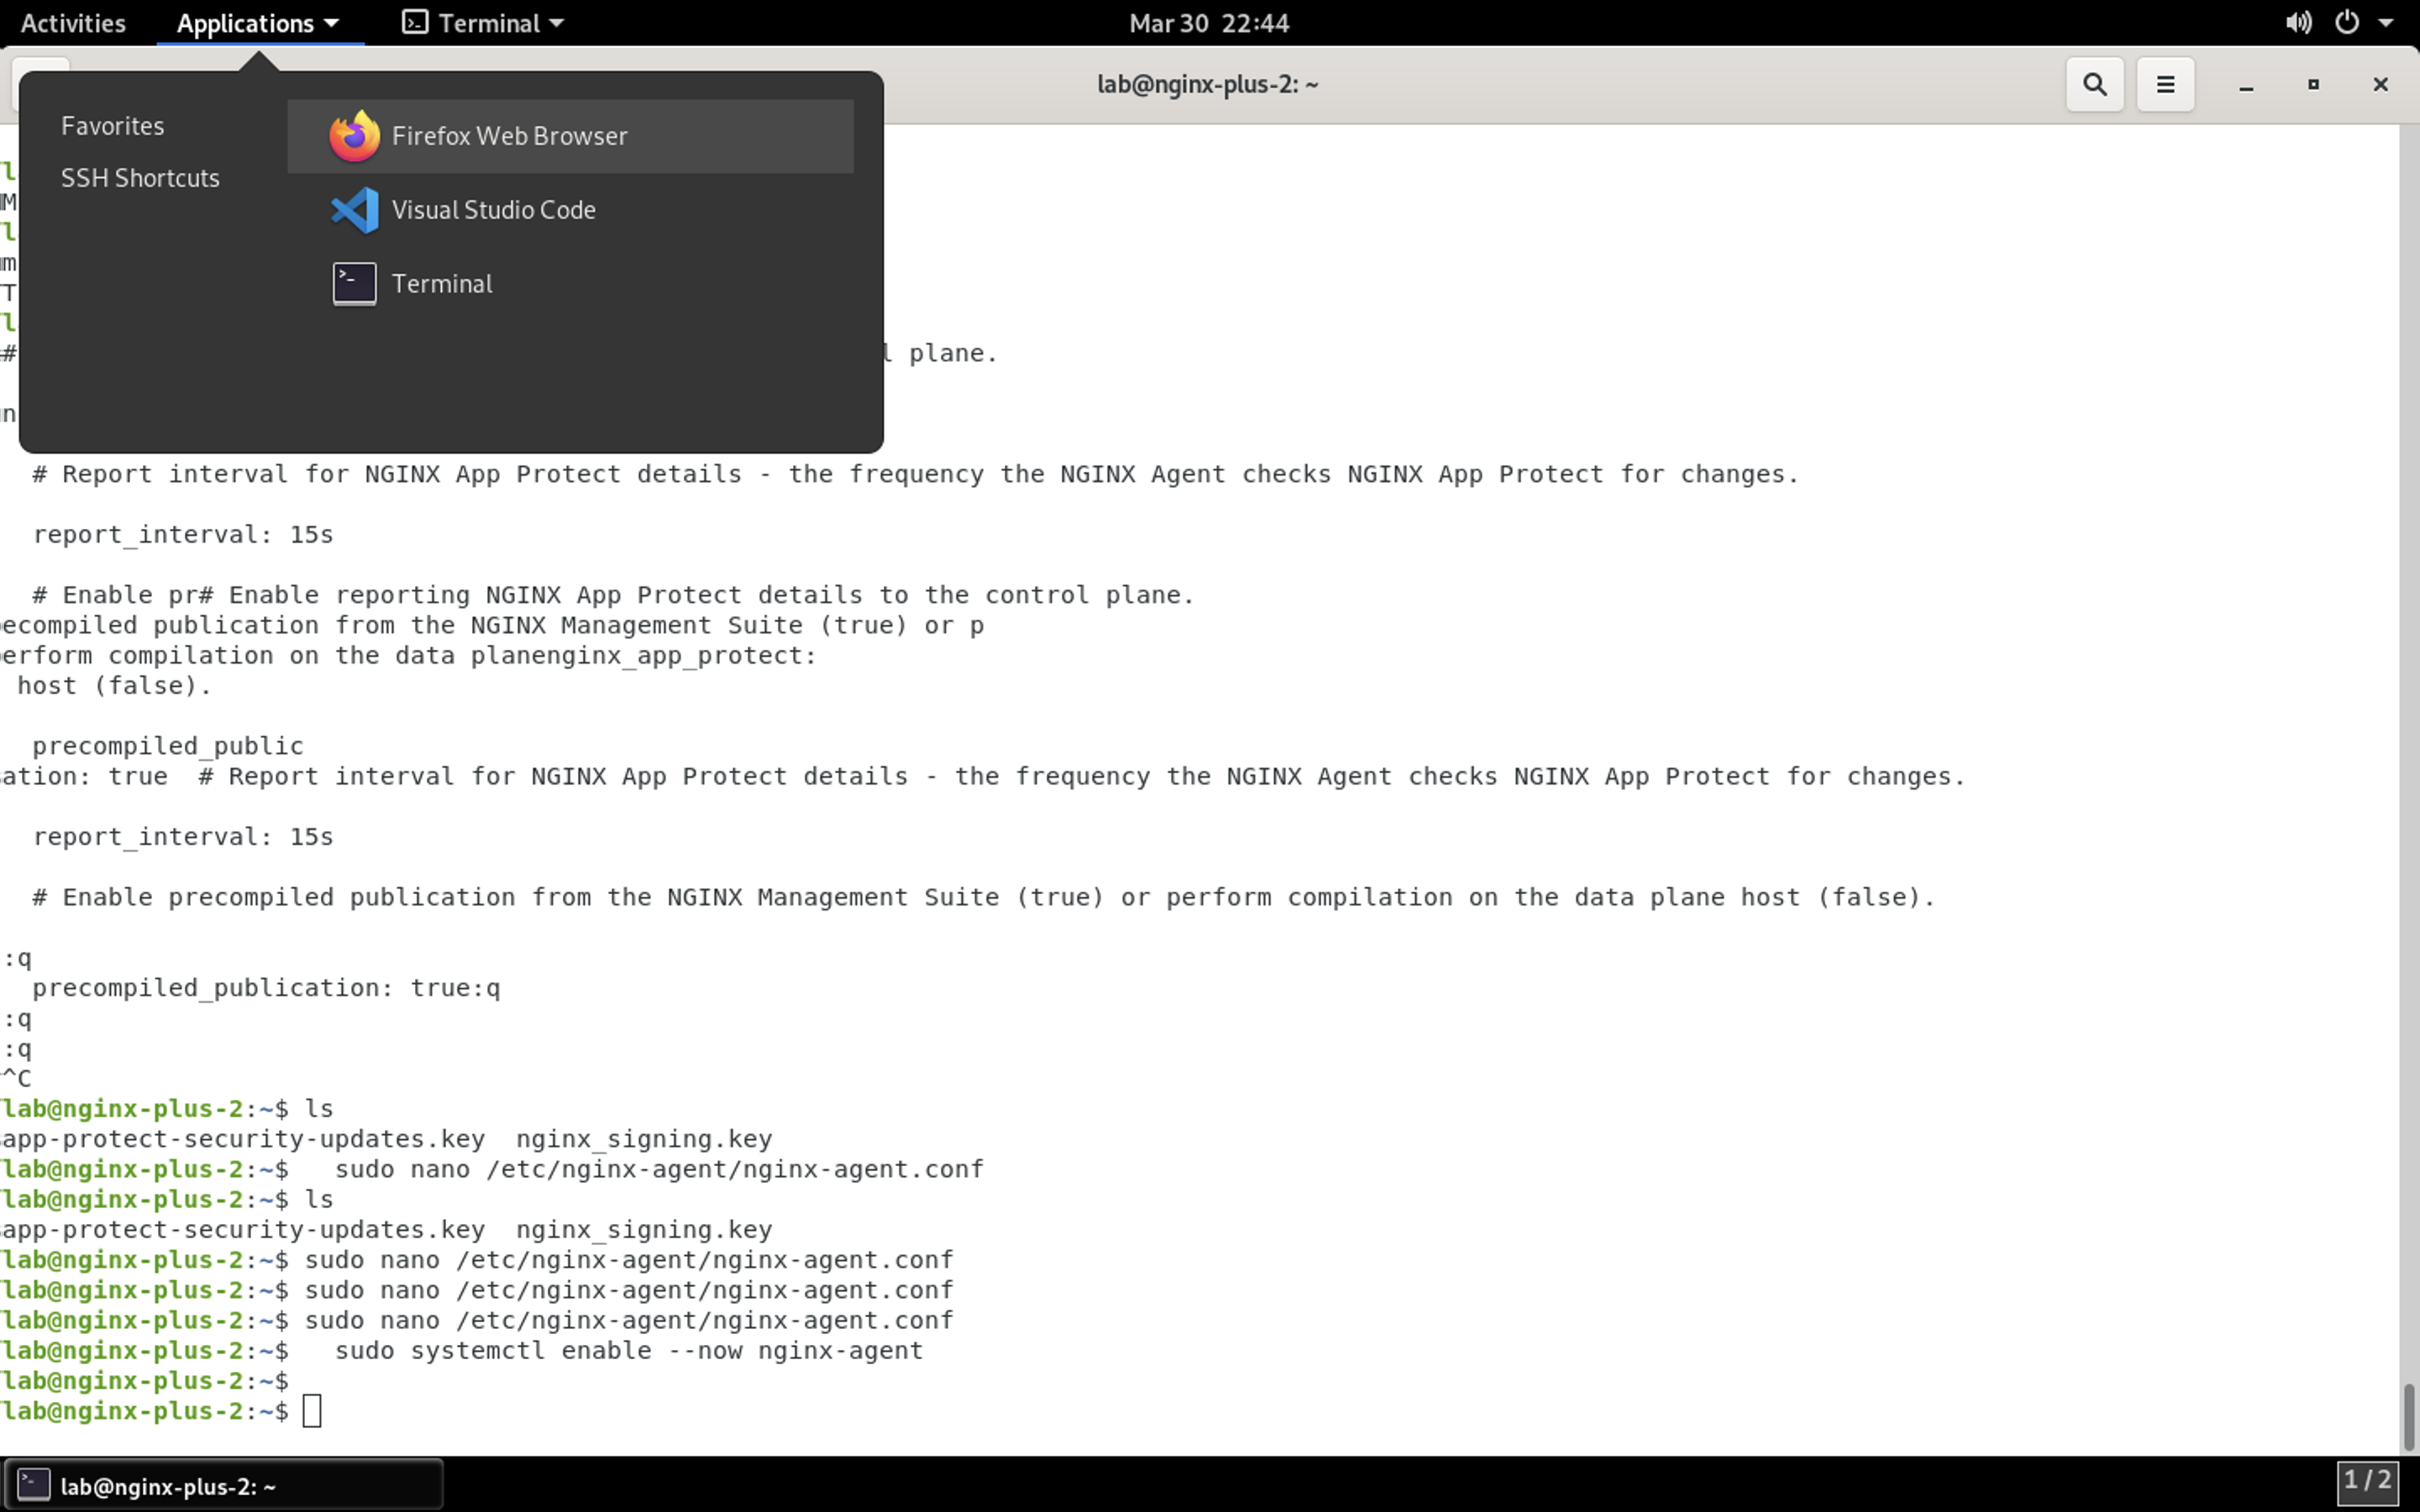
- Switch to Firefox, if already open, or open Firefox by selecting Applications > Favorites > Firefox from the top menu bar.
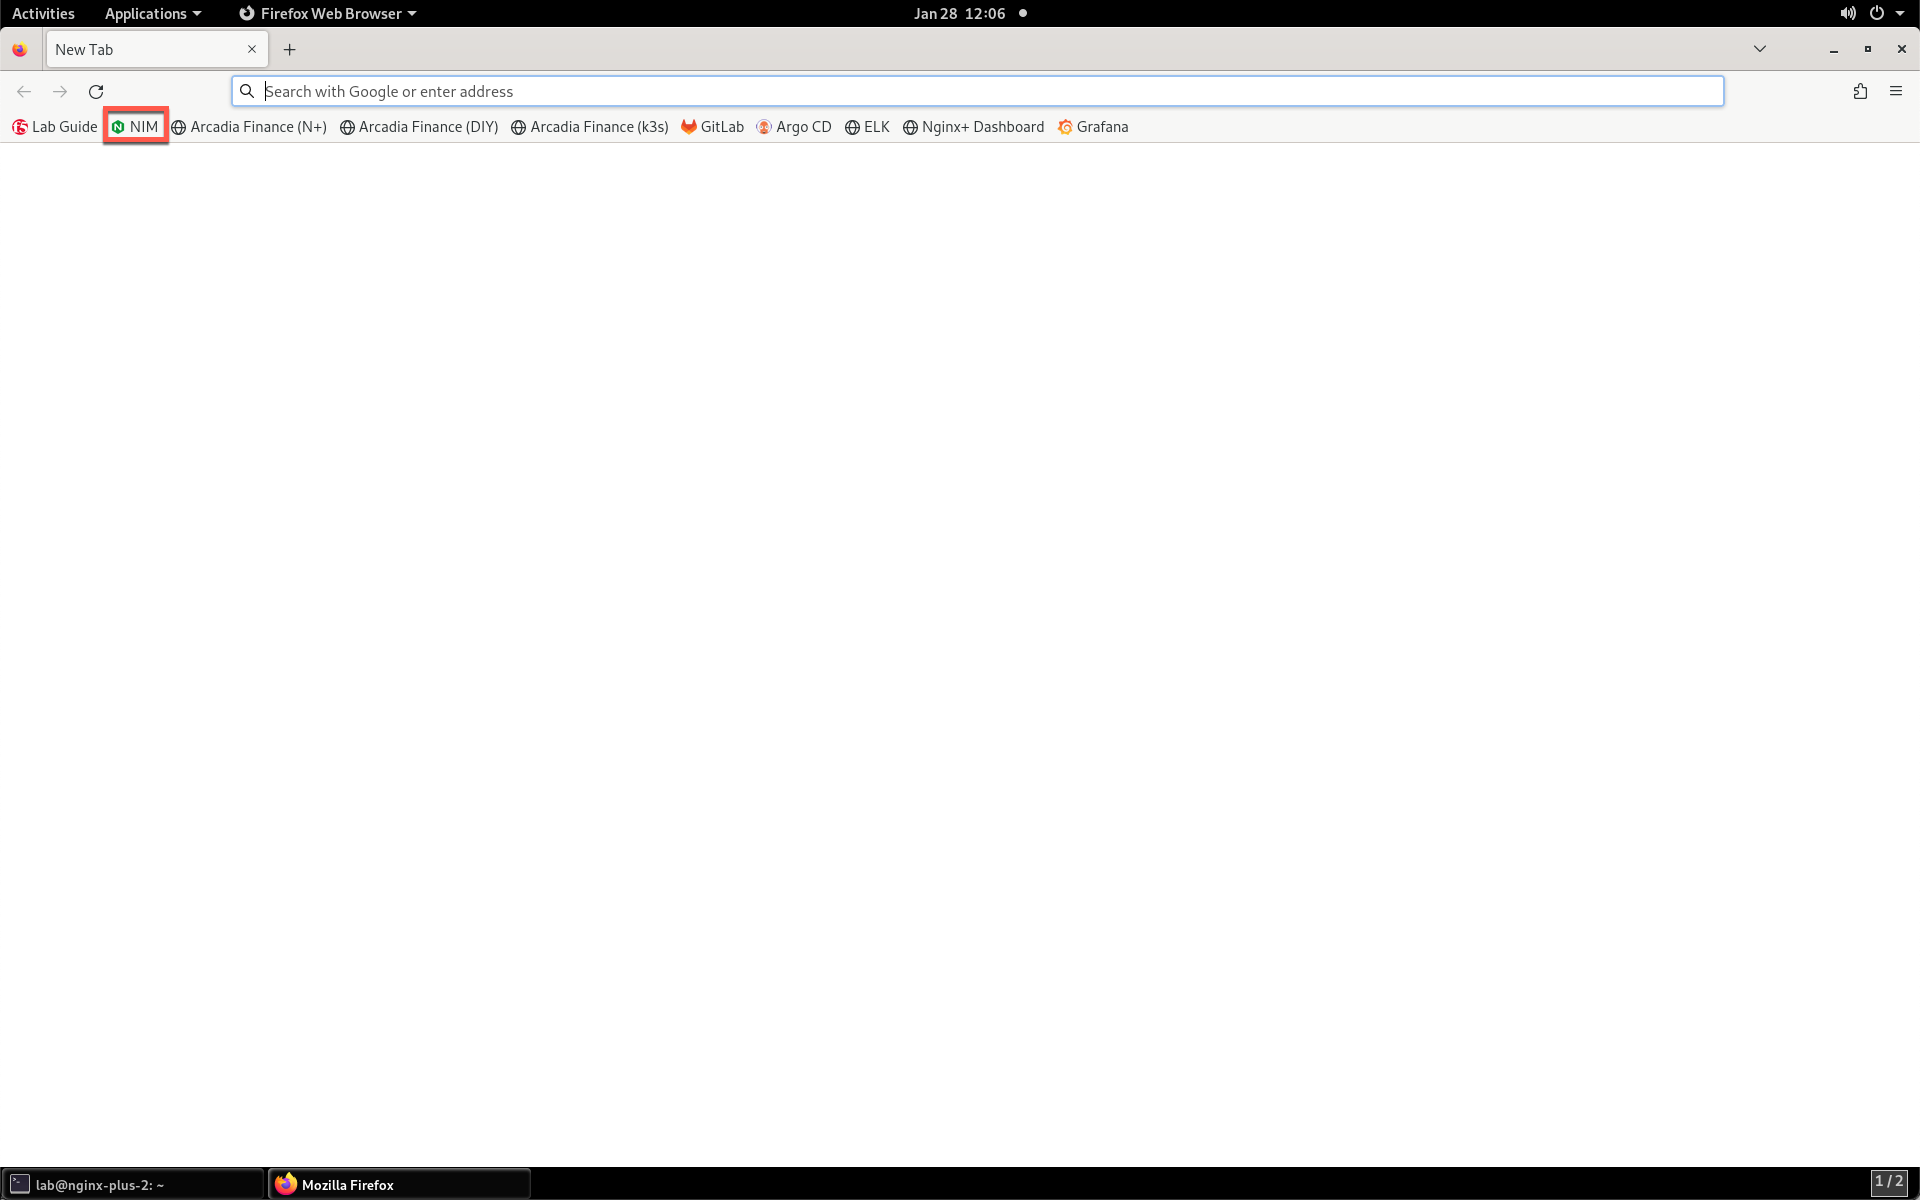
- Click the NIM bookmark or navigate to https://nginx-instance-manager.appworld.lab/ui/.
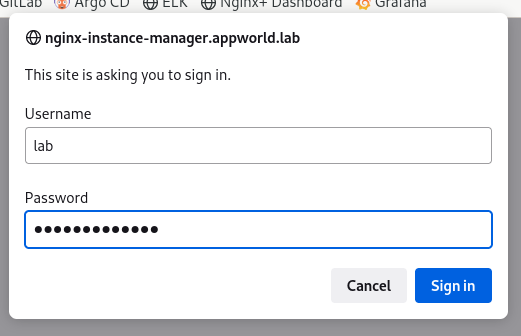
- Log in using the lab / AppWorld2024! credentials.
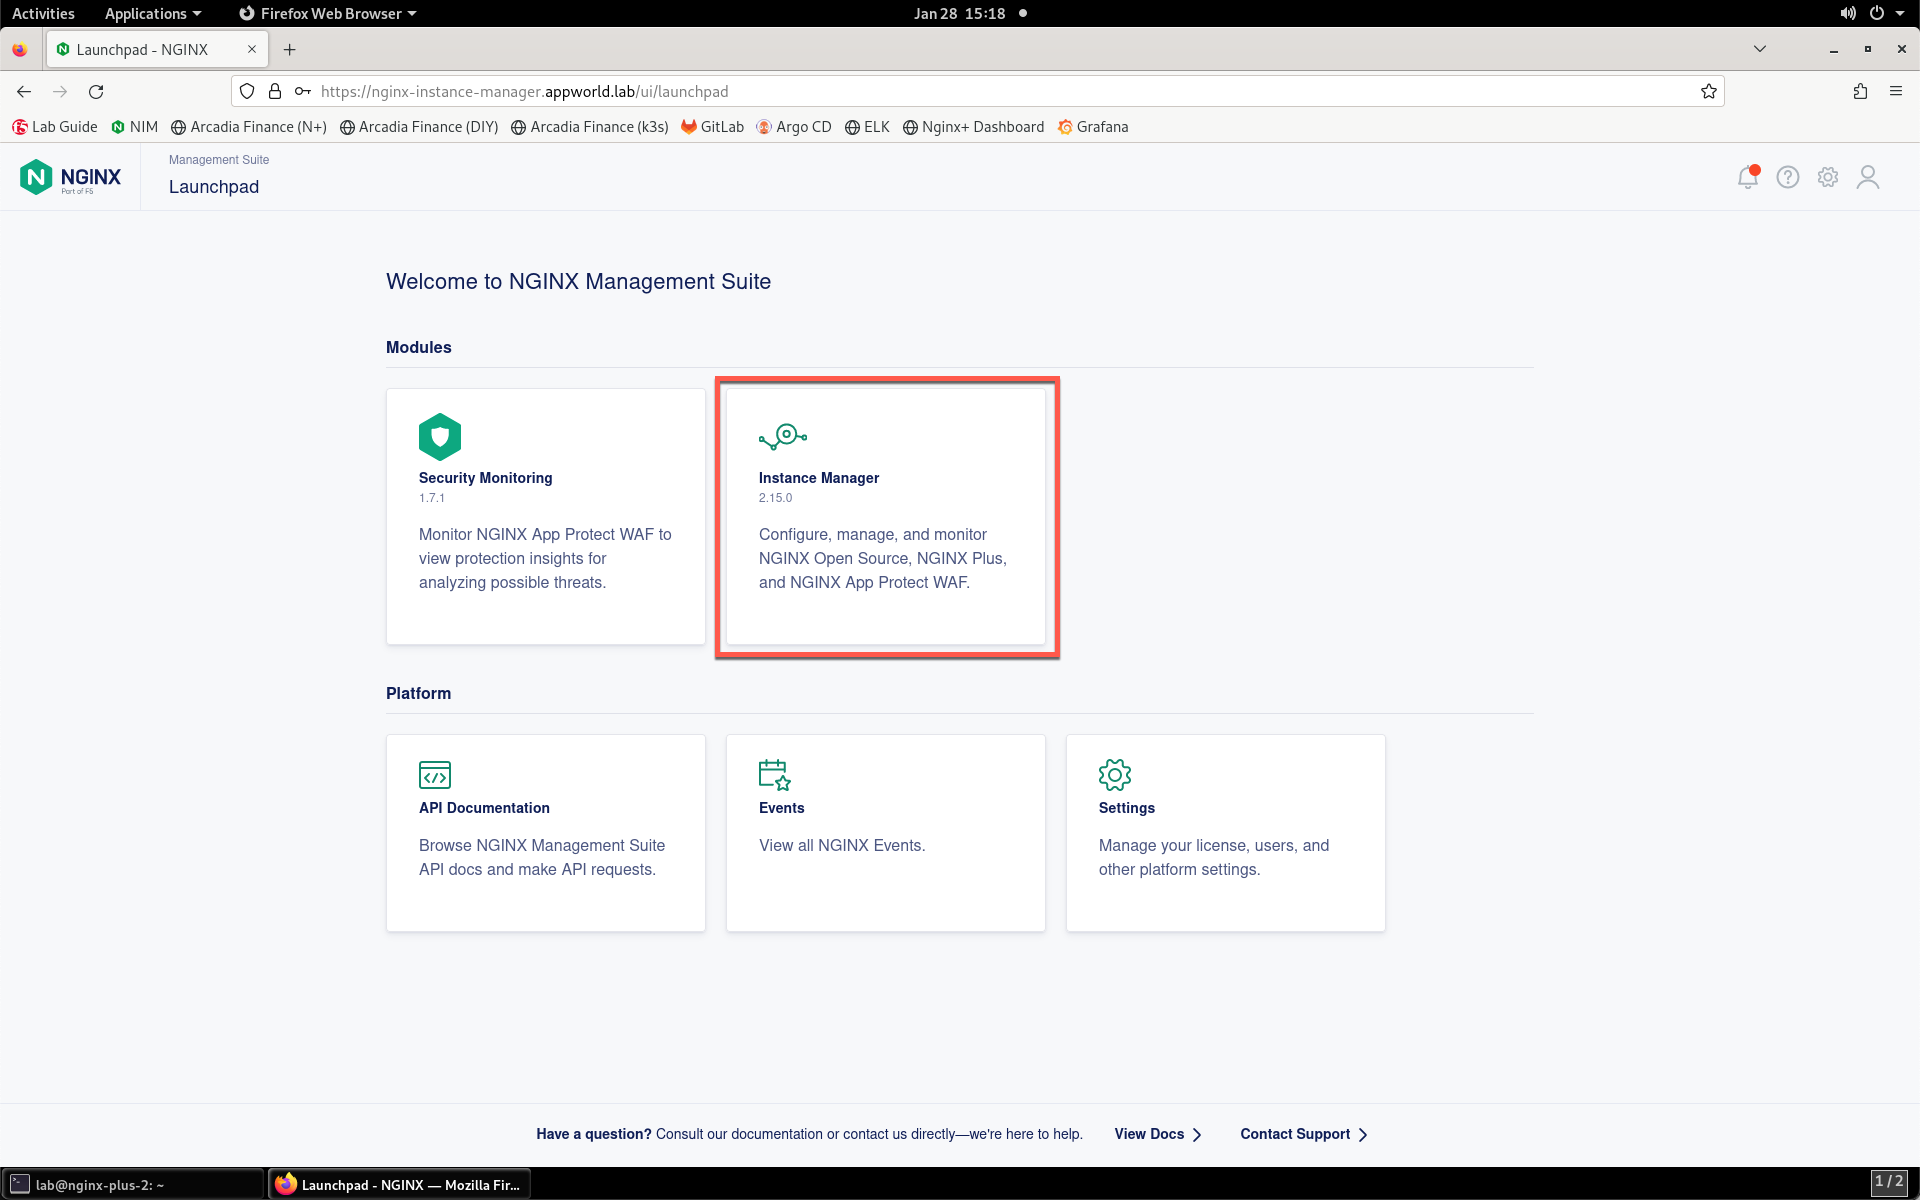
- Click on the Instance Manager tile to launch NIM.
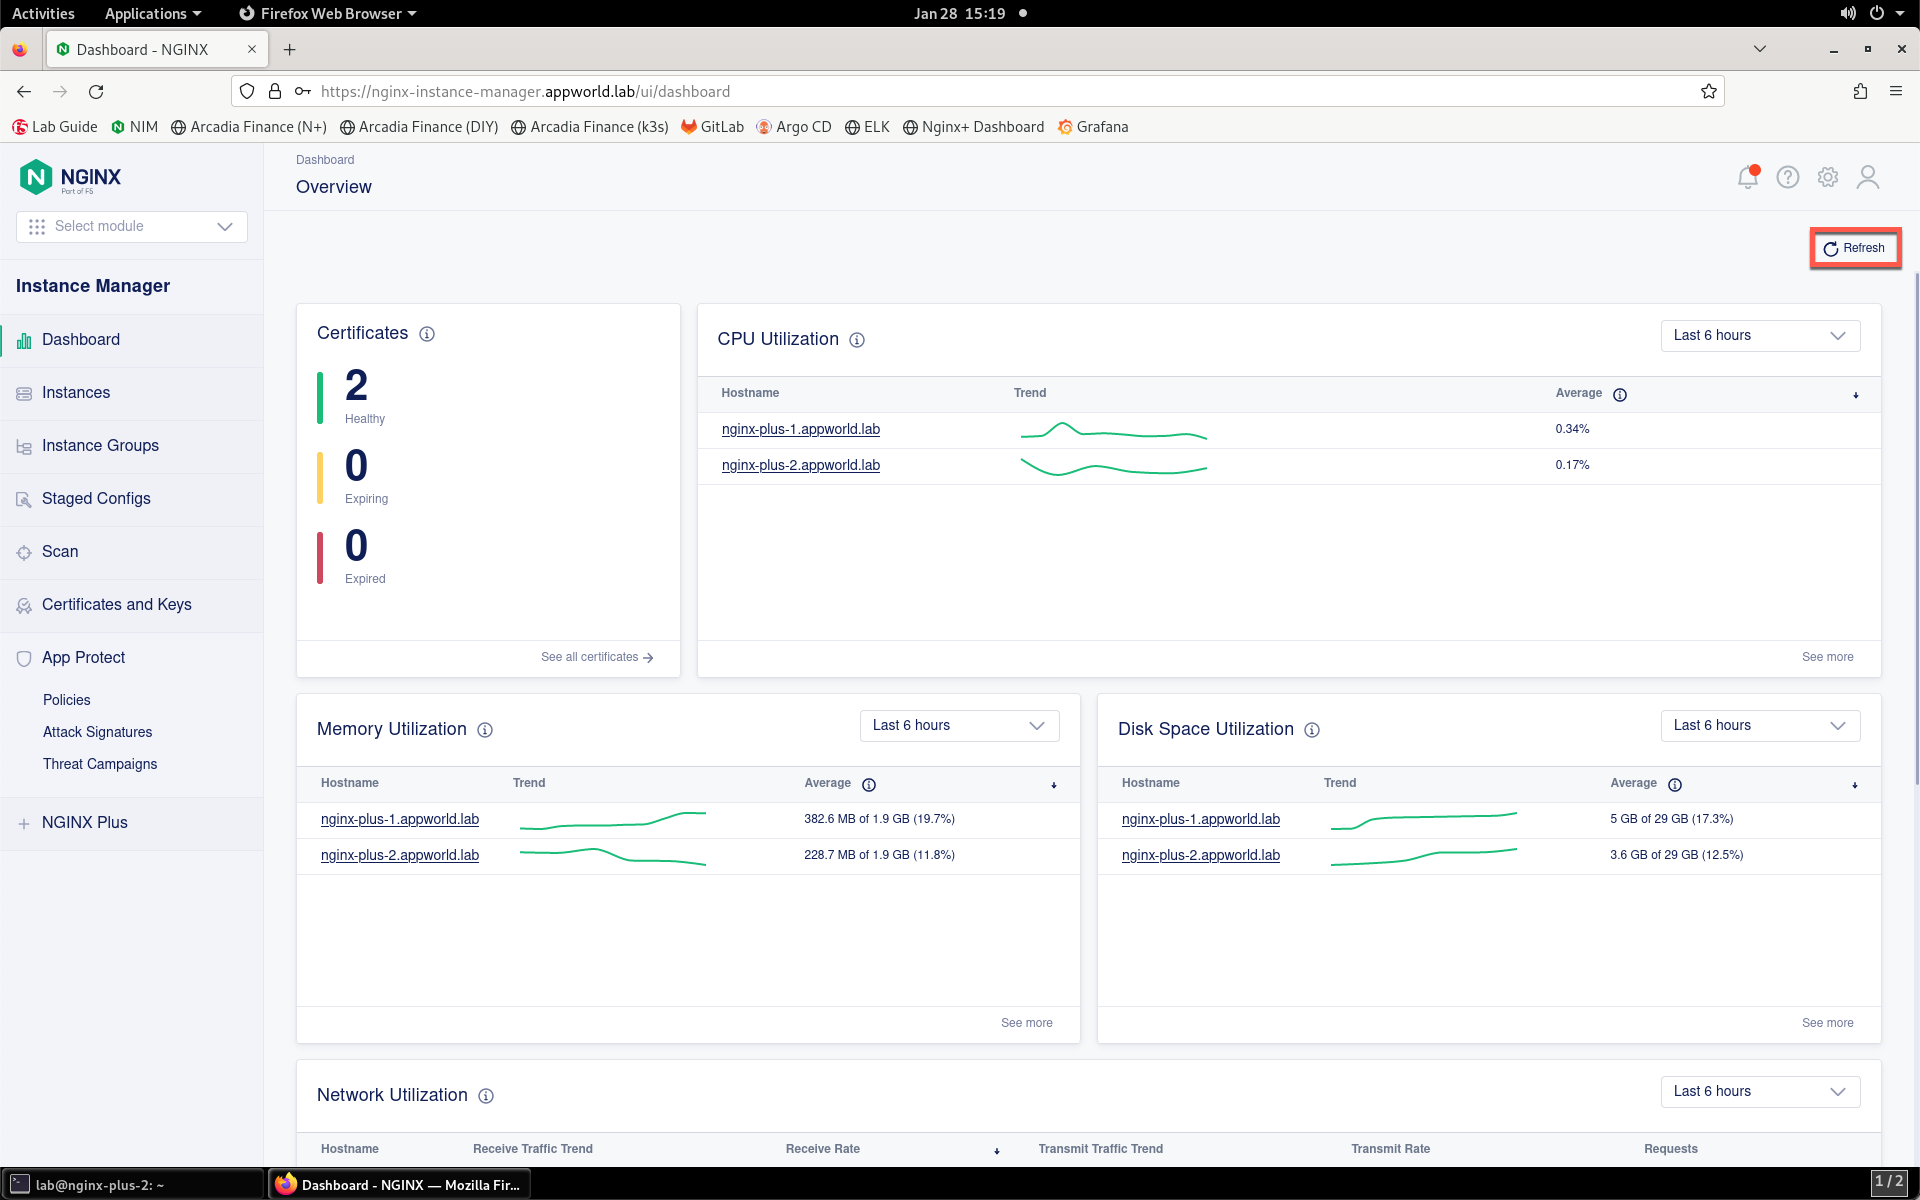
- You should now see second instance in the list. Click Refresh in the toolbar if you do not see the new instance.
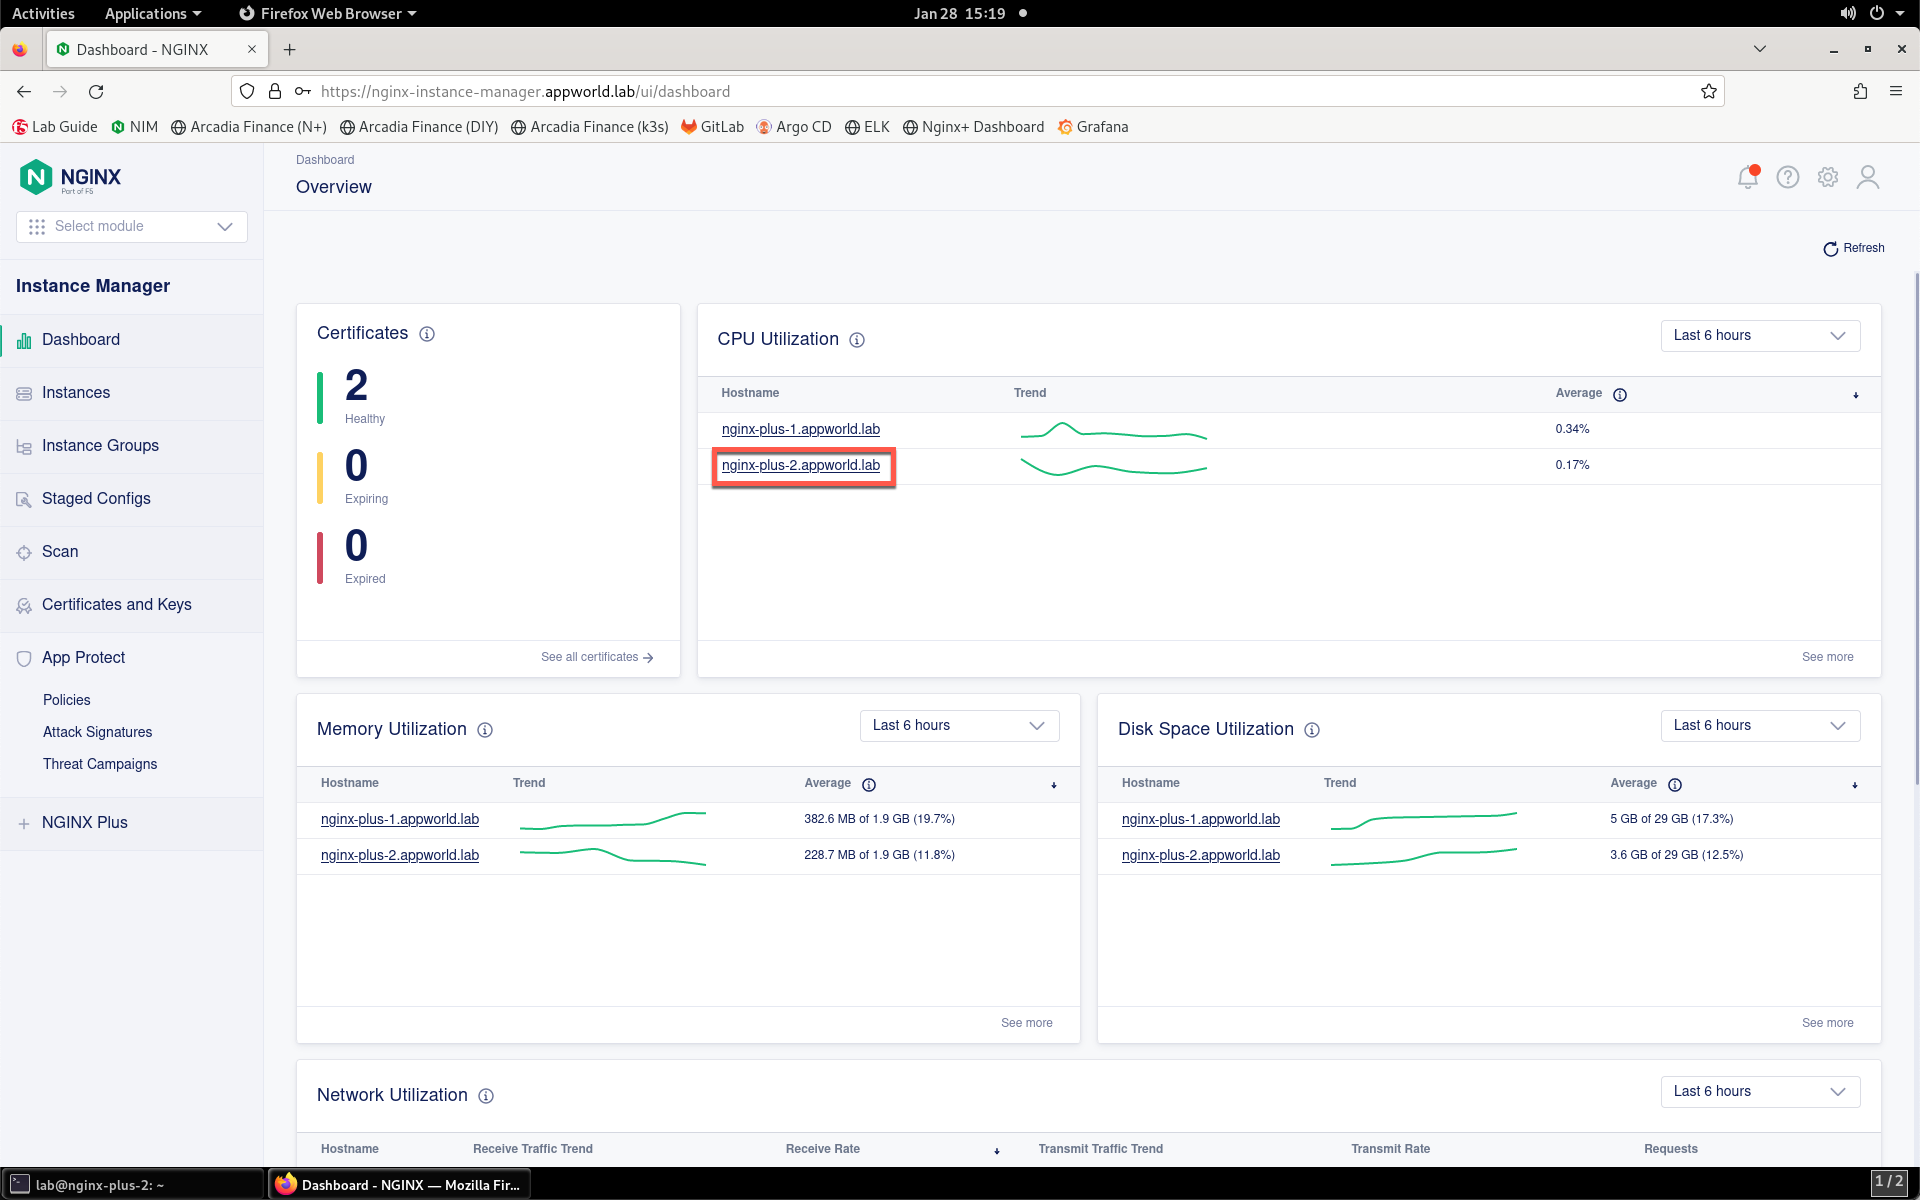
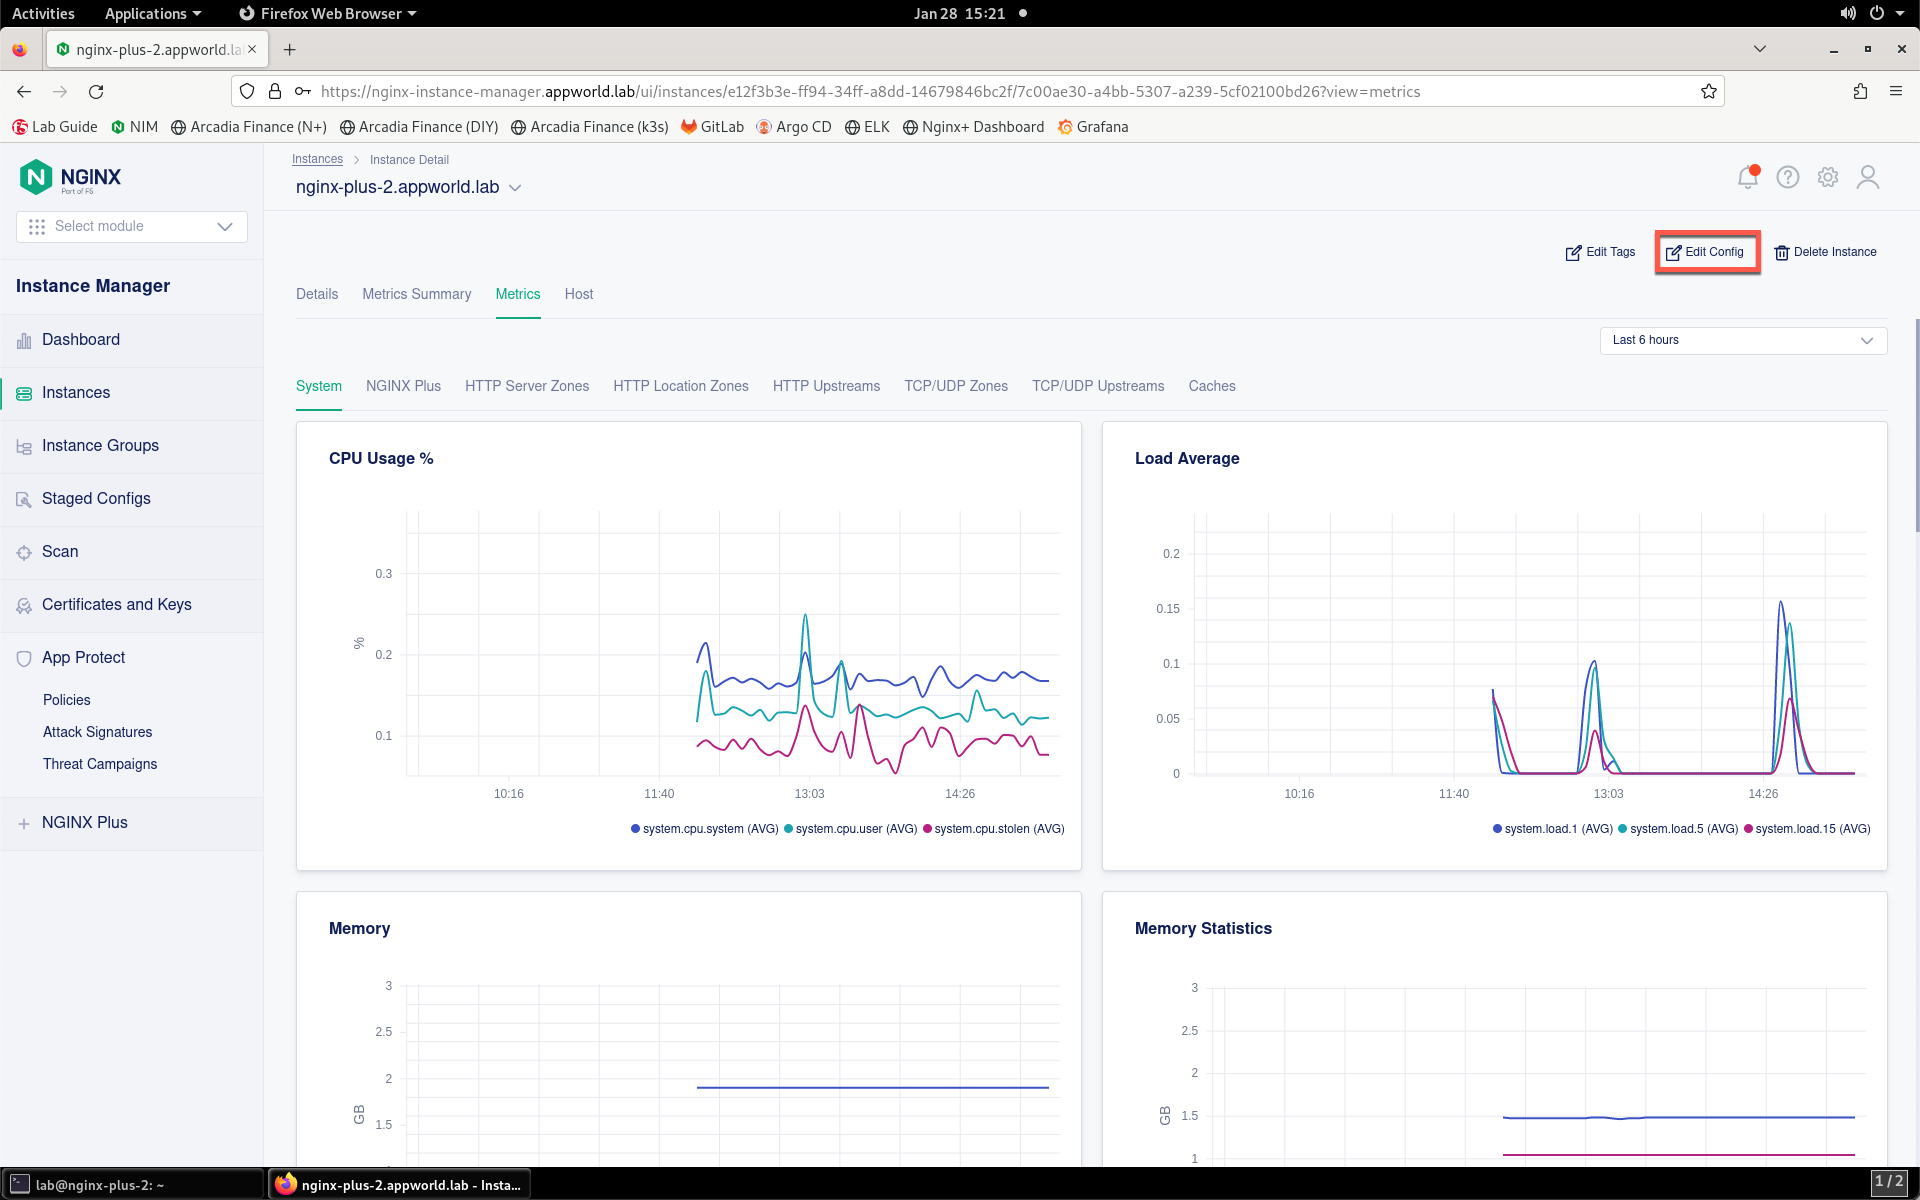
- Click the nginx-plus-2.appworld.lab instance in the list.
- Click the Edit Config button.
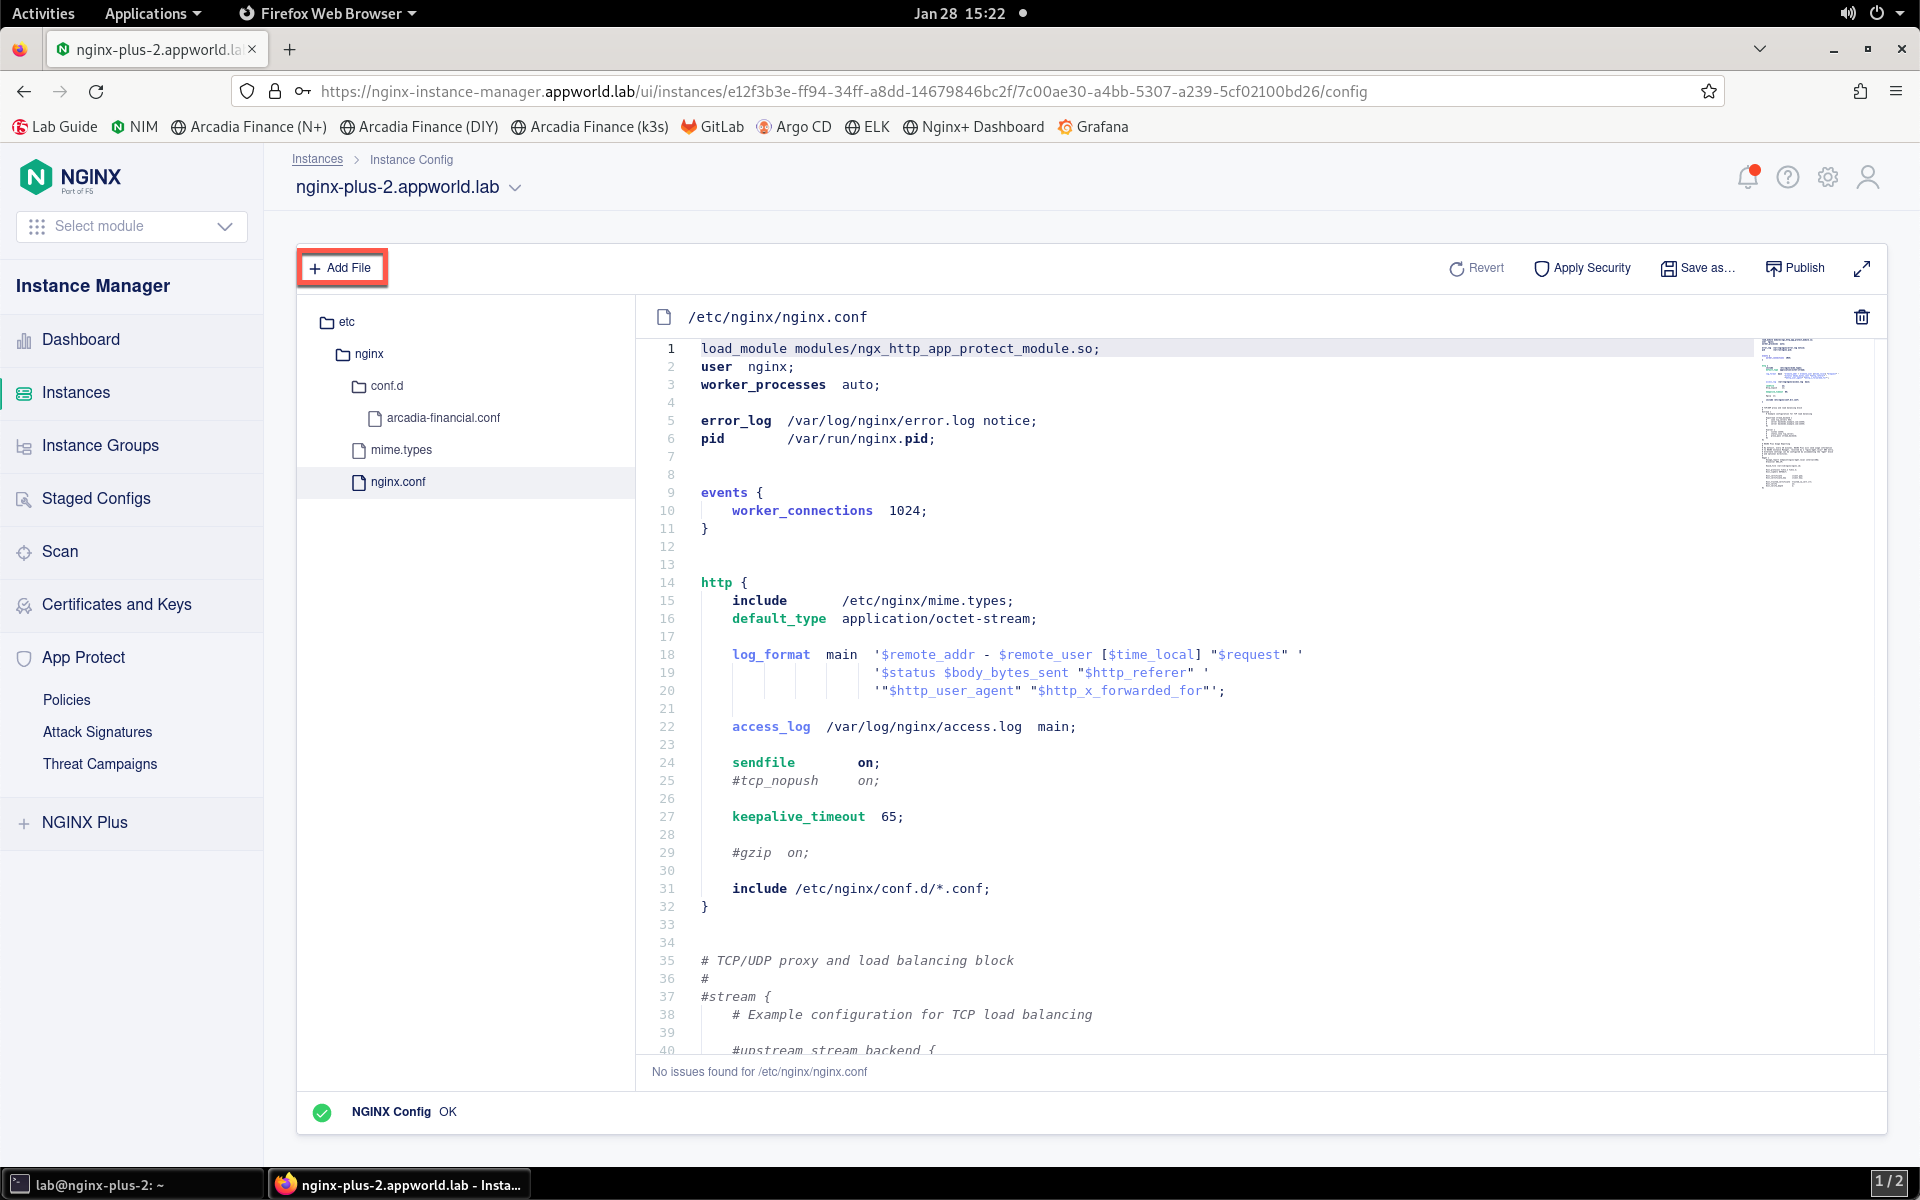
- Click on Add File button in the navigation pane.
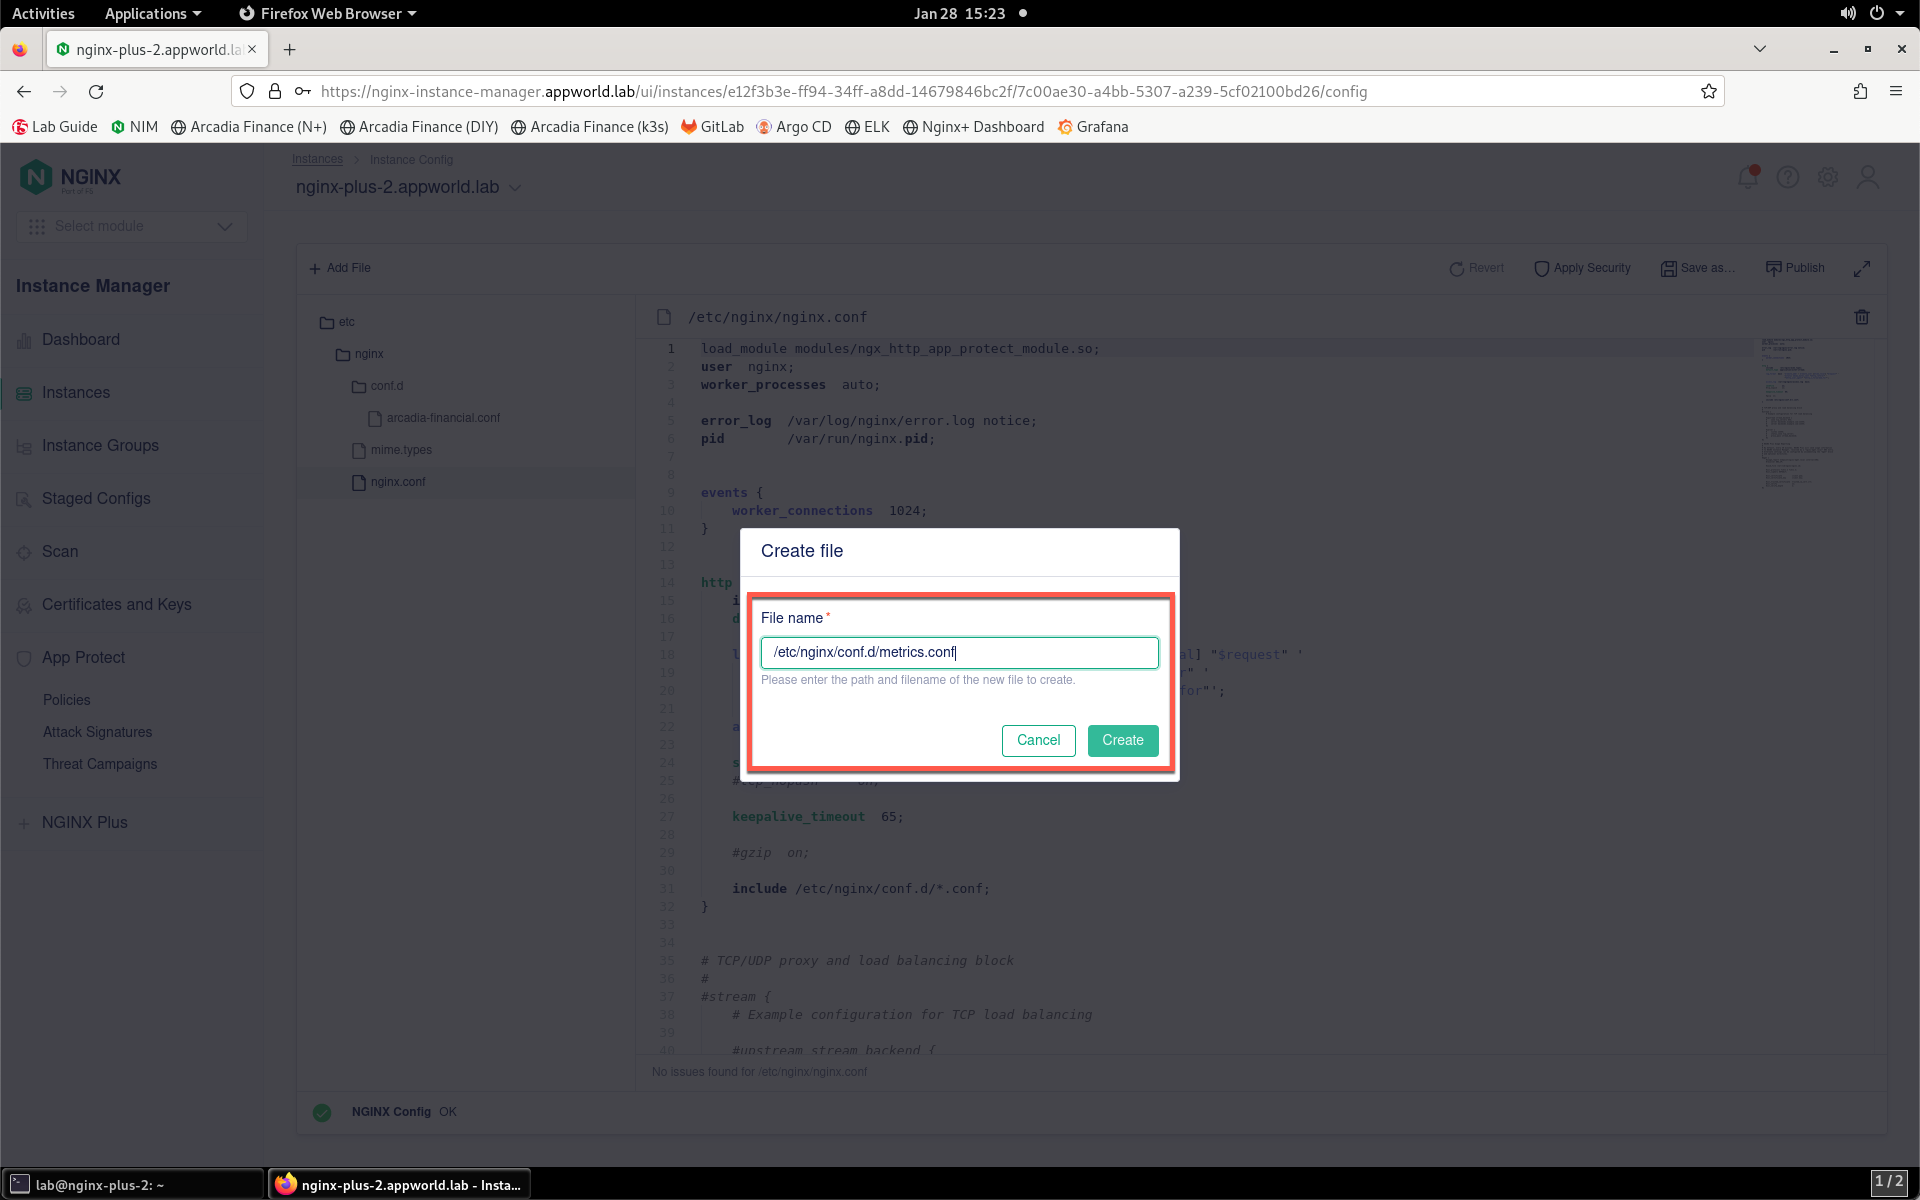
- Provide the filename /etc/nginx/conf.d/metrics.conf. Click Create.
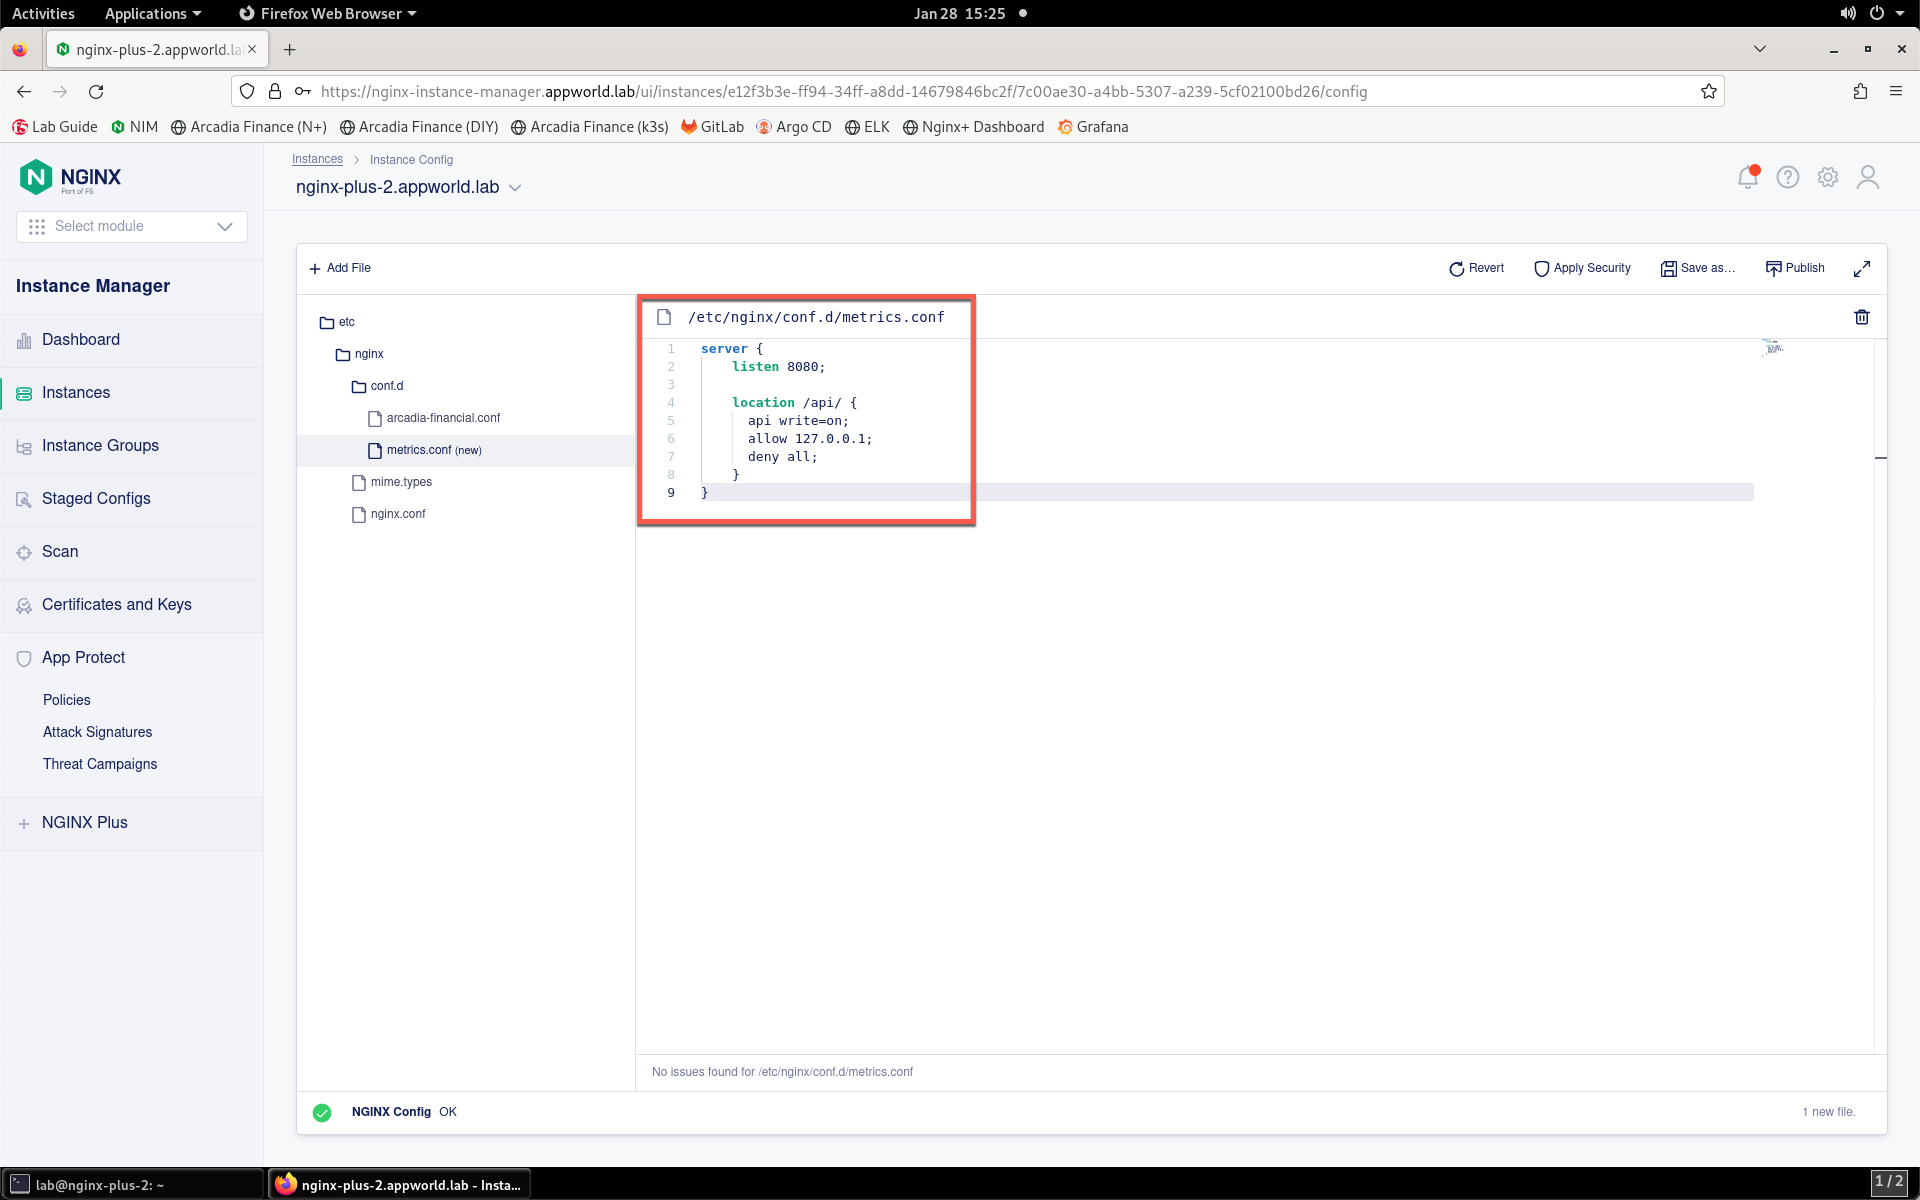
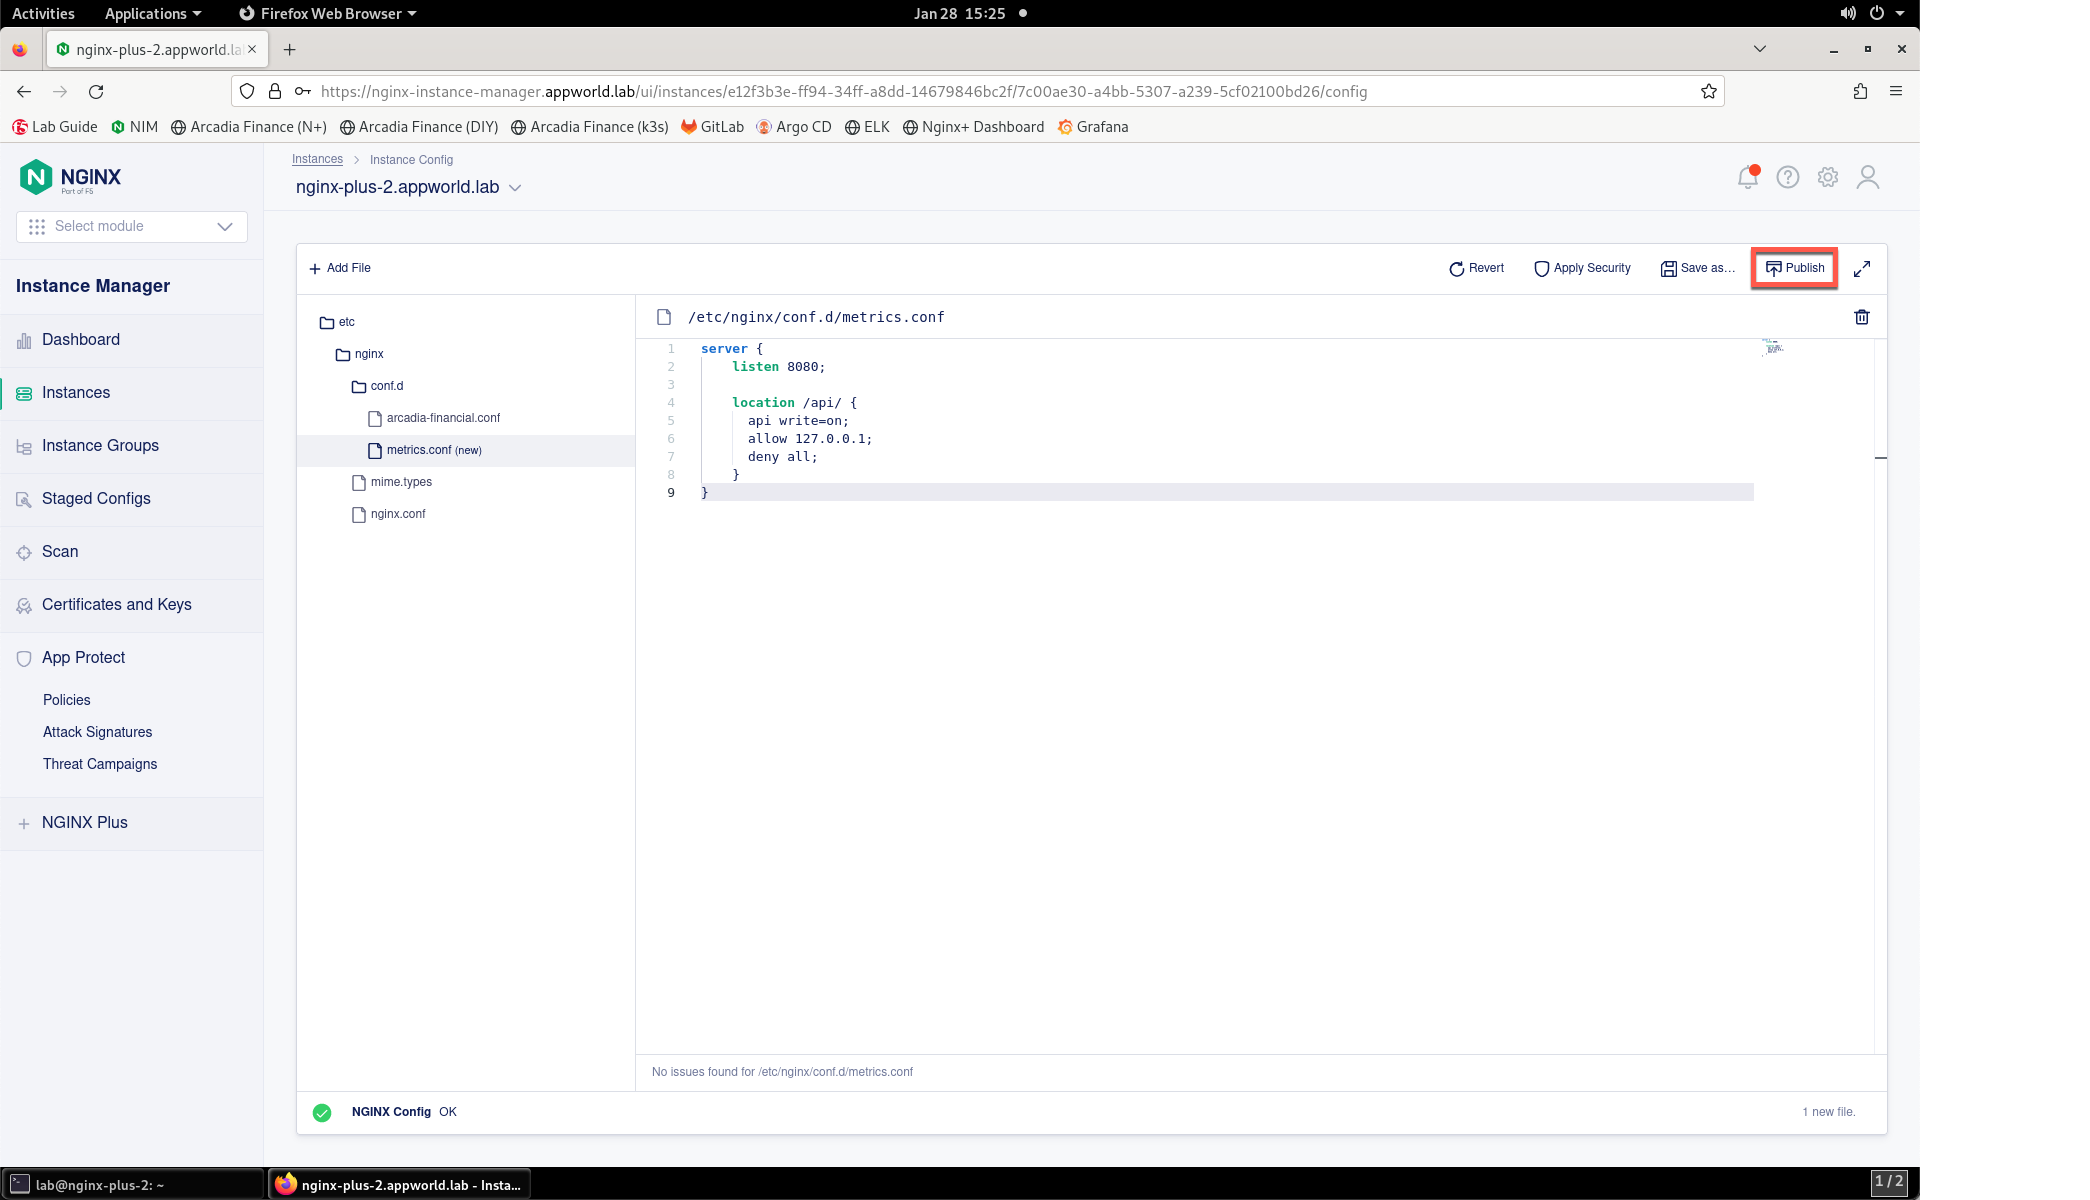
- Paste the following configuration into the editor using CTRL + V:
server {
    listen 8080;

    location /api/ {
      api write=on;
      allow 127.0.0.1;
      deny all;
    }
}
Result
- Click the Publish button.
- Click Publish when presented with the confirmation prompt.
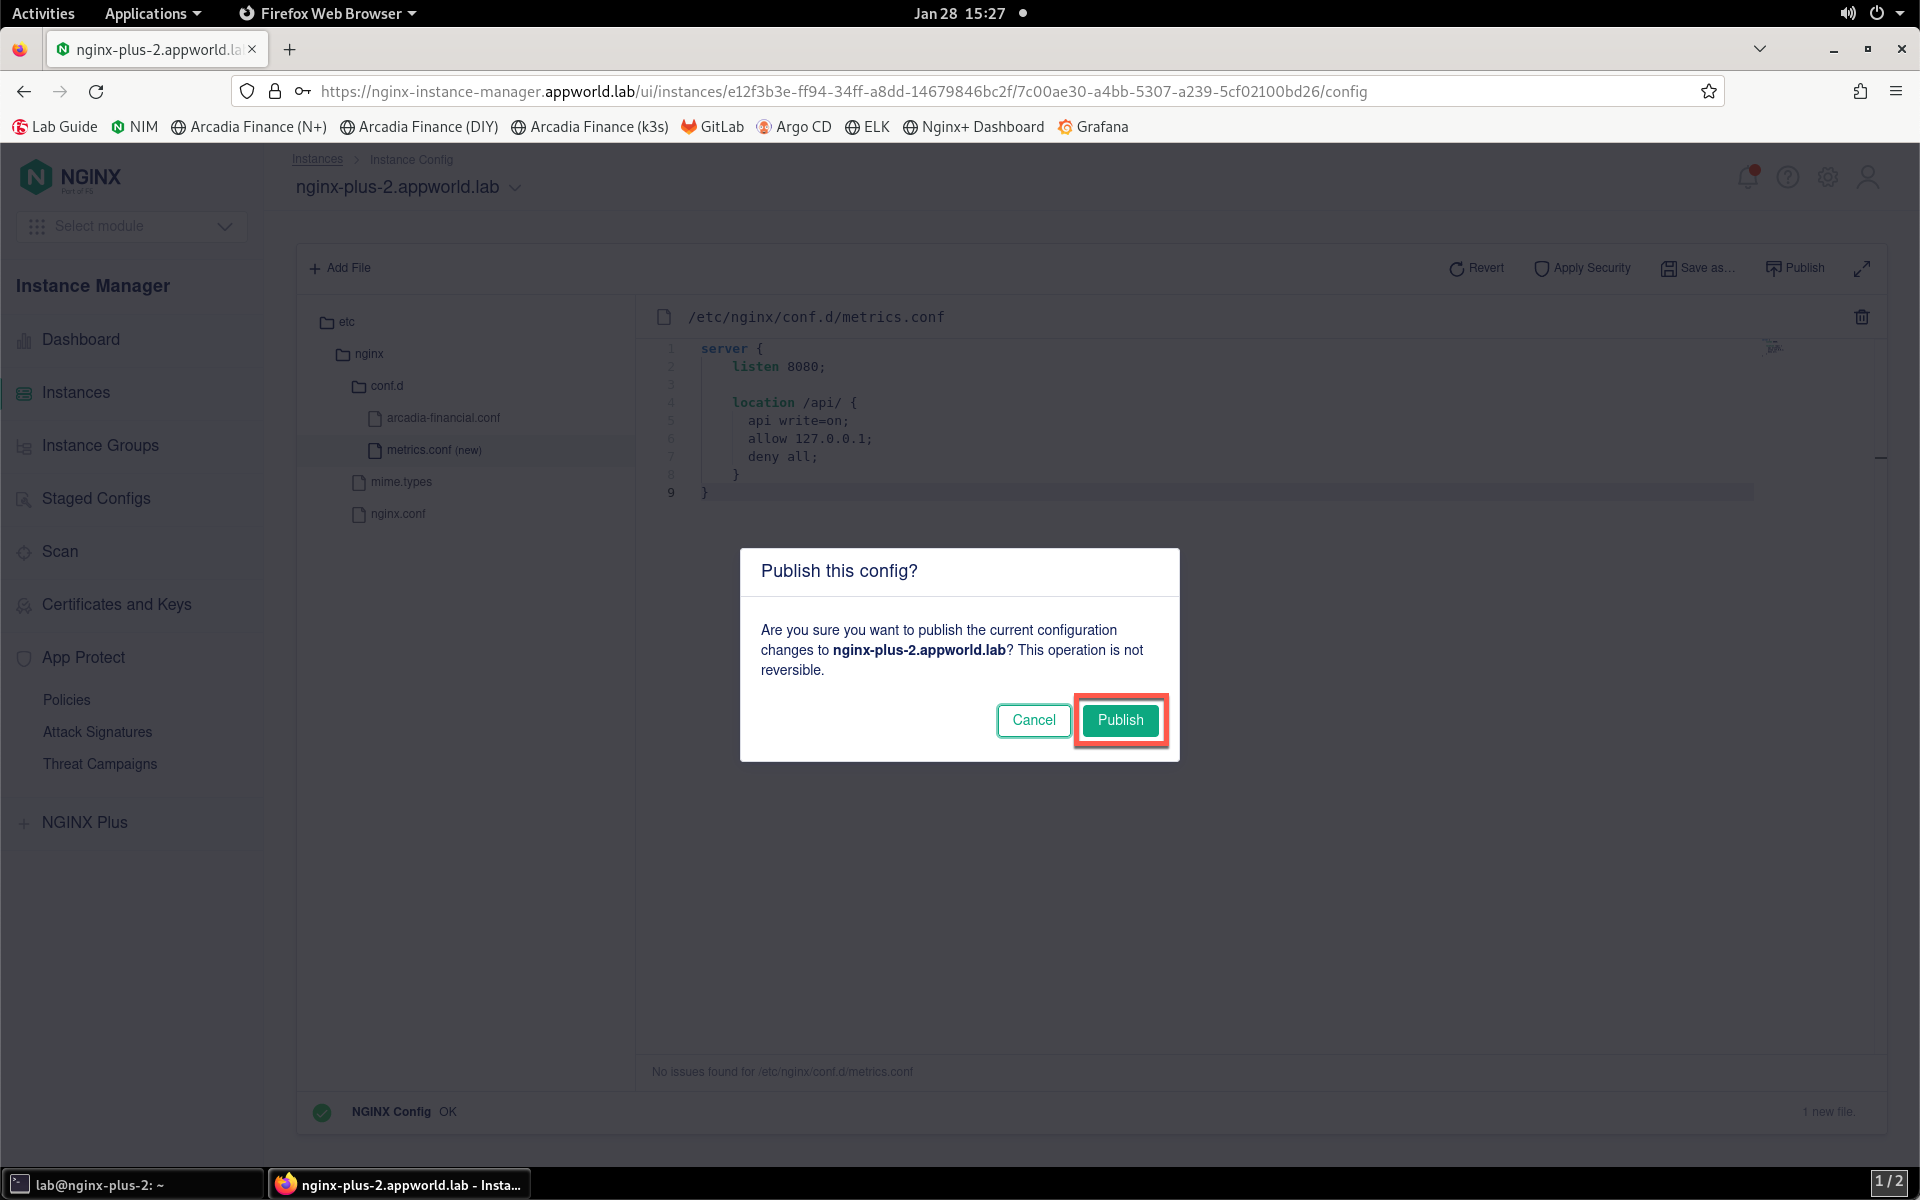
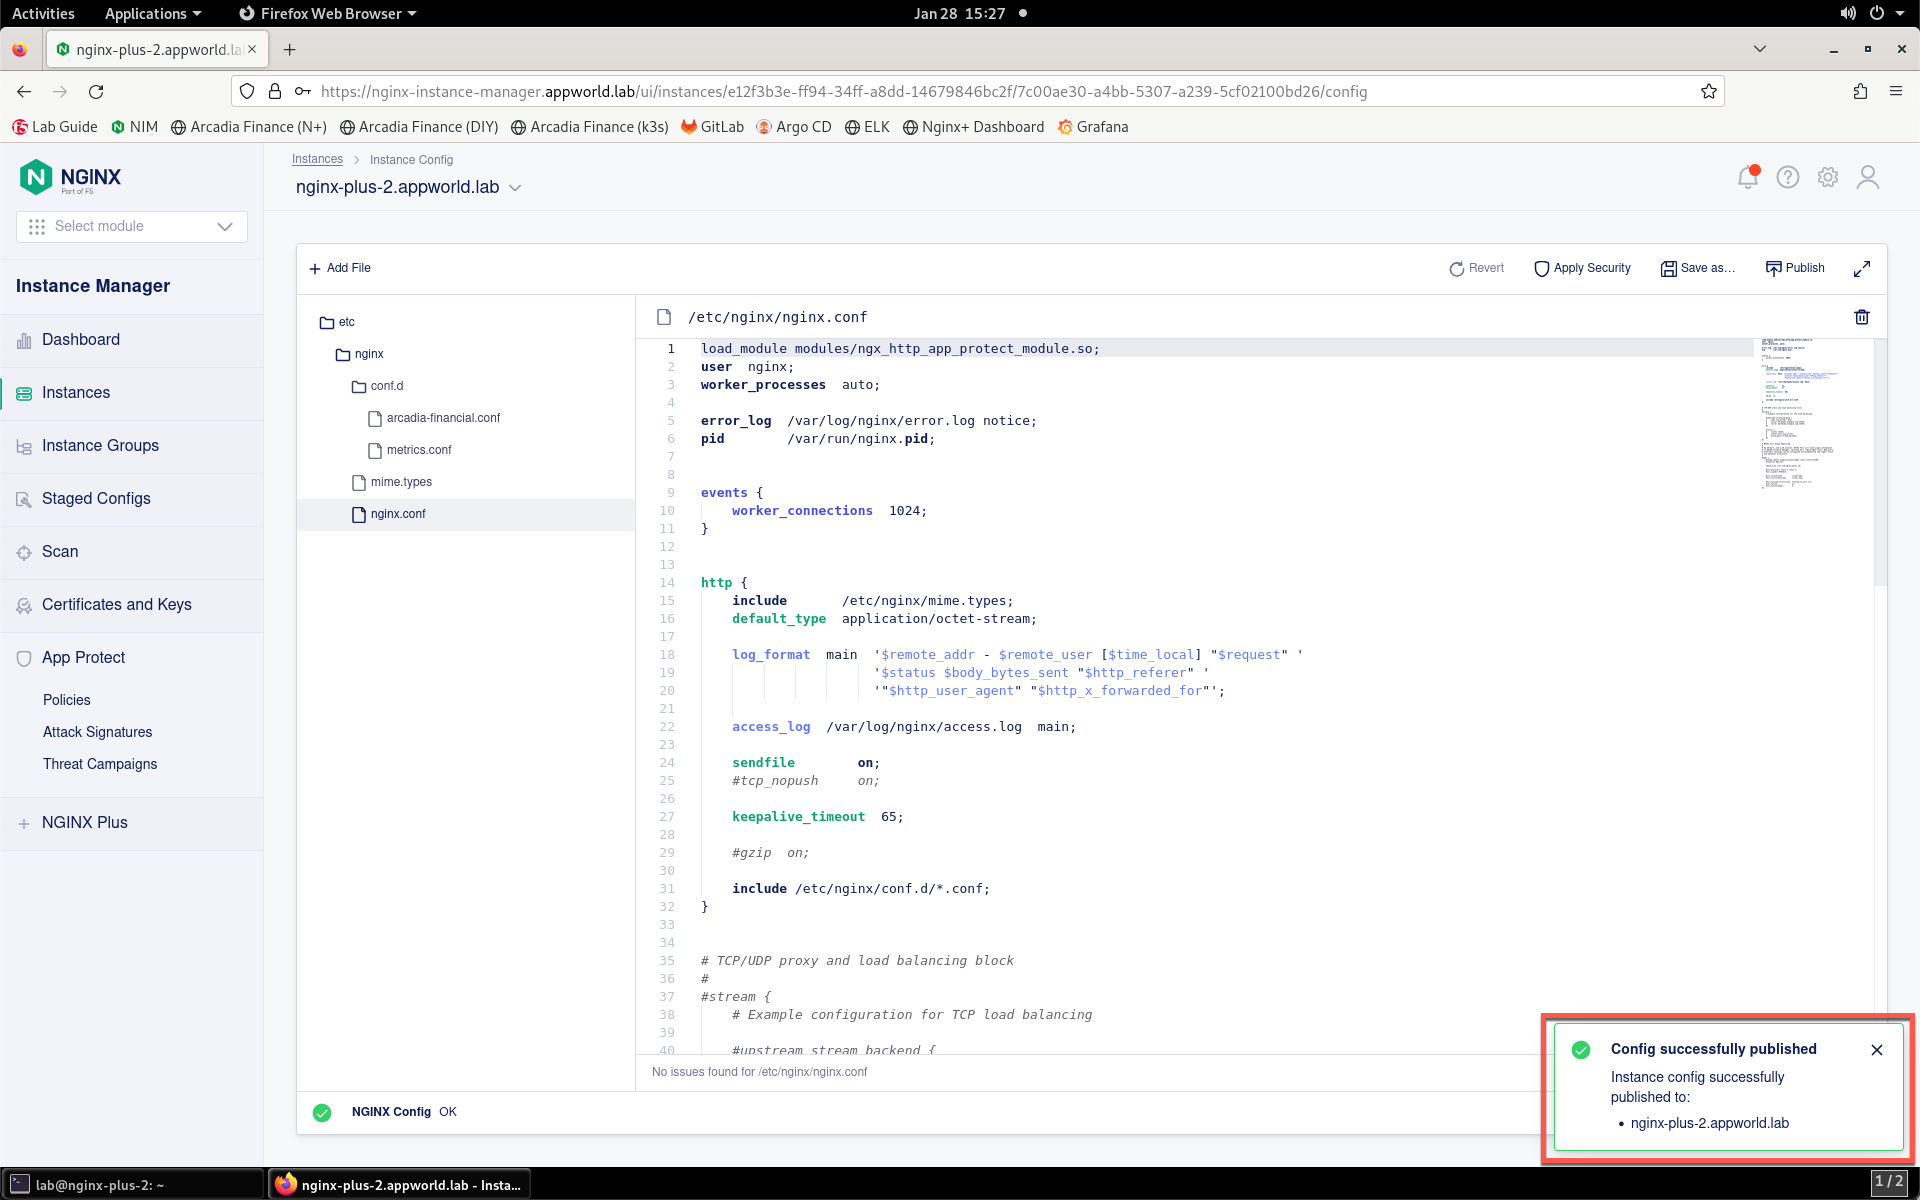
- You will see the Published notification shortly after.
- Return to the SSH terminal to the NGINX Plus 2 instance. Restart NGINX:
sudo nginx -s reload
- Restart the NGINX Agent
To start the NGINX Agent on systemd systems, run the following command:
sudo systemctl restart nginx-agent
- Verifying NGINX Agent is Running and Registered
Run the following command on your data plane to verify that the NGINX Agent process is running:
ps aux | grep nginx-agent
You should see output that looks similar to the following example:

This section of the lab is complete.