NGINX Modern Apps > Class 5 - NGINX App Protect WAF & DoS > Module 3 - Modern Apps NGINX App Protect WAF Deployment Source | Edit on
Install NGINX App Protect on the Arcadia App in Kubernetes
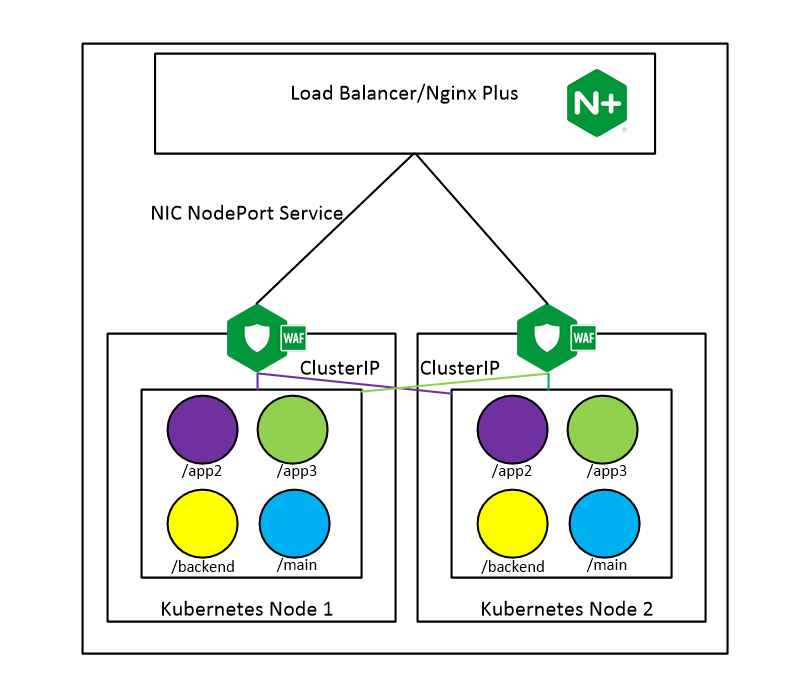
Now, you will deploy the App Protect policy on the Ingress Controller and expose the service via NodePort from the ingress controller. Normally there would be a load balancer in front of the cluster. To save time, the ingress controller has already been deployed. Let’s look at how you’ve deployed the NGINX Plux Ingress Controller via Helm. Navigating to the Gitlab instance under the ks3_infra repository, you find all the infrastructure objects deployed.
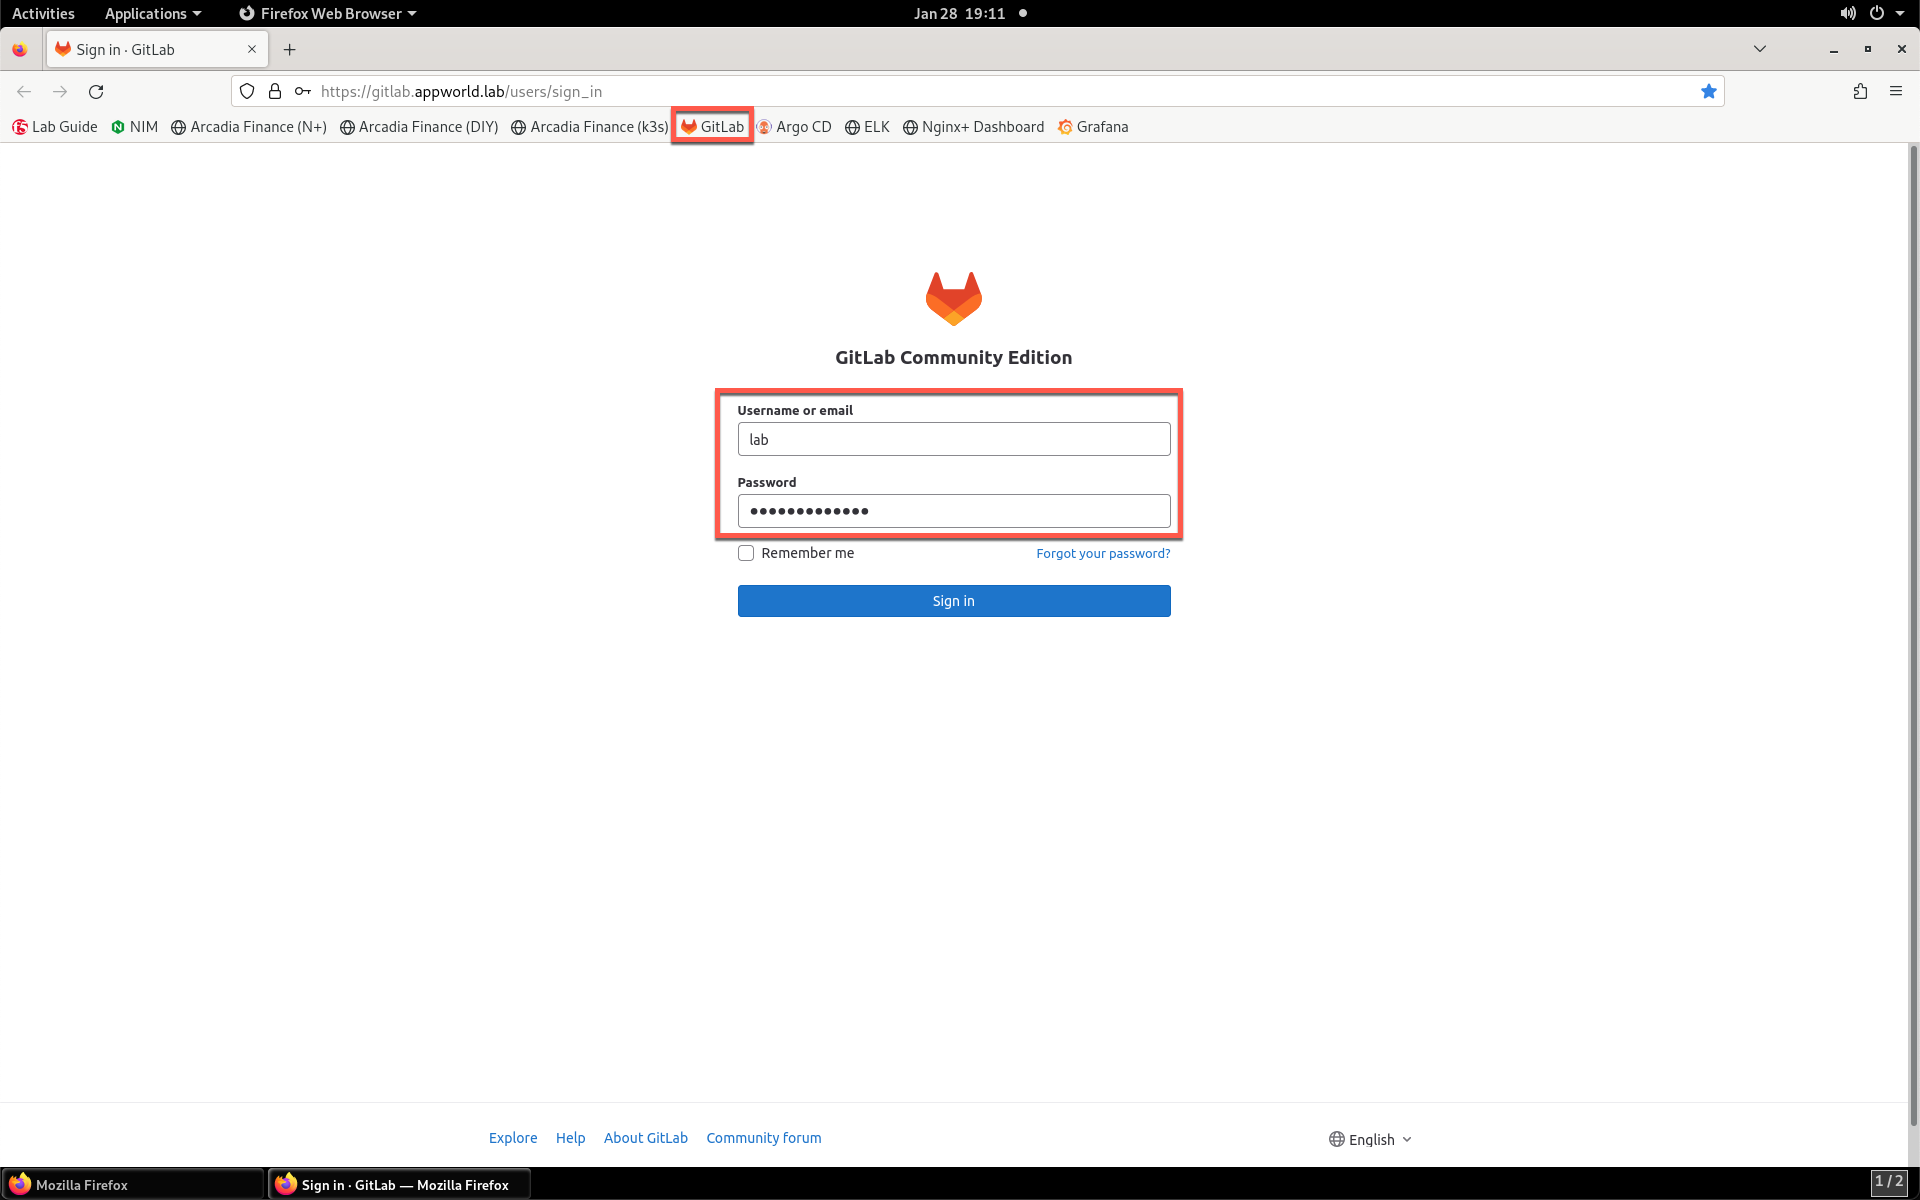
- Launch or return to Firefox. From the bookmark toolbar, select Gitlab. Log into the site using the username lab and password AppWorld2024! credentials.
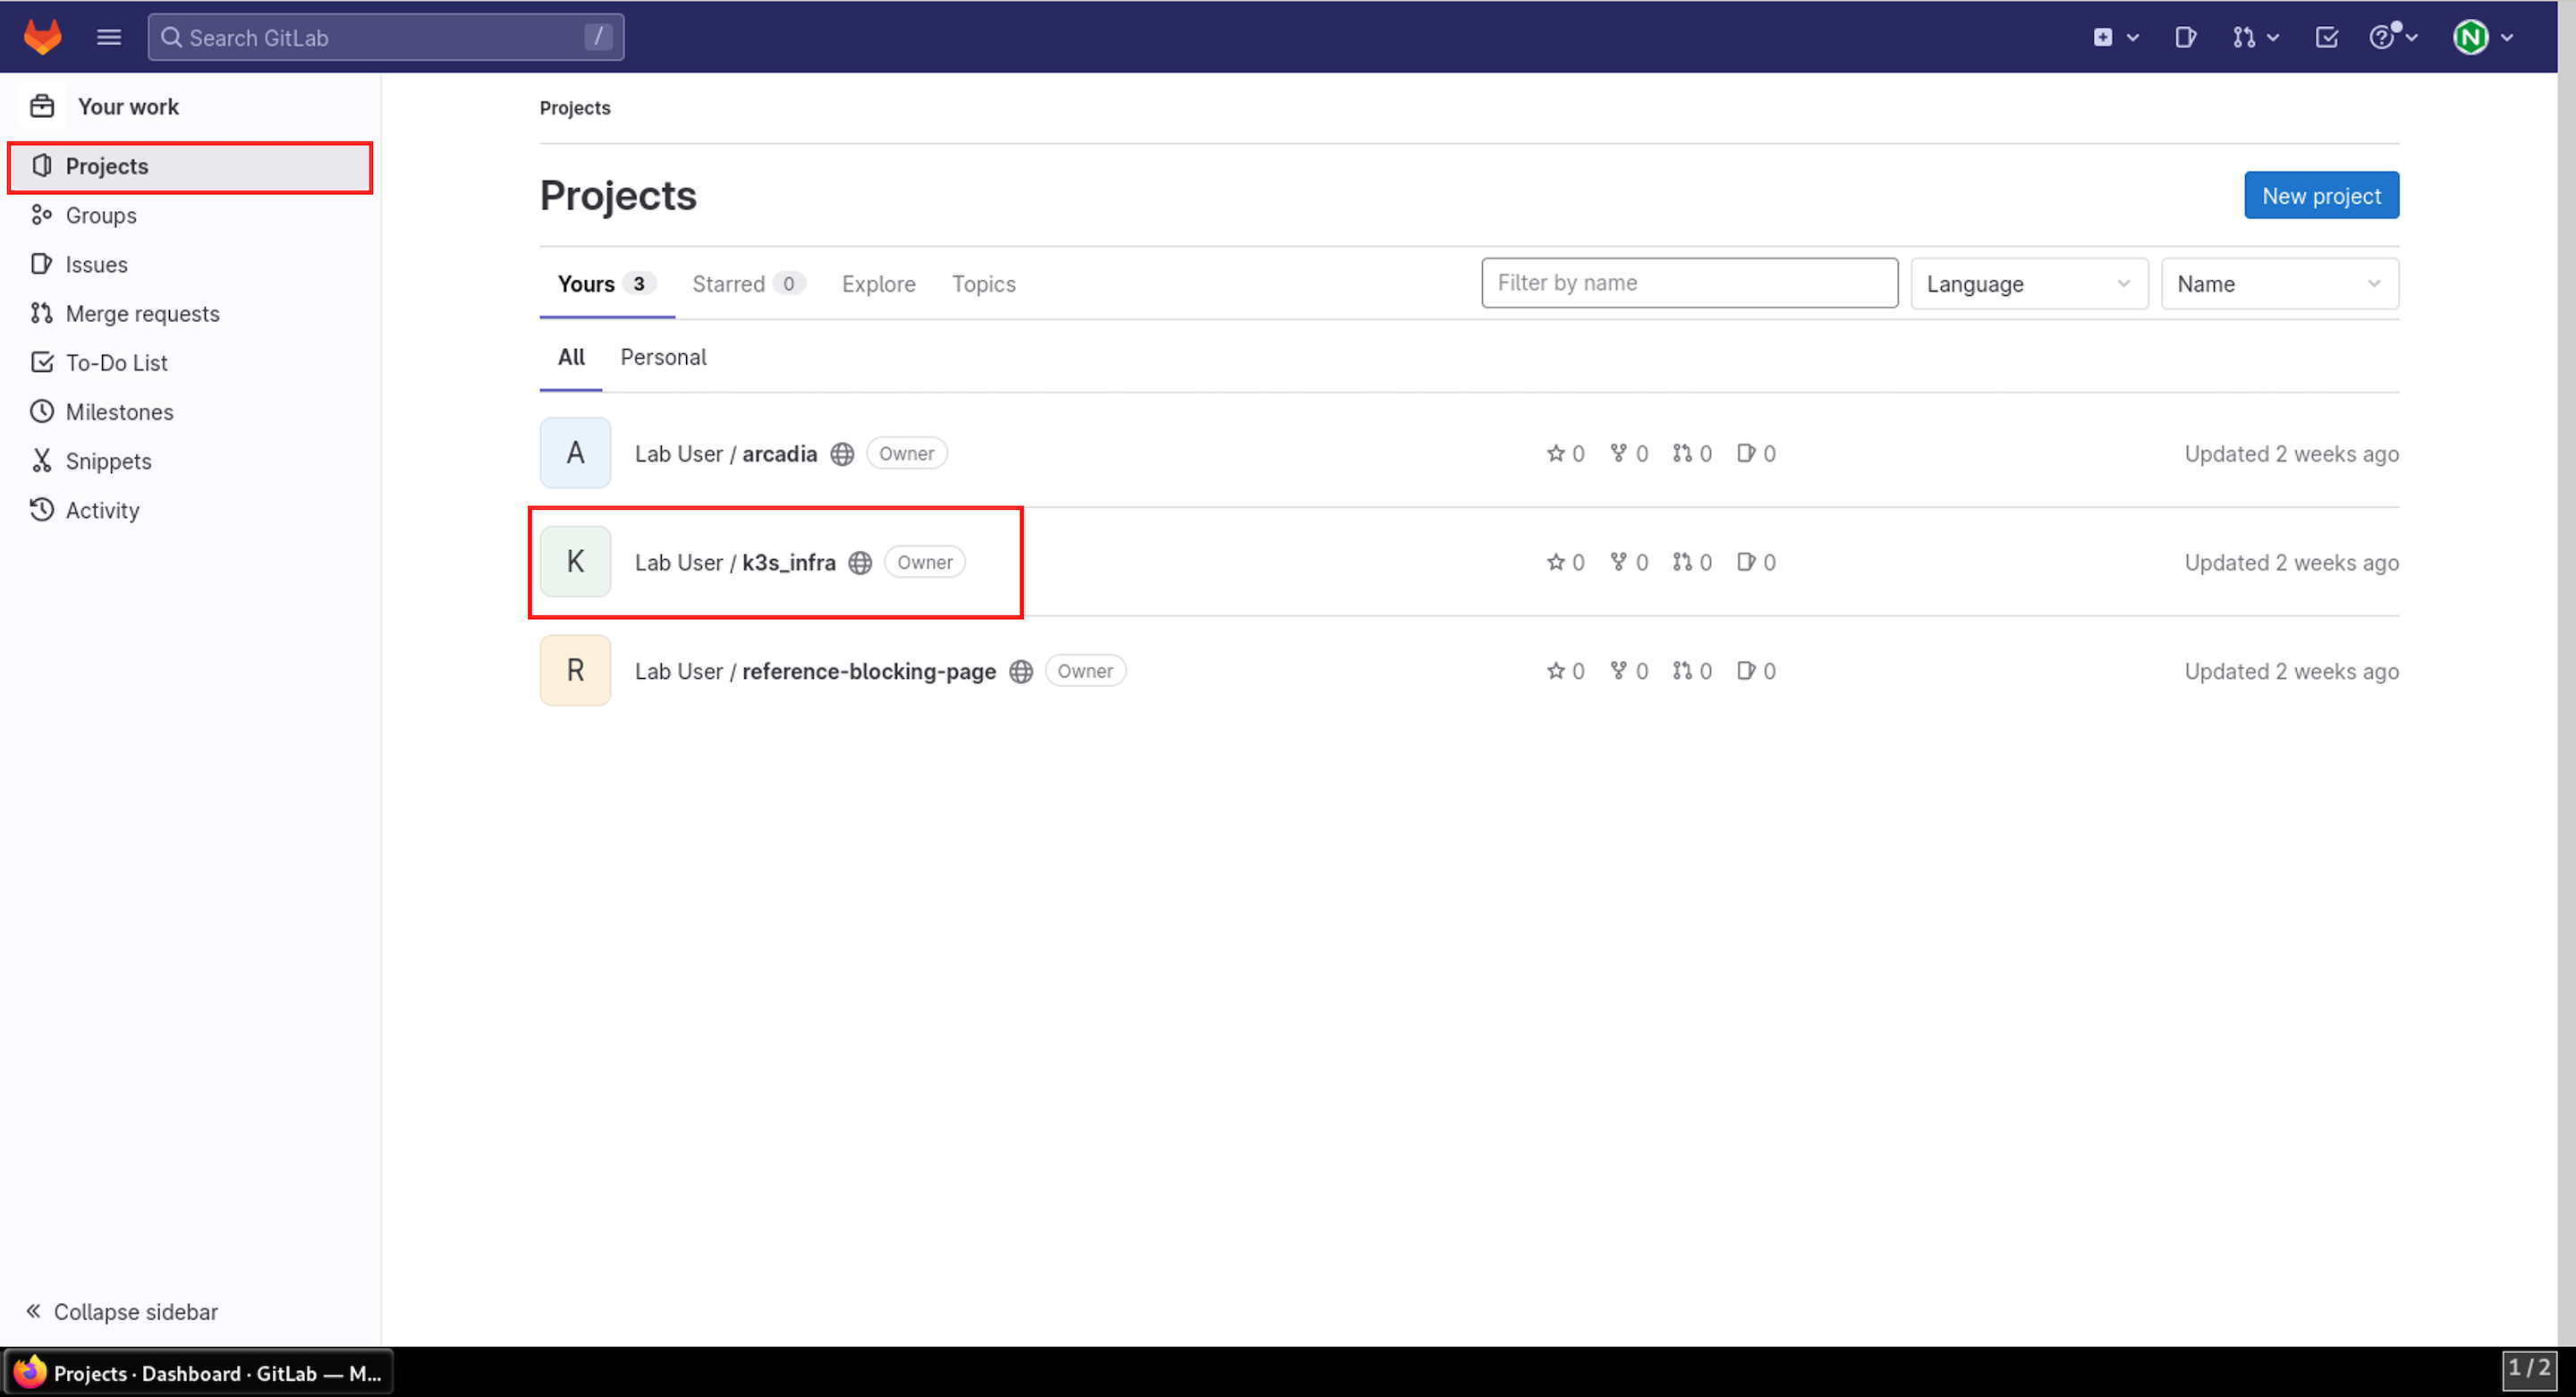
- Select the k3s_infra project repository. This repository houses all the infrastructure components used in this lab. All have been deployed with Helm and the help of Argo CD.
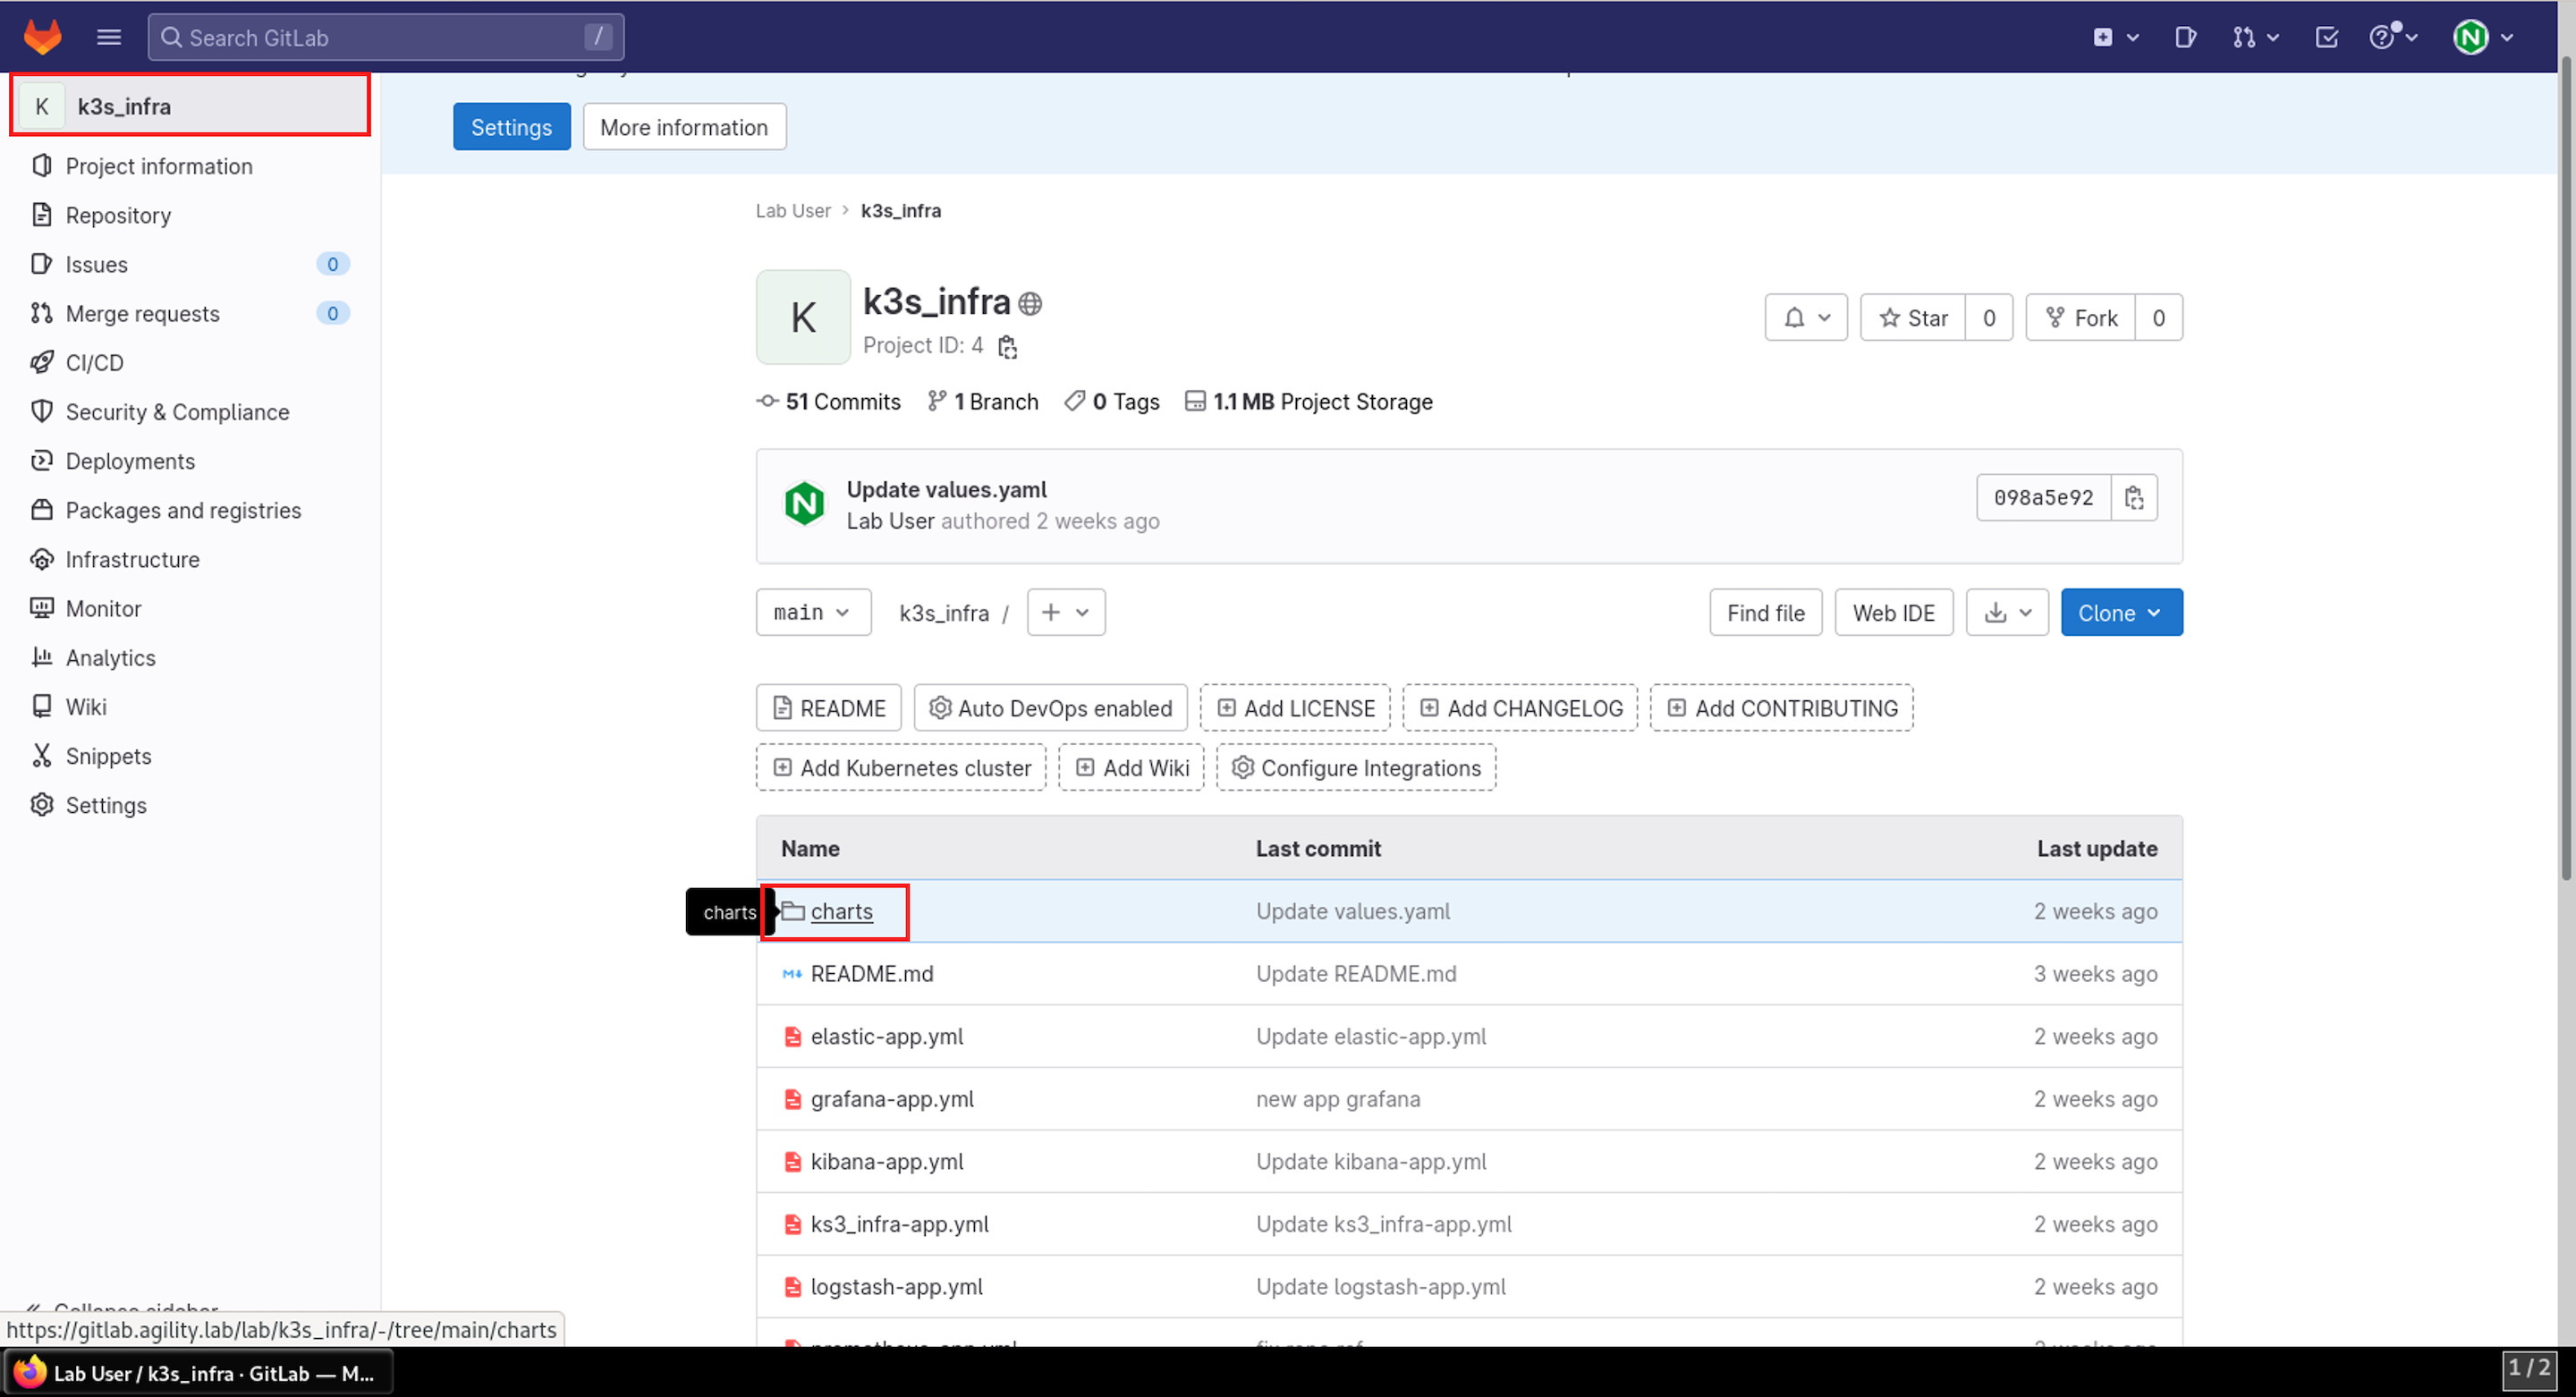
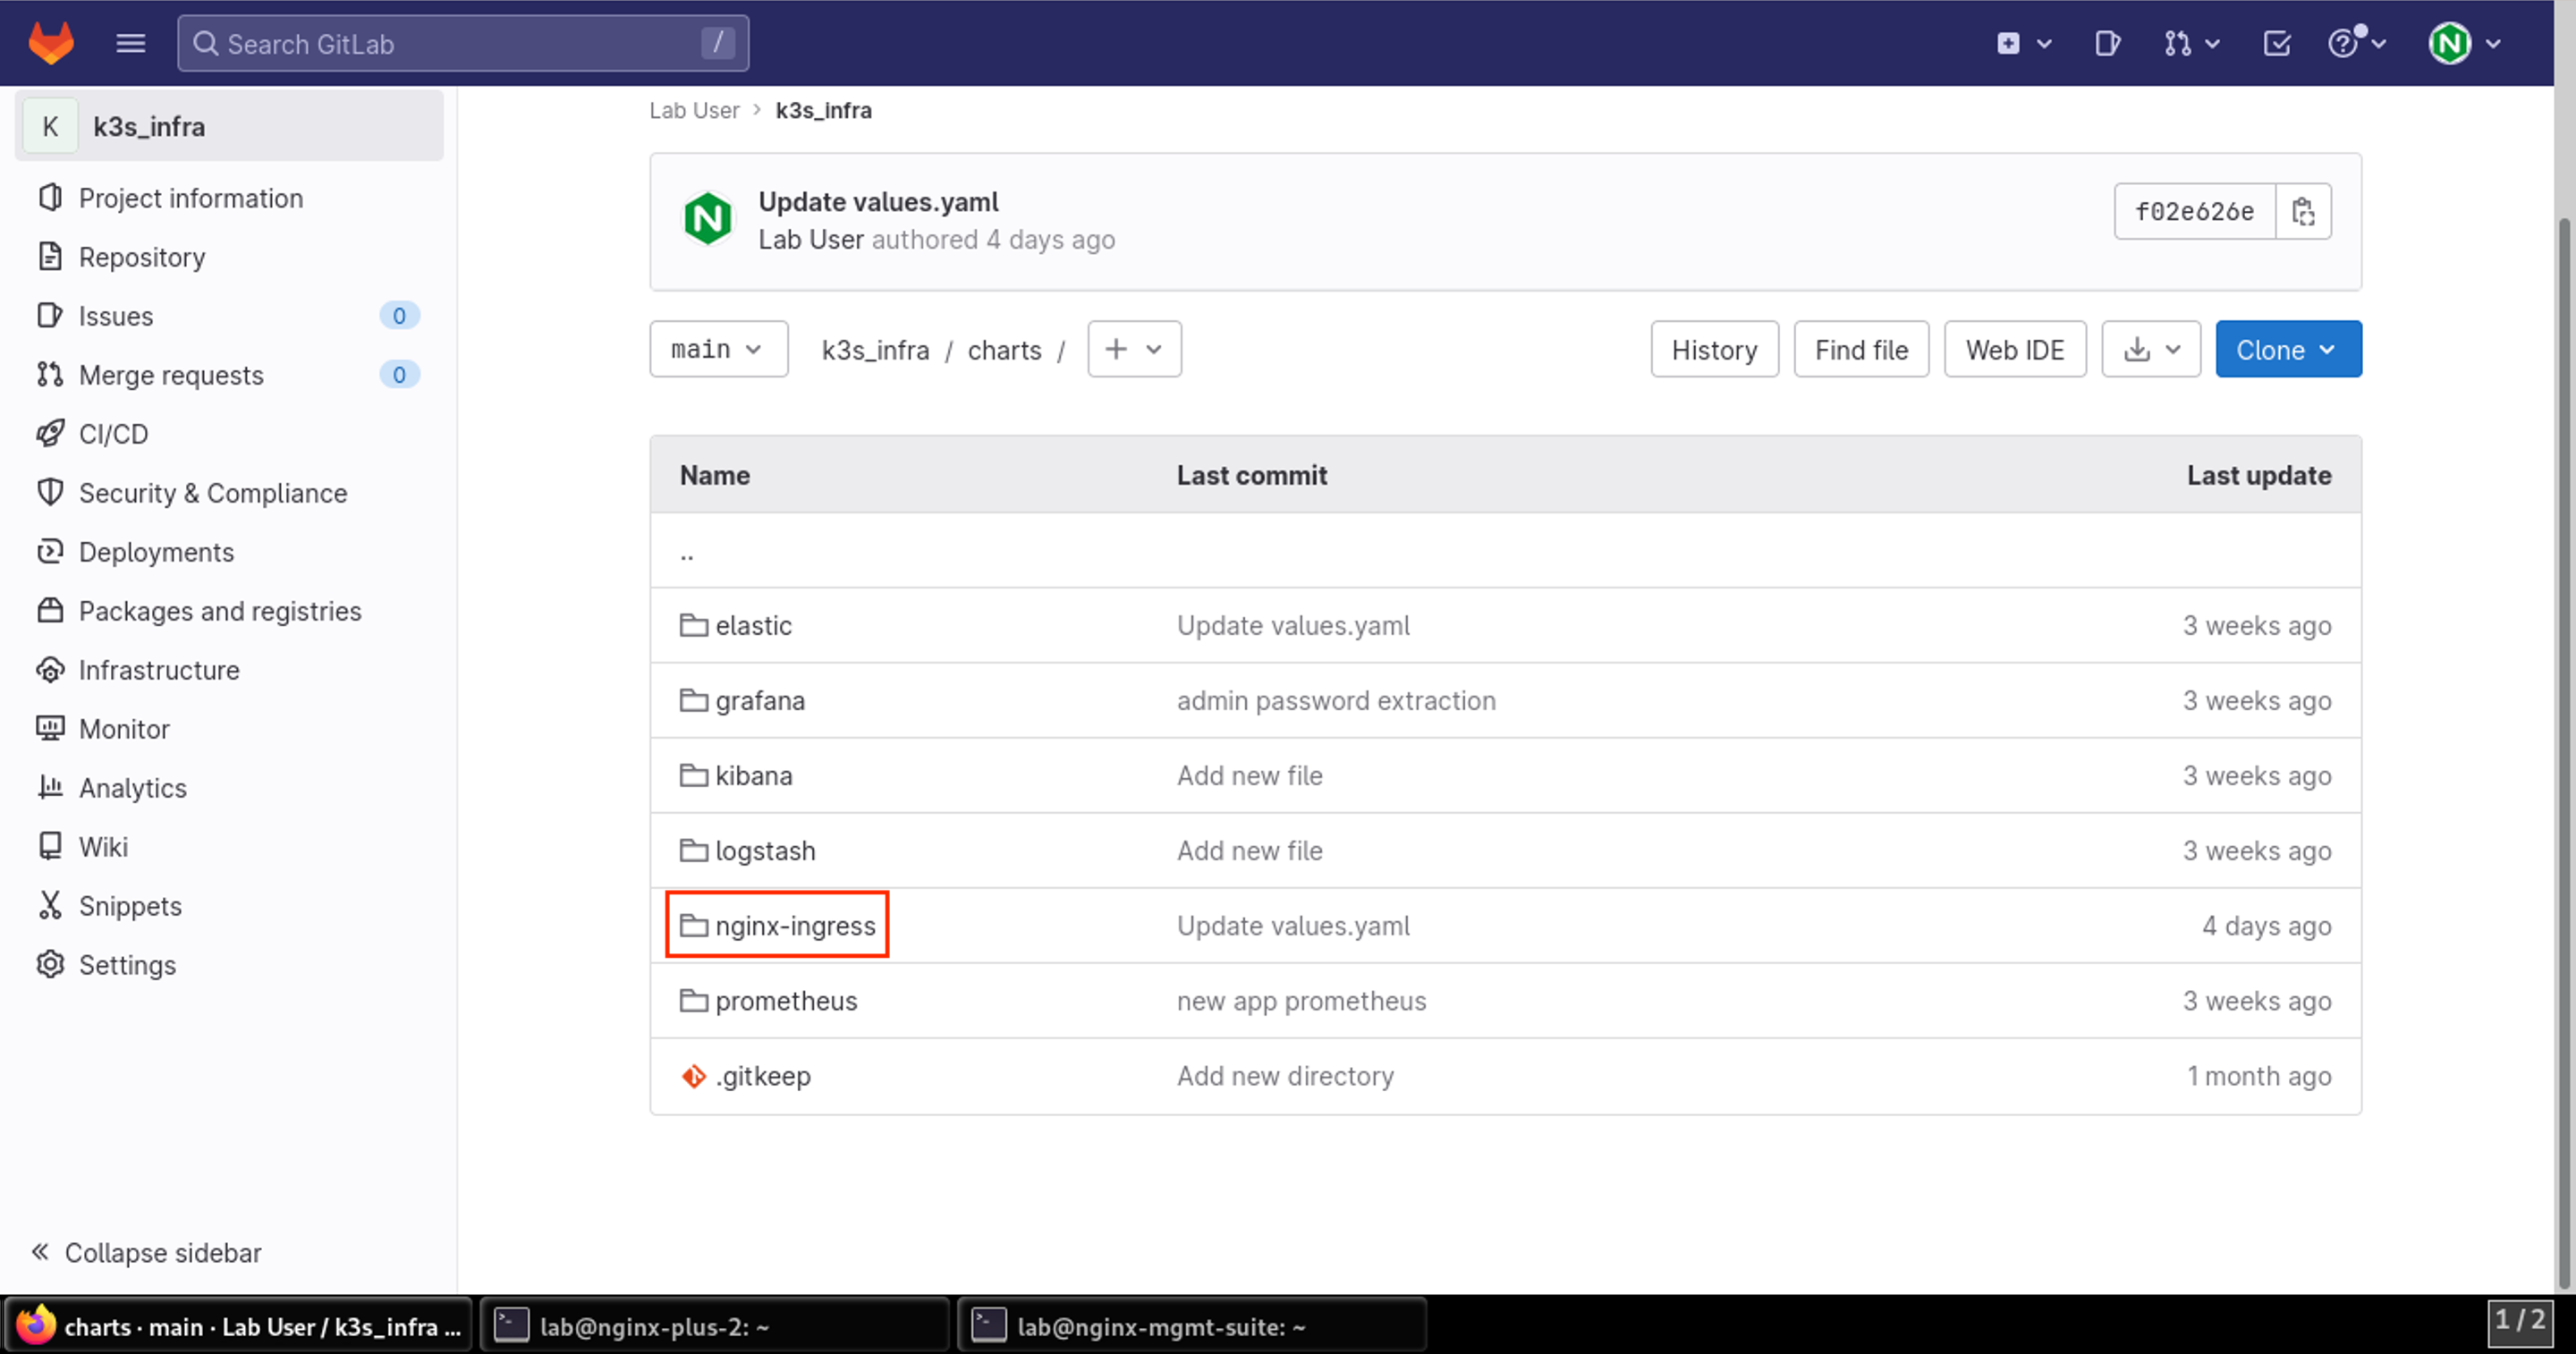
- Once inside the project, click on charts directory:
- Now click into the nginx-ingress directory:
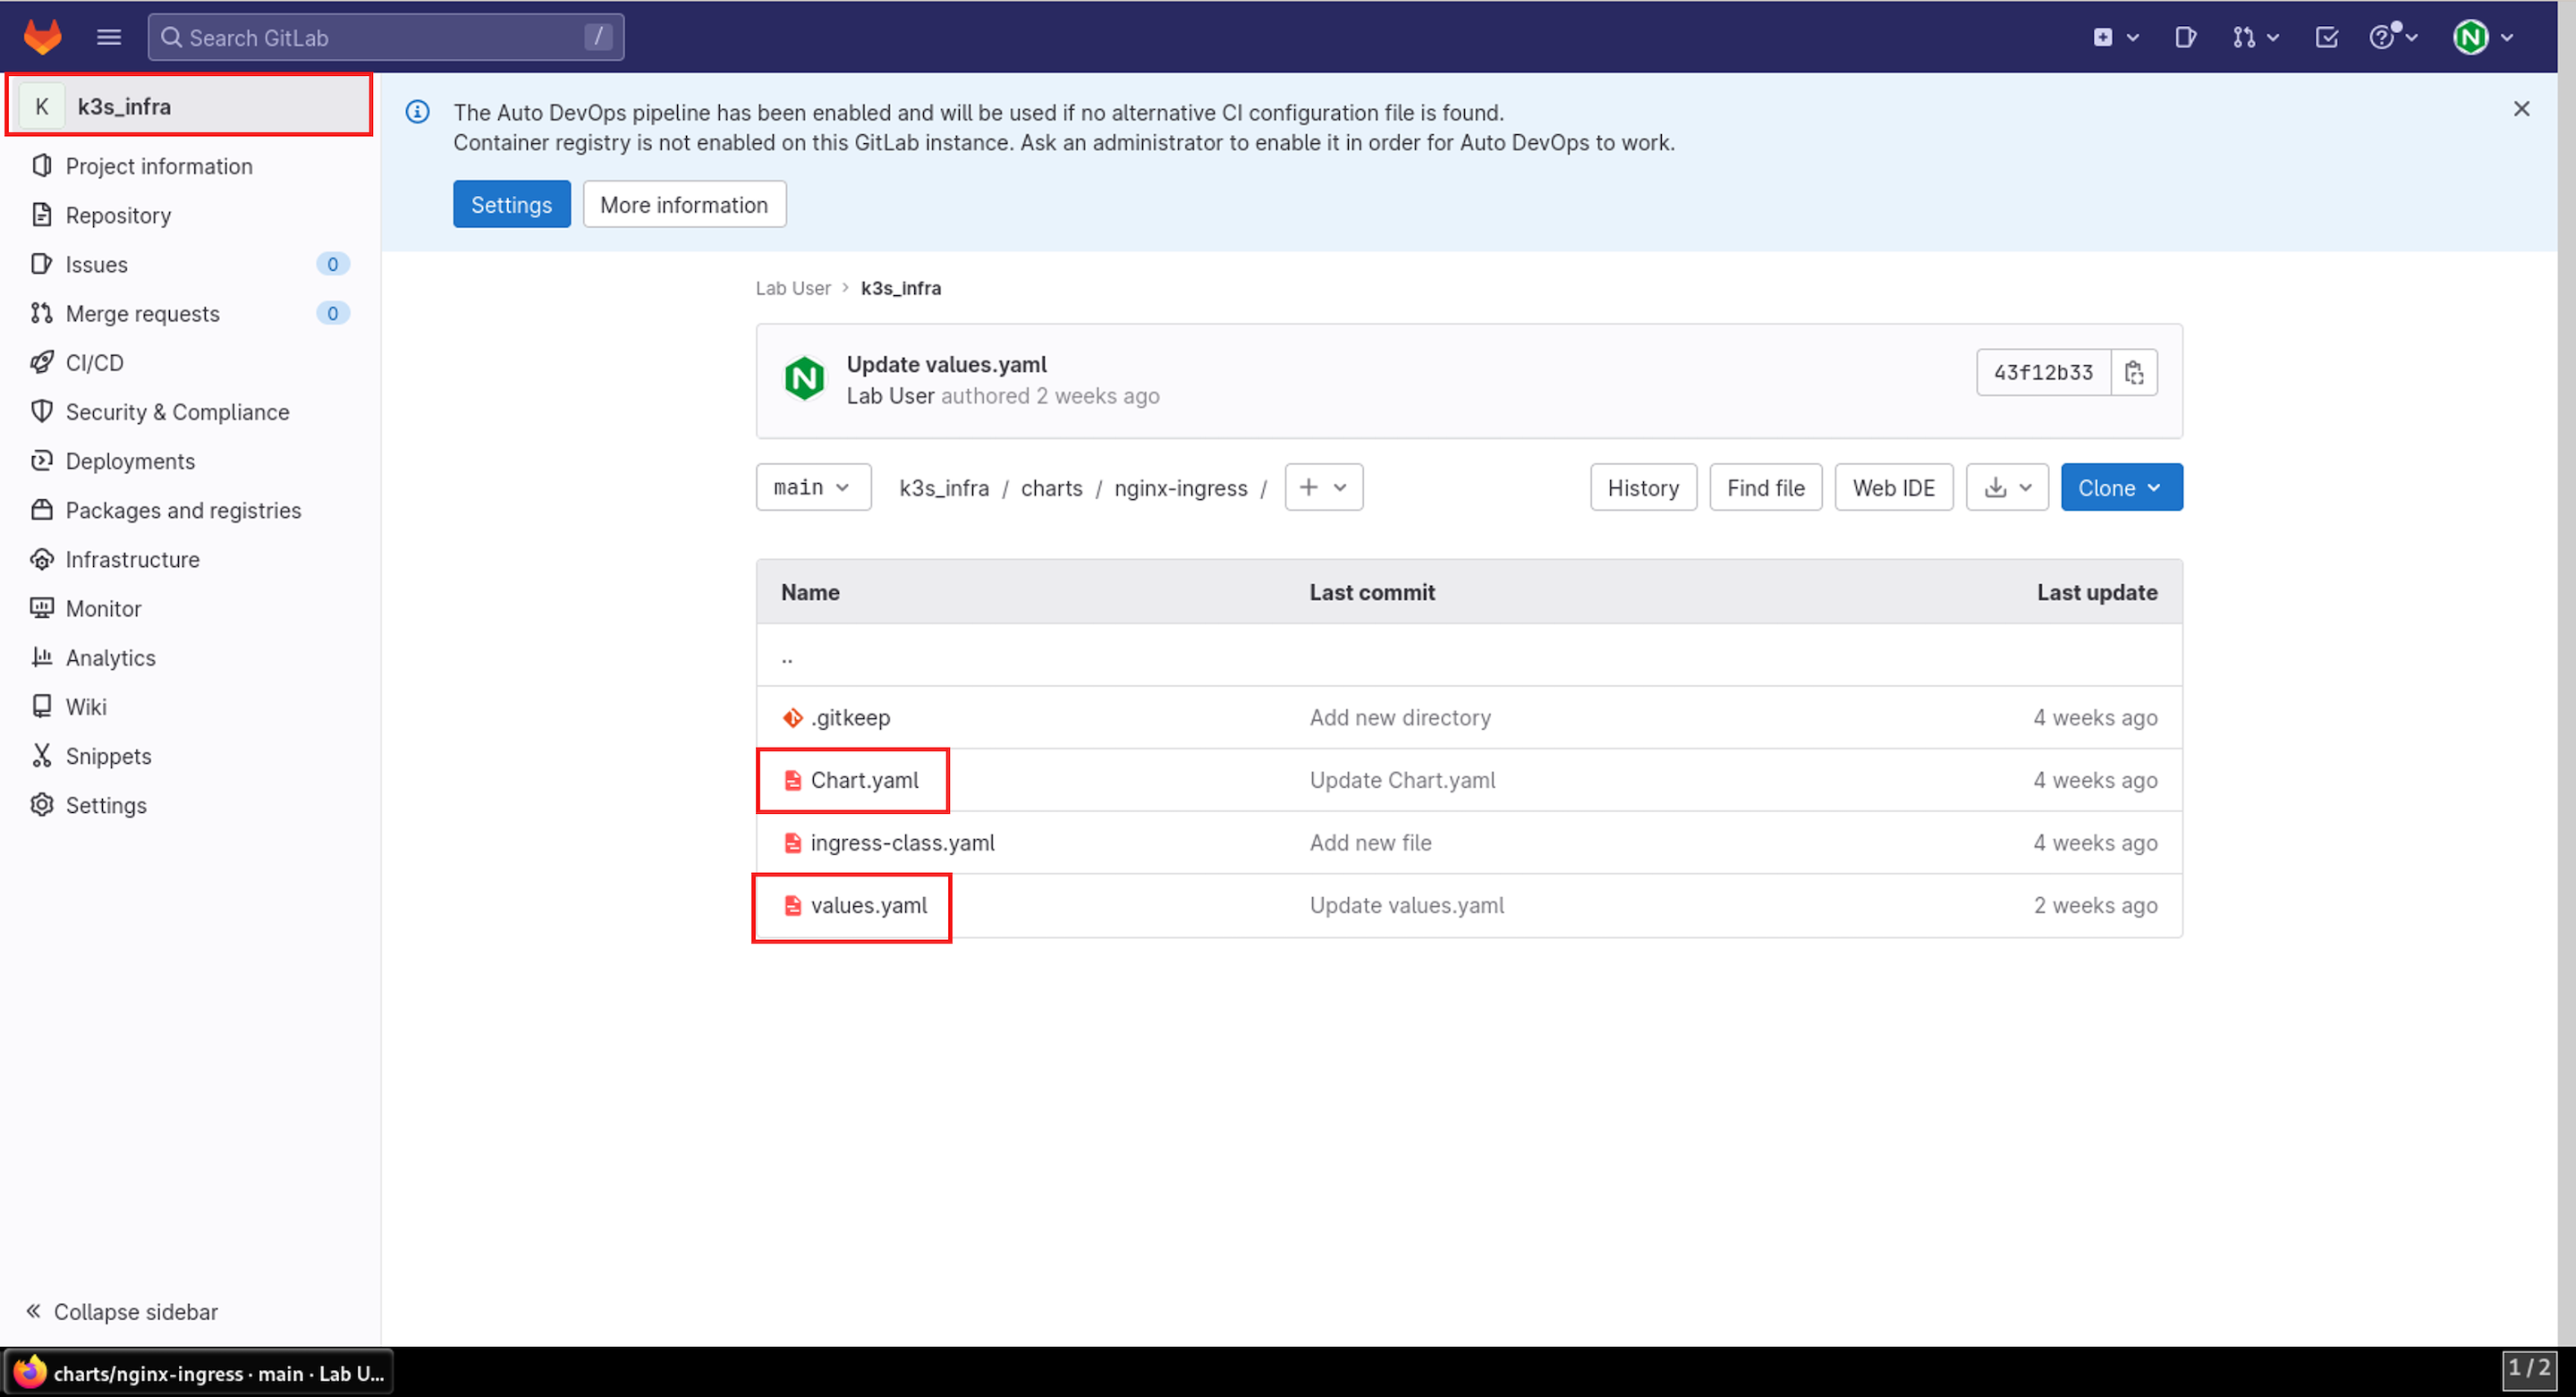
- Here you will find the two main files we’ll discuss:
- Charts.yaml
- values.yaml
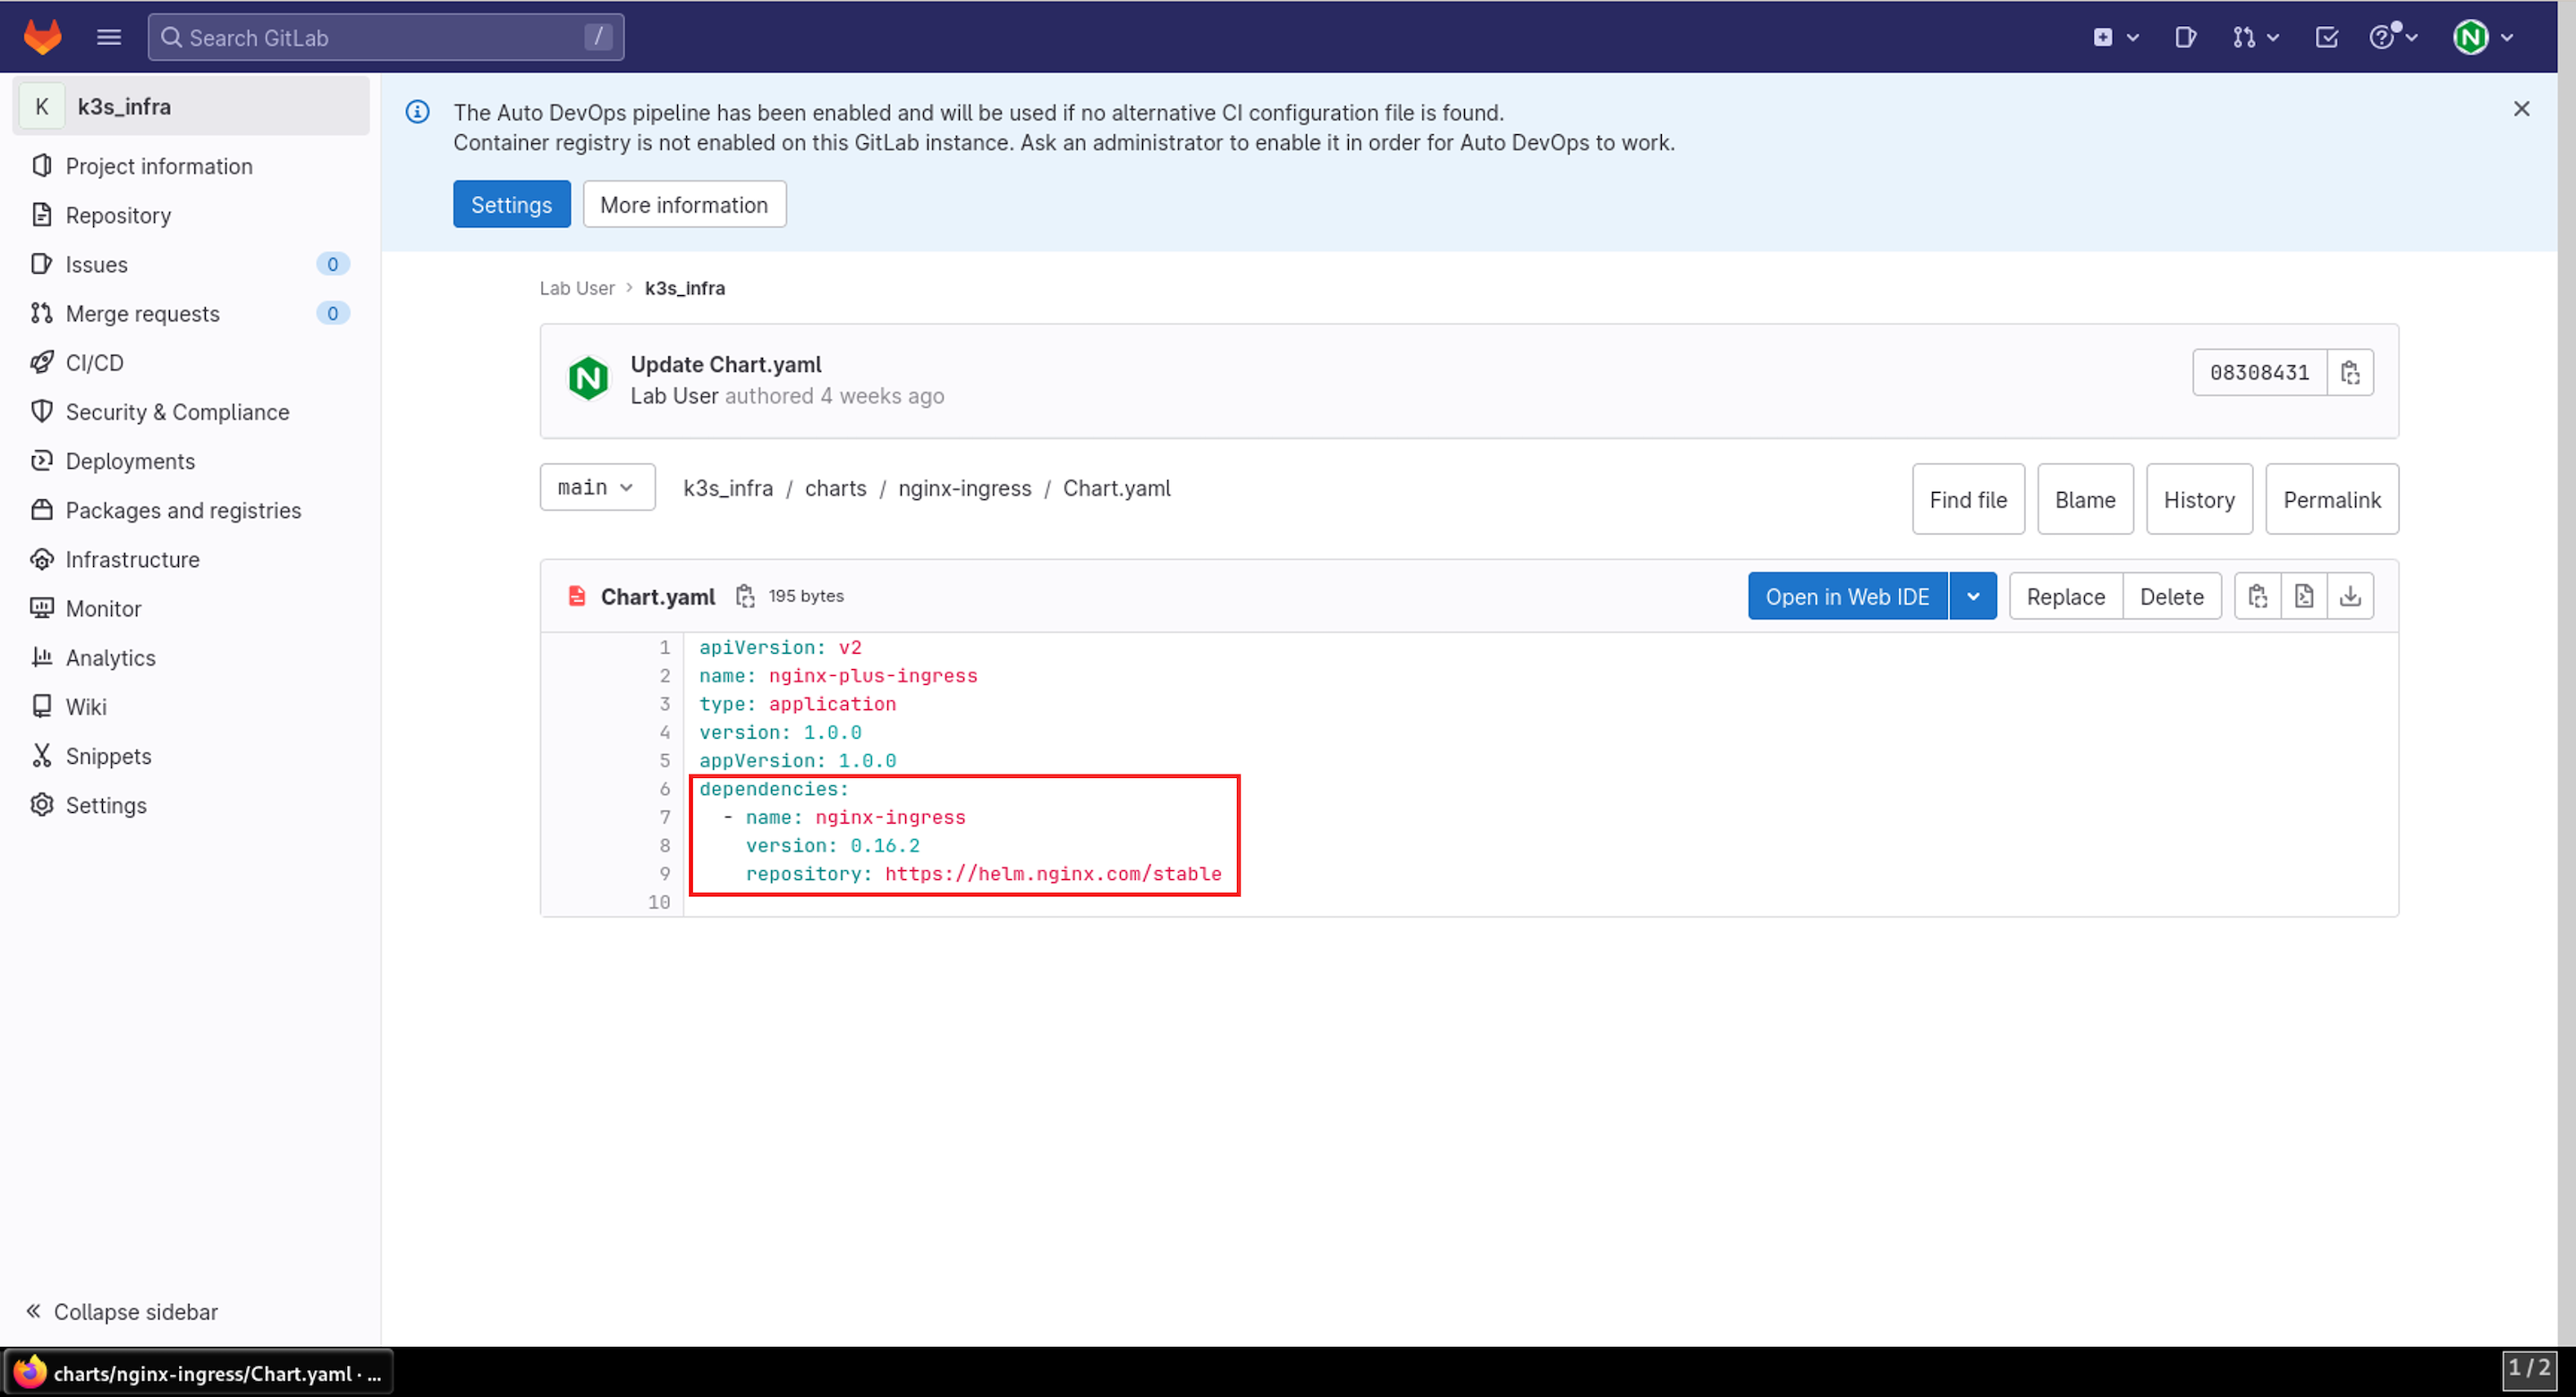
- The Chart.yaml contains information on which chart version to use and upon which dependencies it relies.
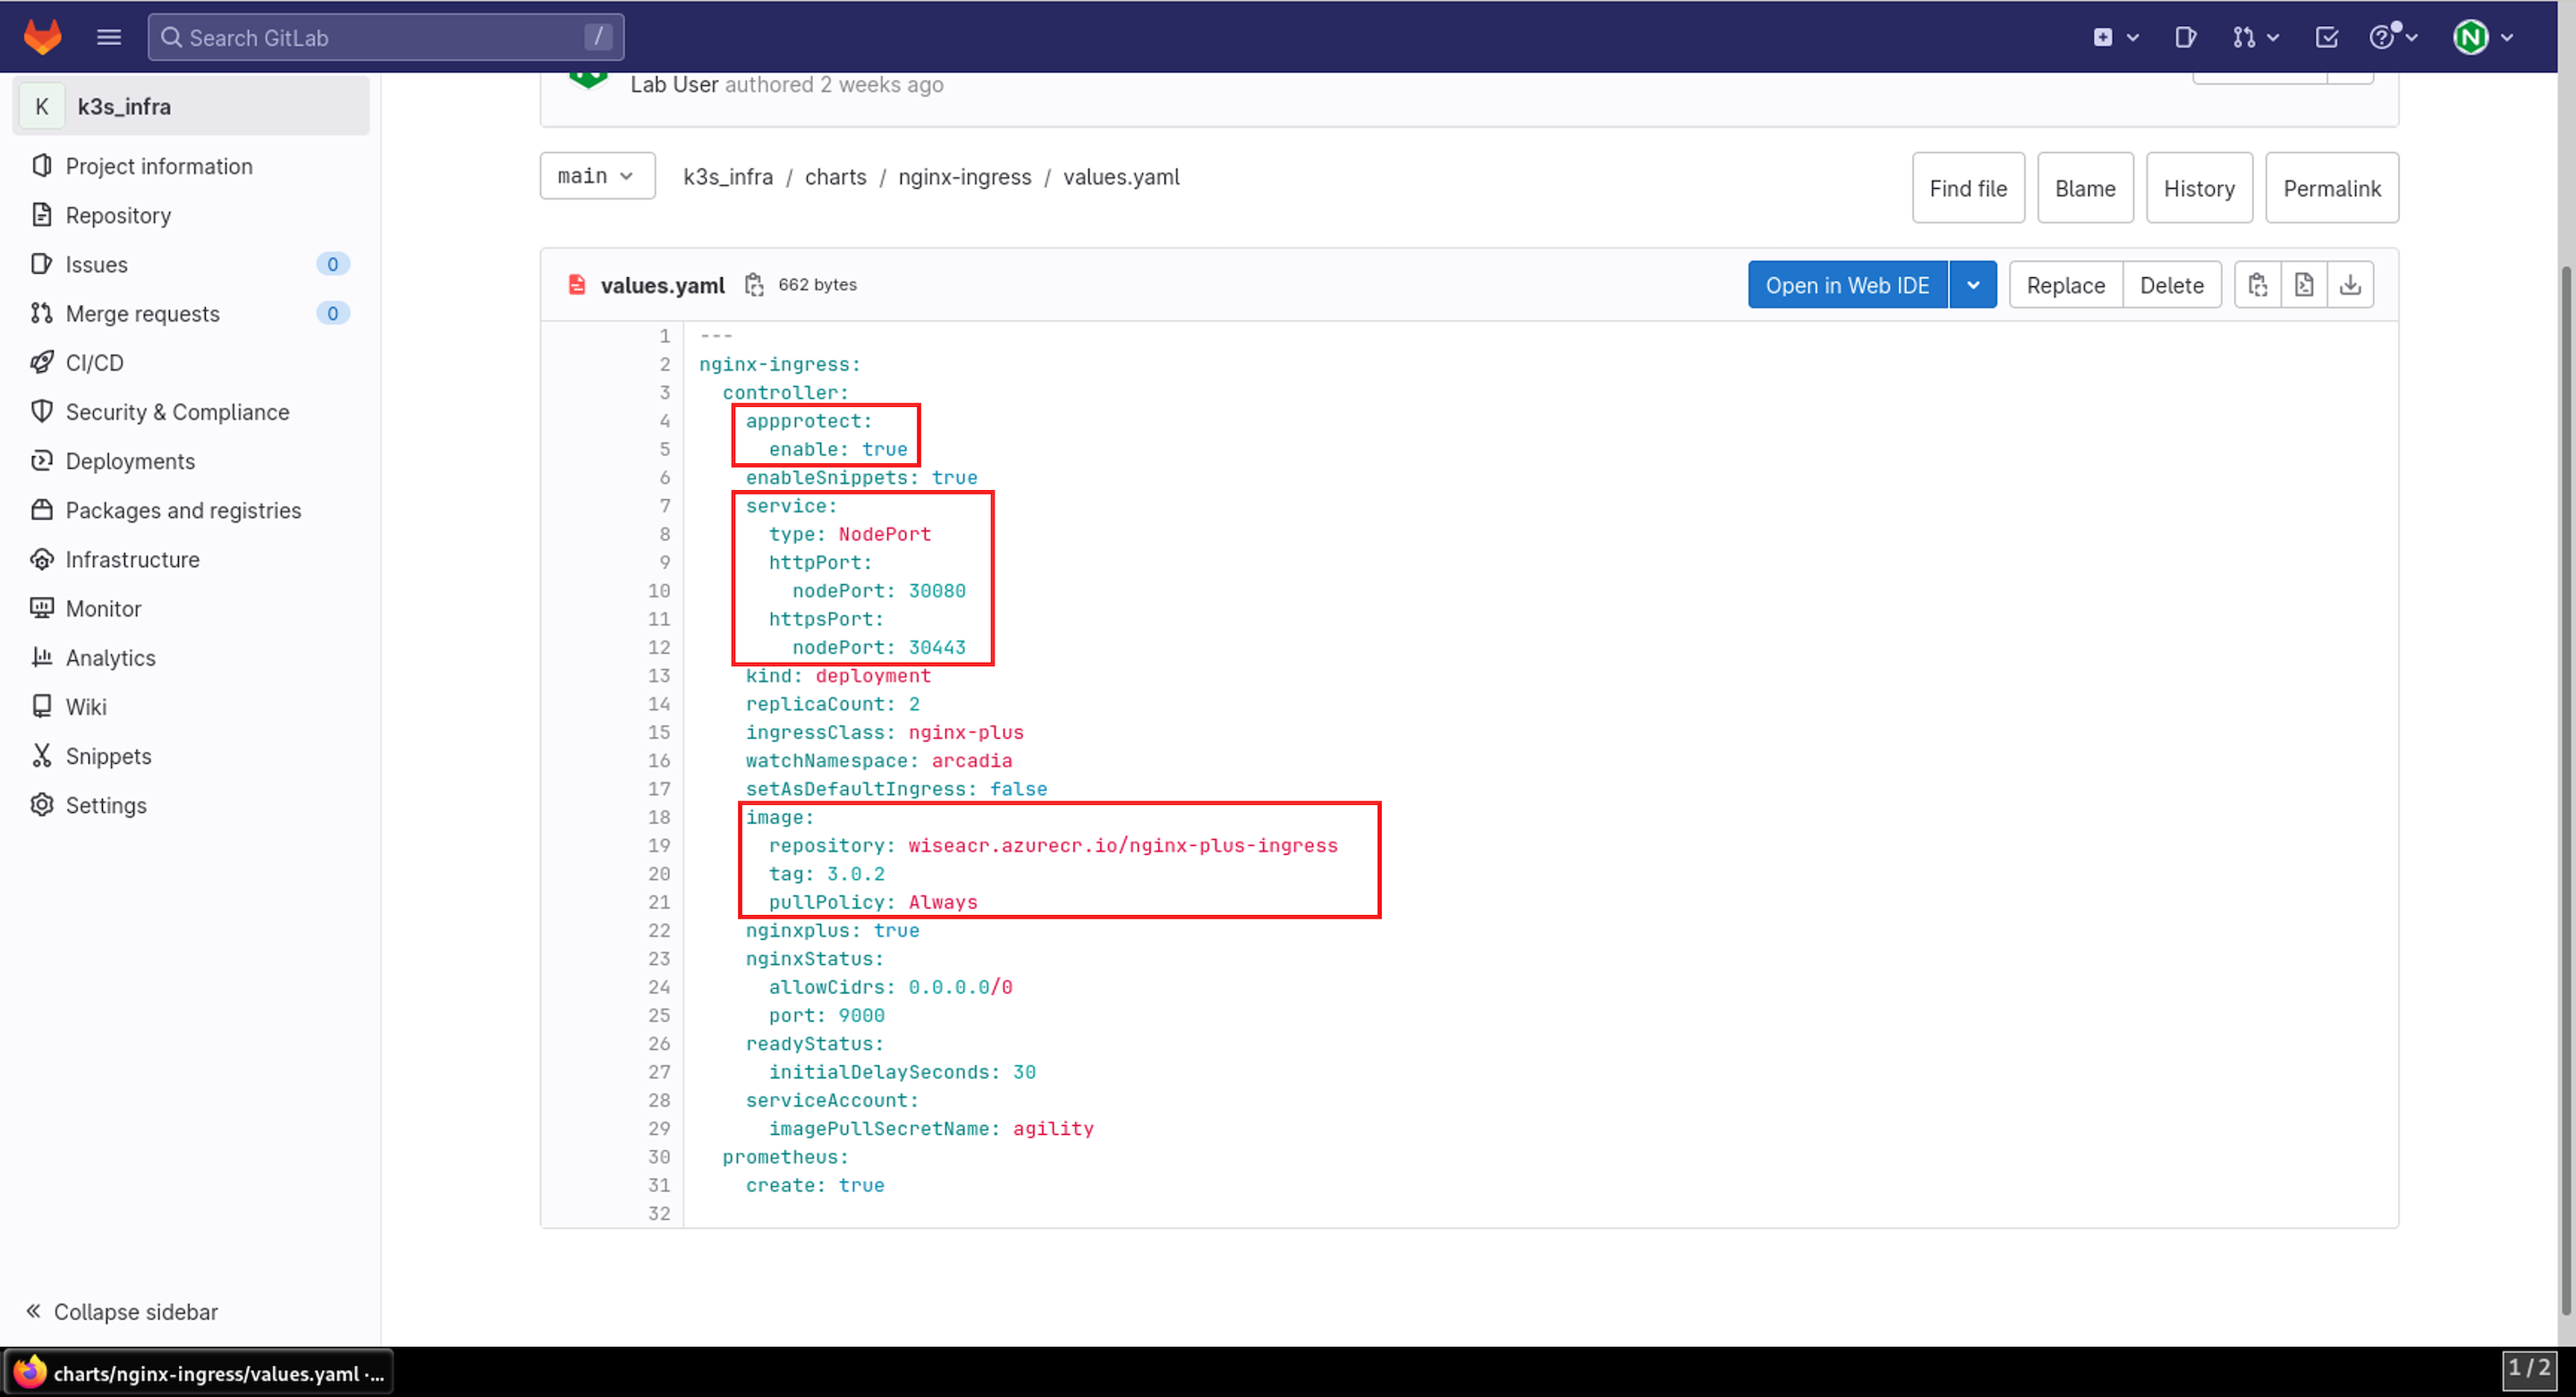
- In the values.yaml file, you can define what options you want the ingress controller to have (app-protect, app-dos, snippets etc.), and what registry to pull the relevant image(s).
Now that you can see how we’ve set up NGINX Ingress Controller, you can focus on securing the Arcadia app with App Protect.
- On the jump host, use the Applications menu bar to launch Visual Studio Code.
Caution
It may take several seconds for Visual Studio Code to launch for the first time.
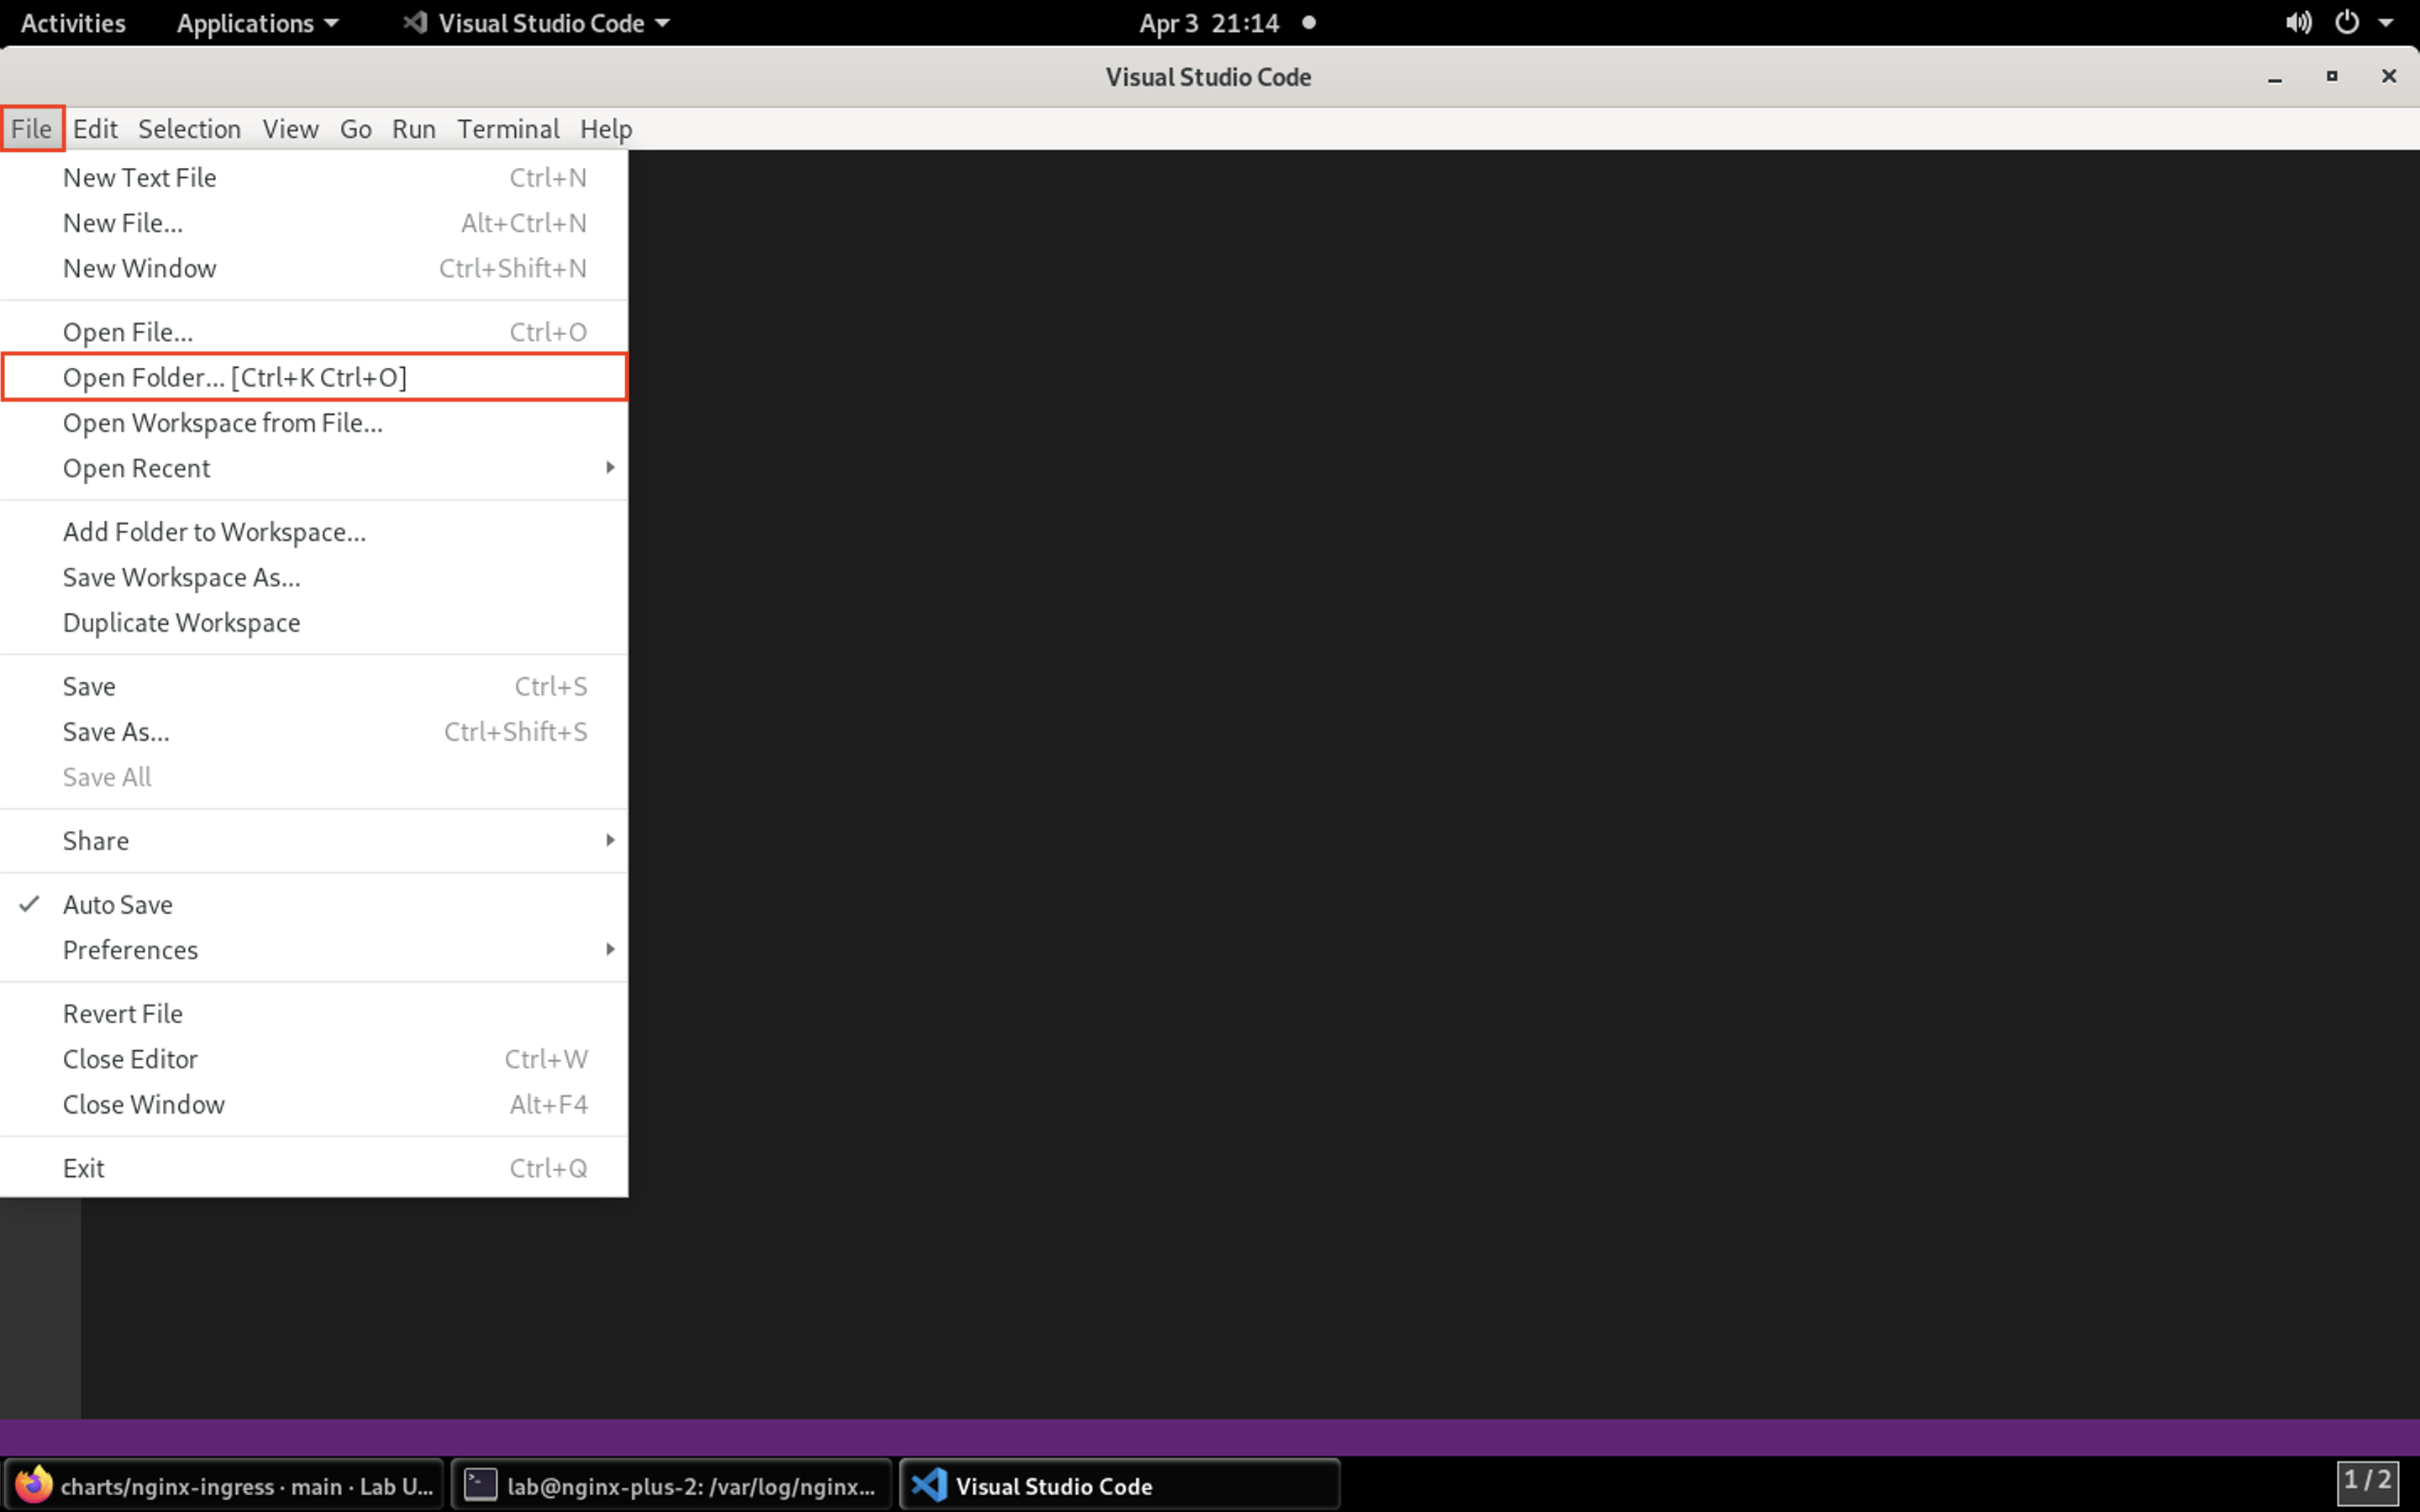
- In Visual Studio Code, navigate to File > Open Folder.
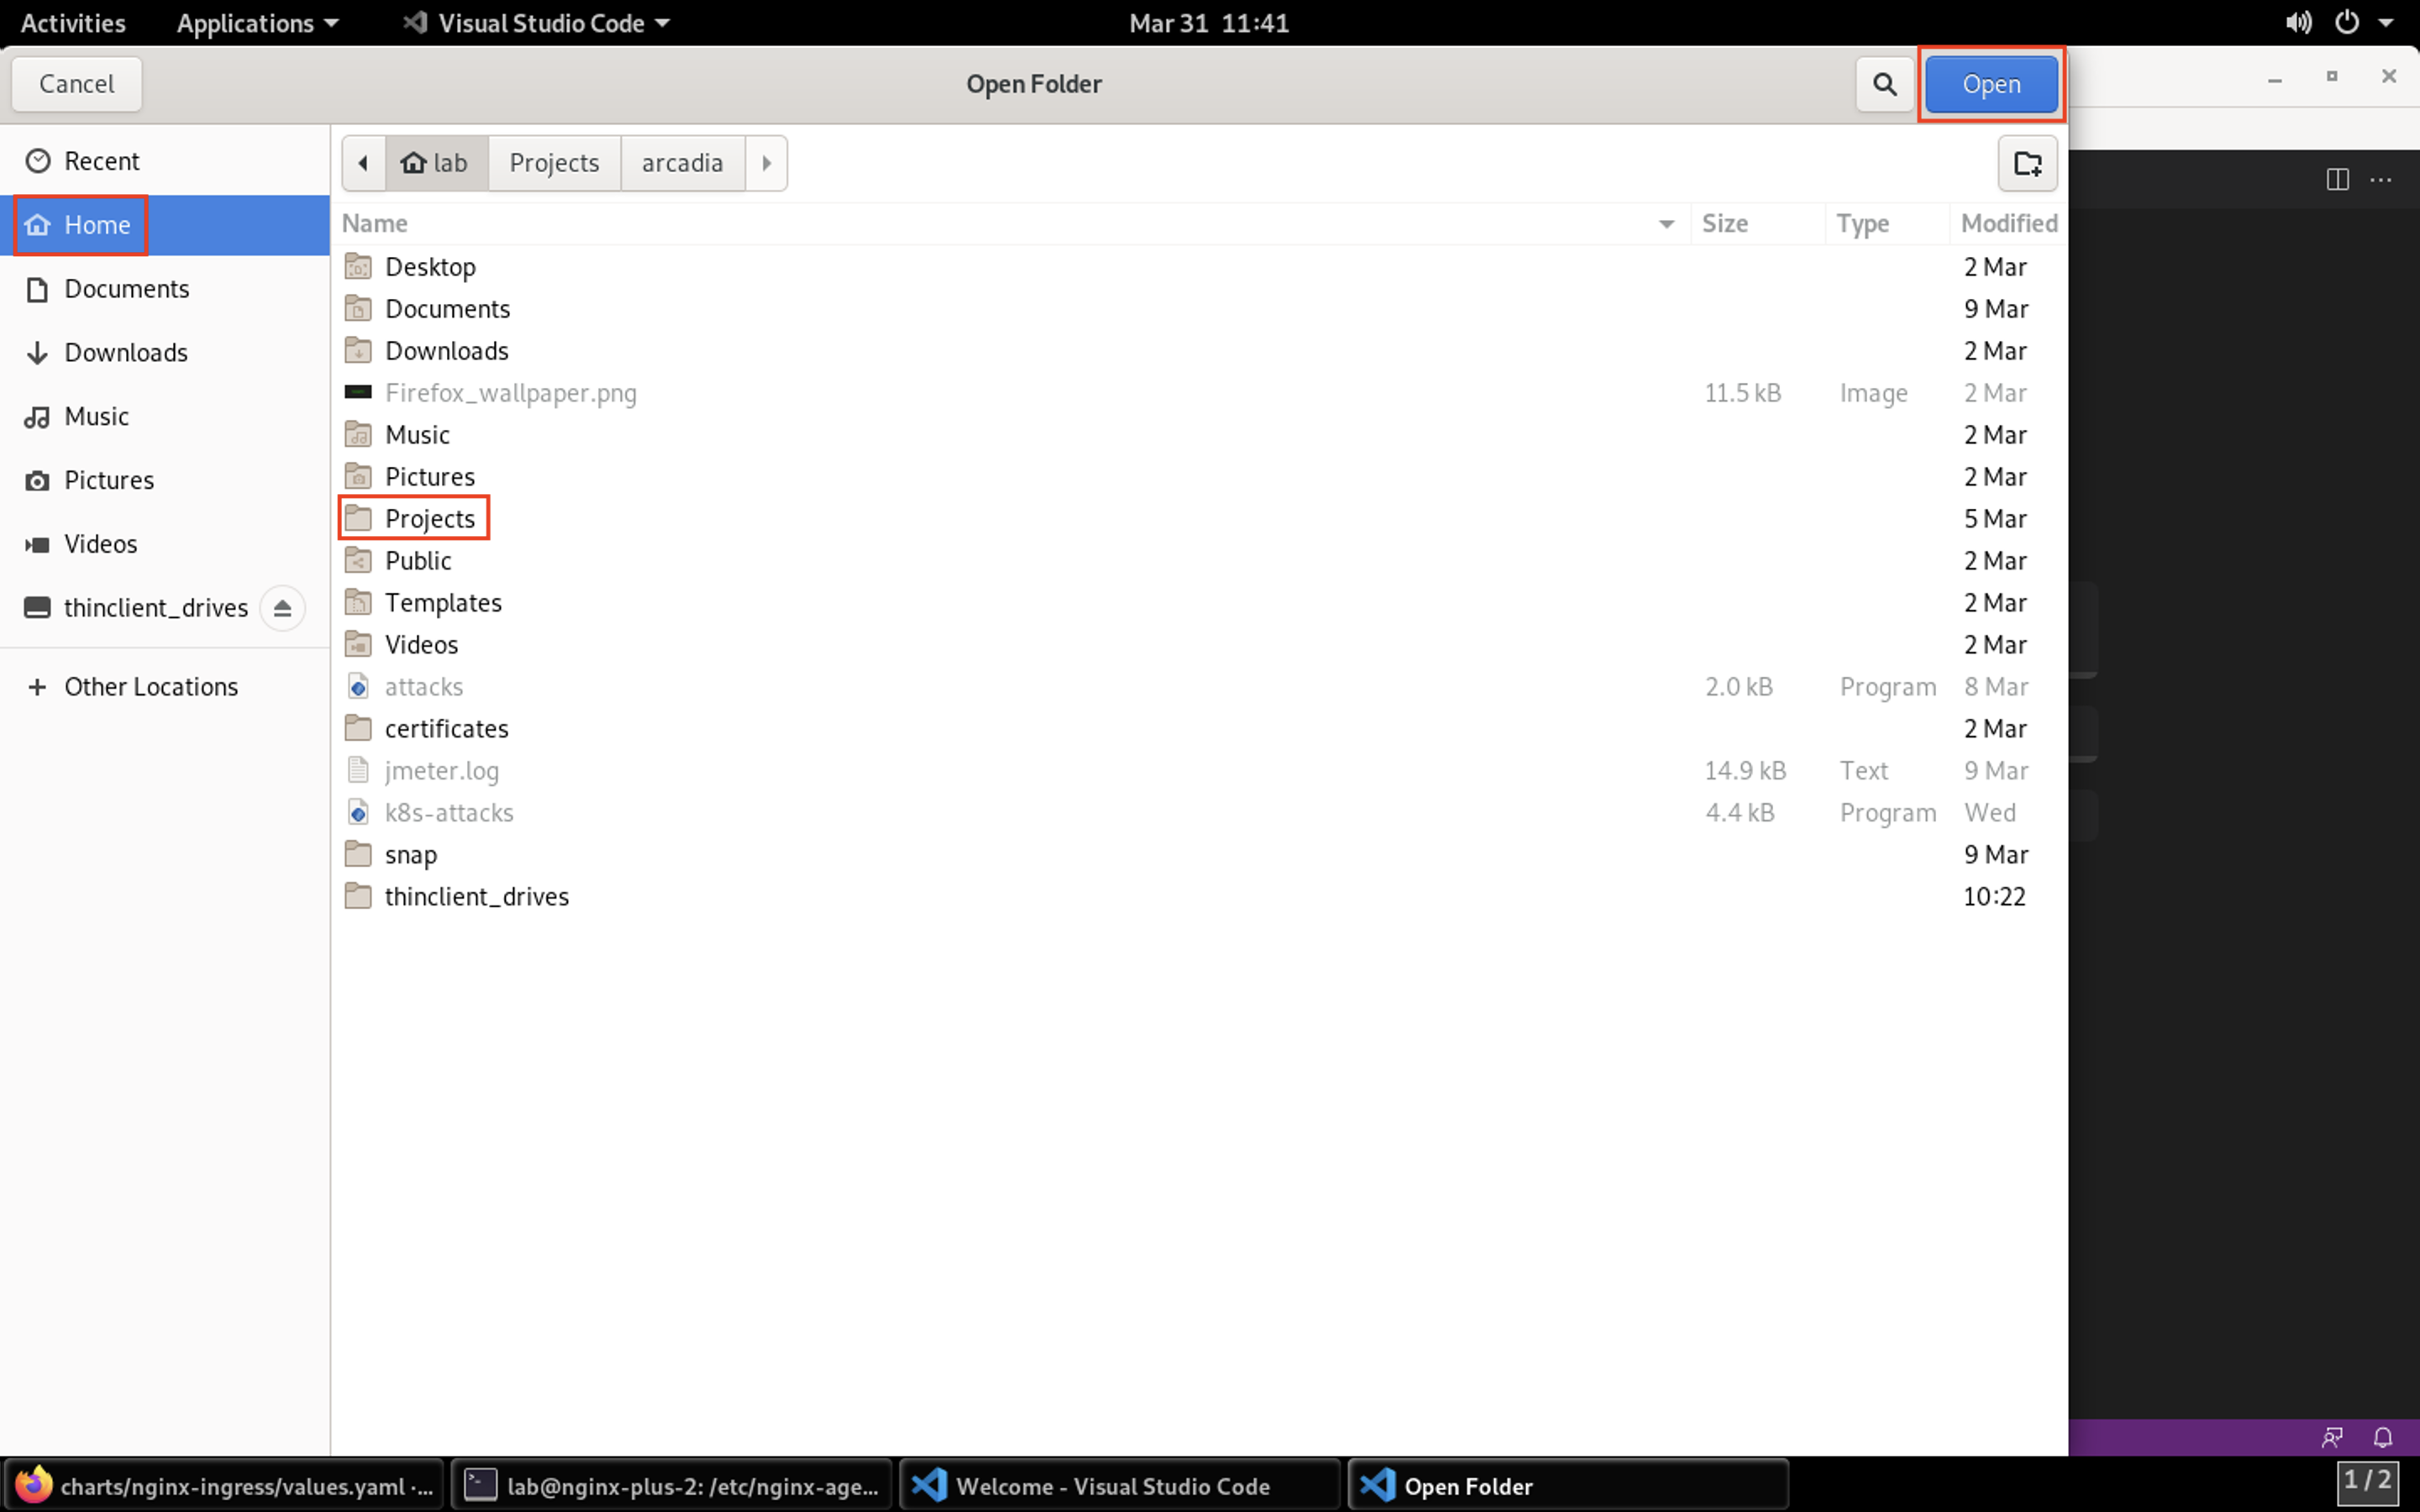
- Click on the Home shortcut on the left, then double-click the Projects folder. Single-click on the arcadia folder, then click Open in the top-right corner of the navigation window.
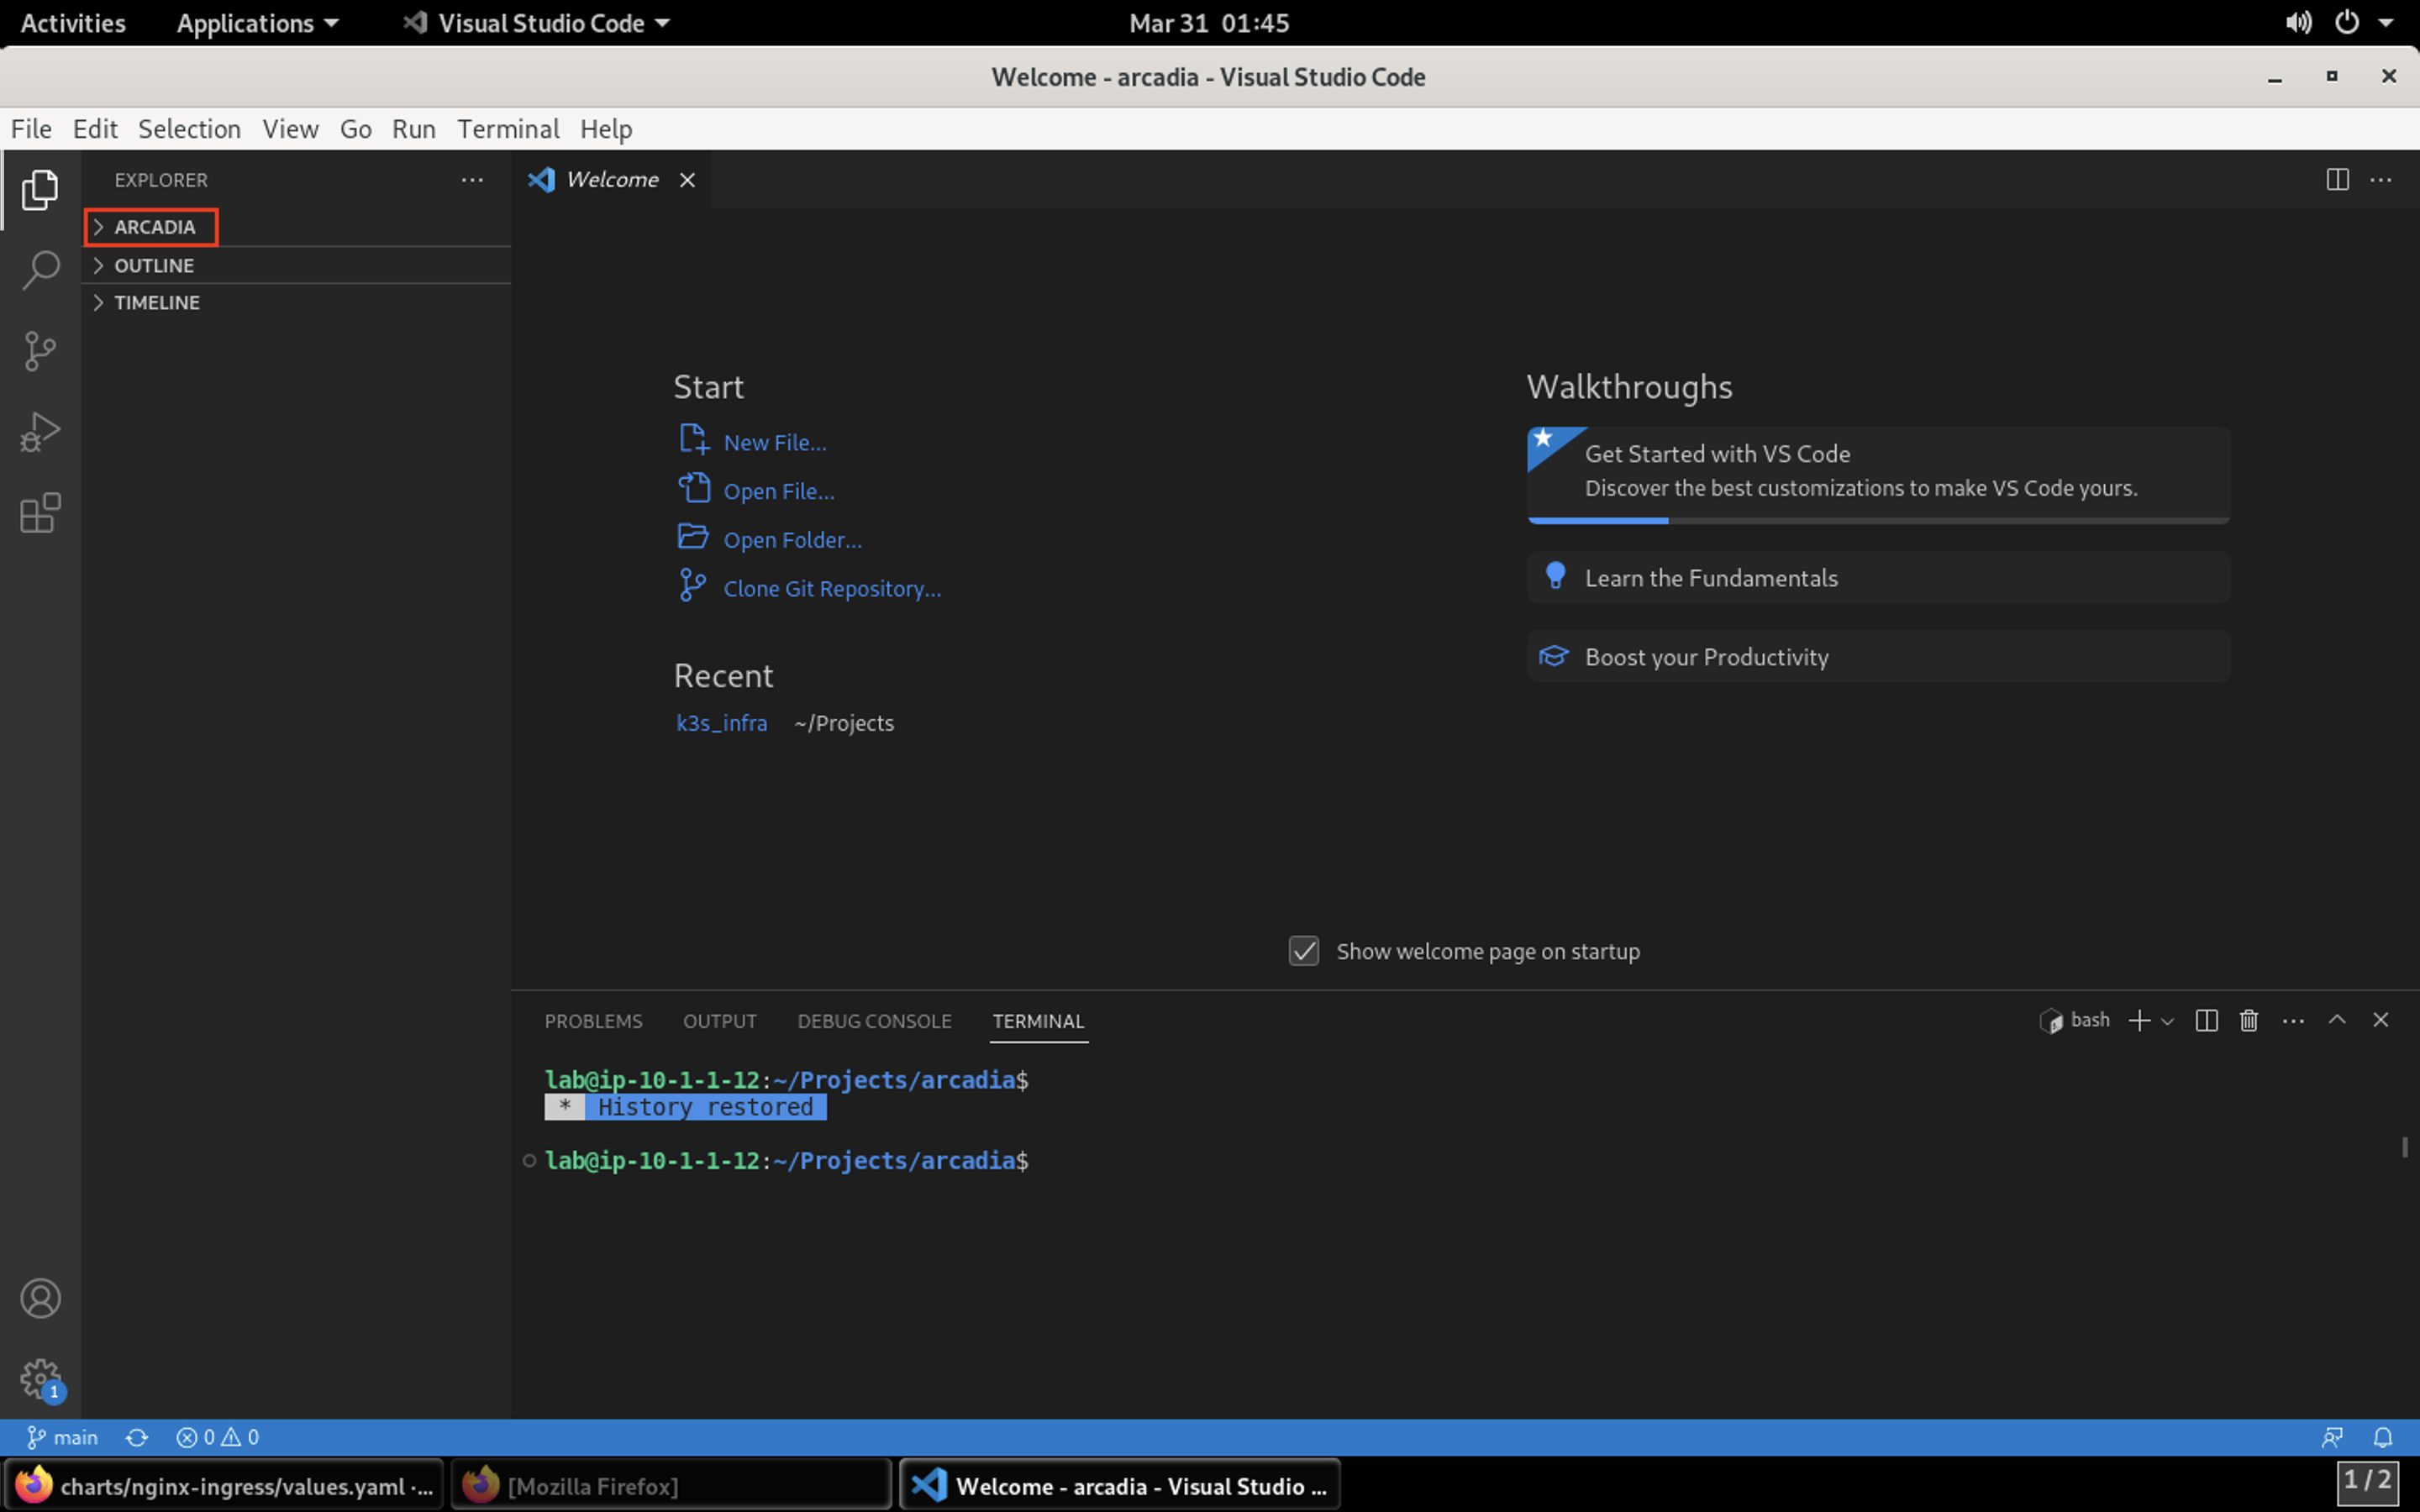
- Expand the arcadia folder by clicking arcadia in the top-left of the screen.
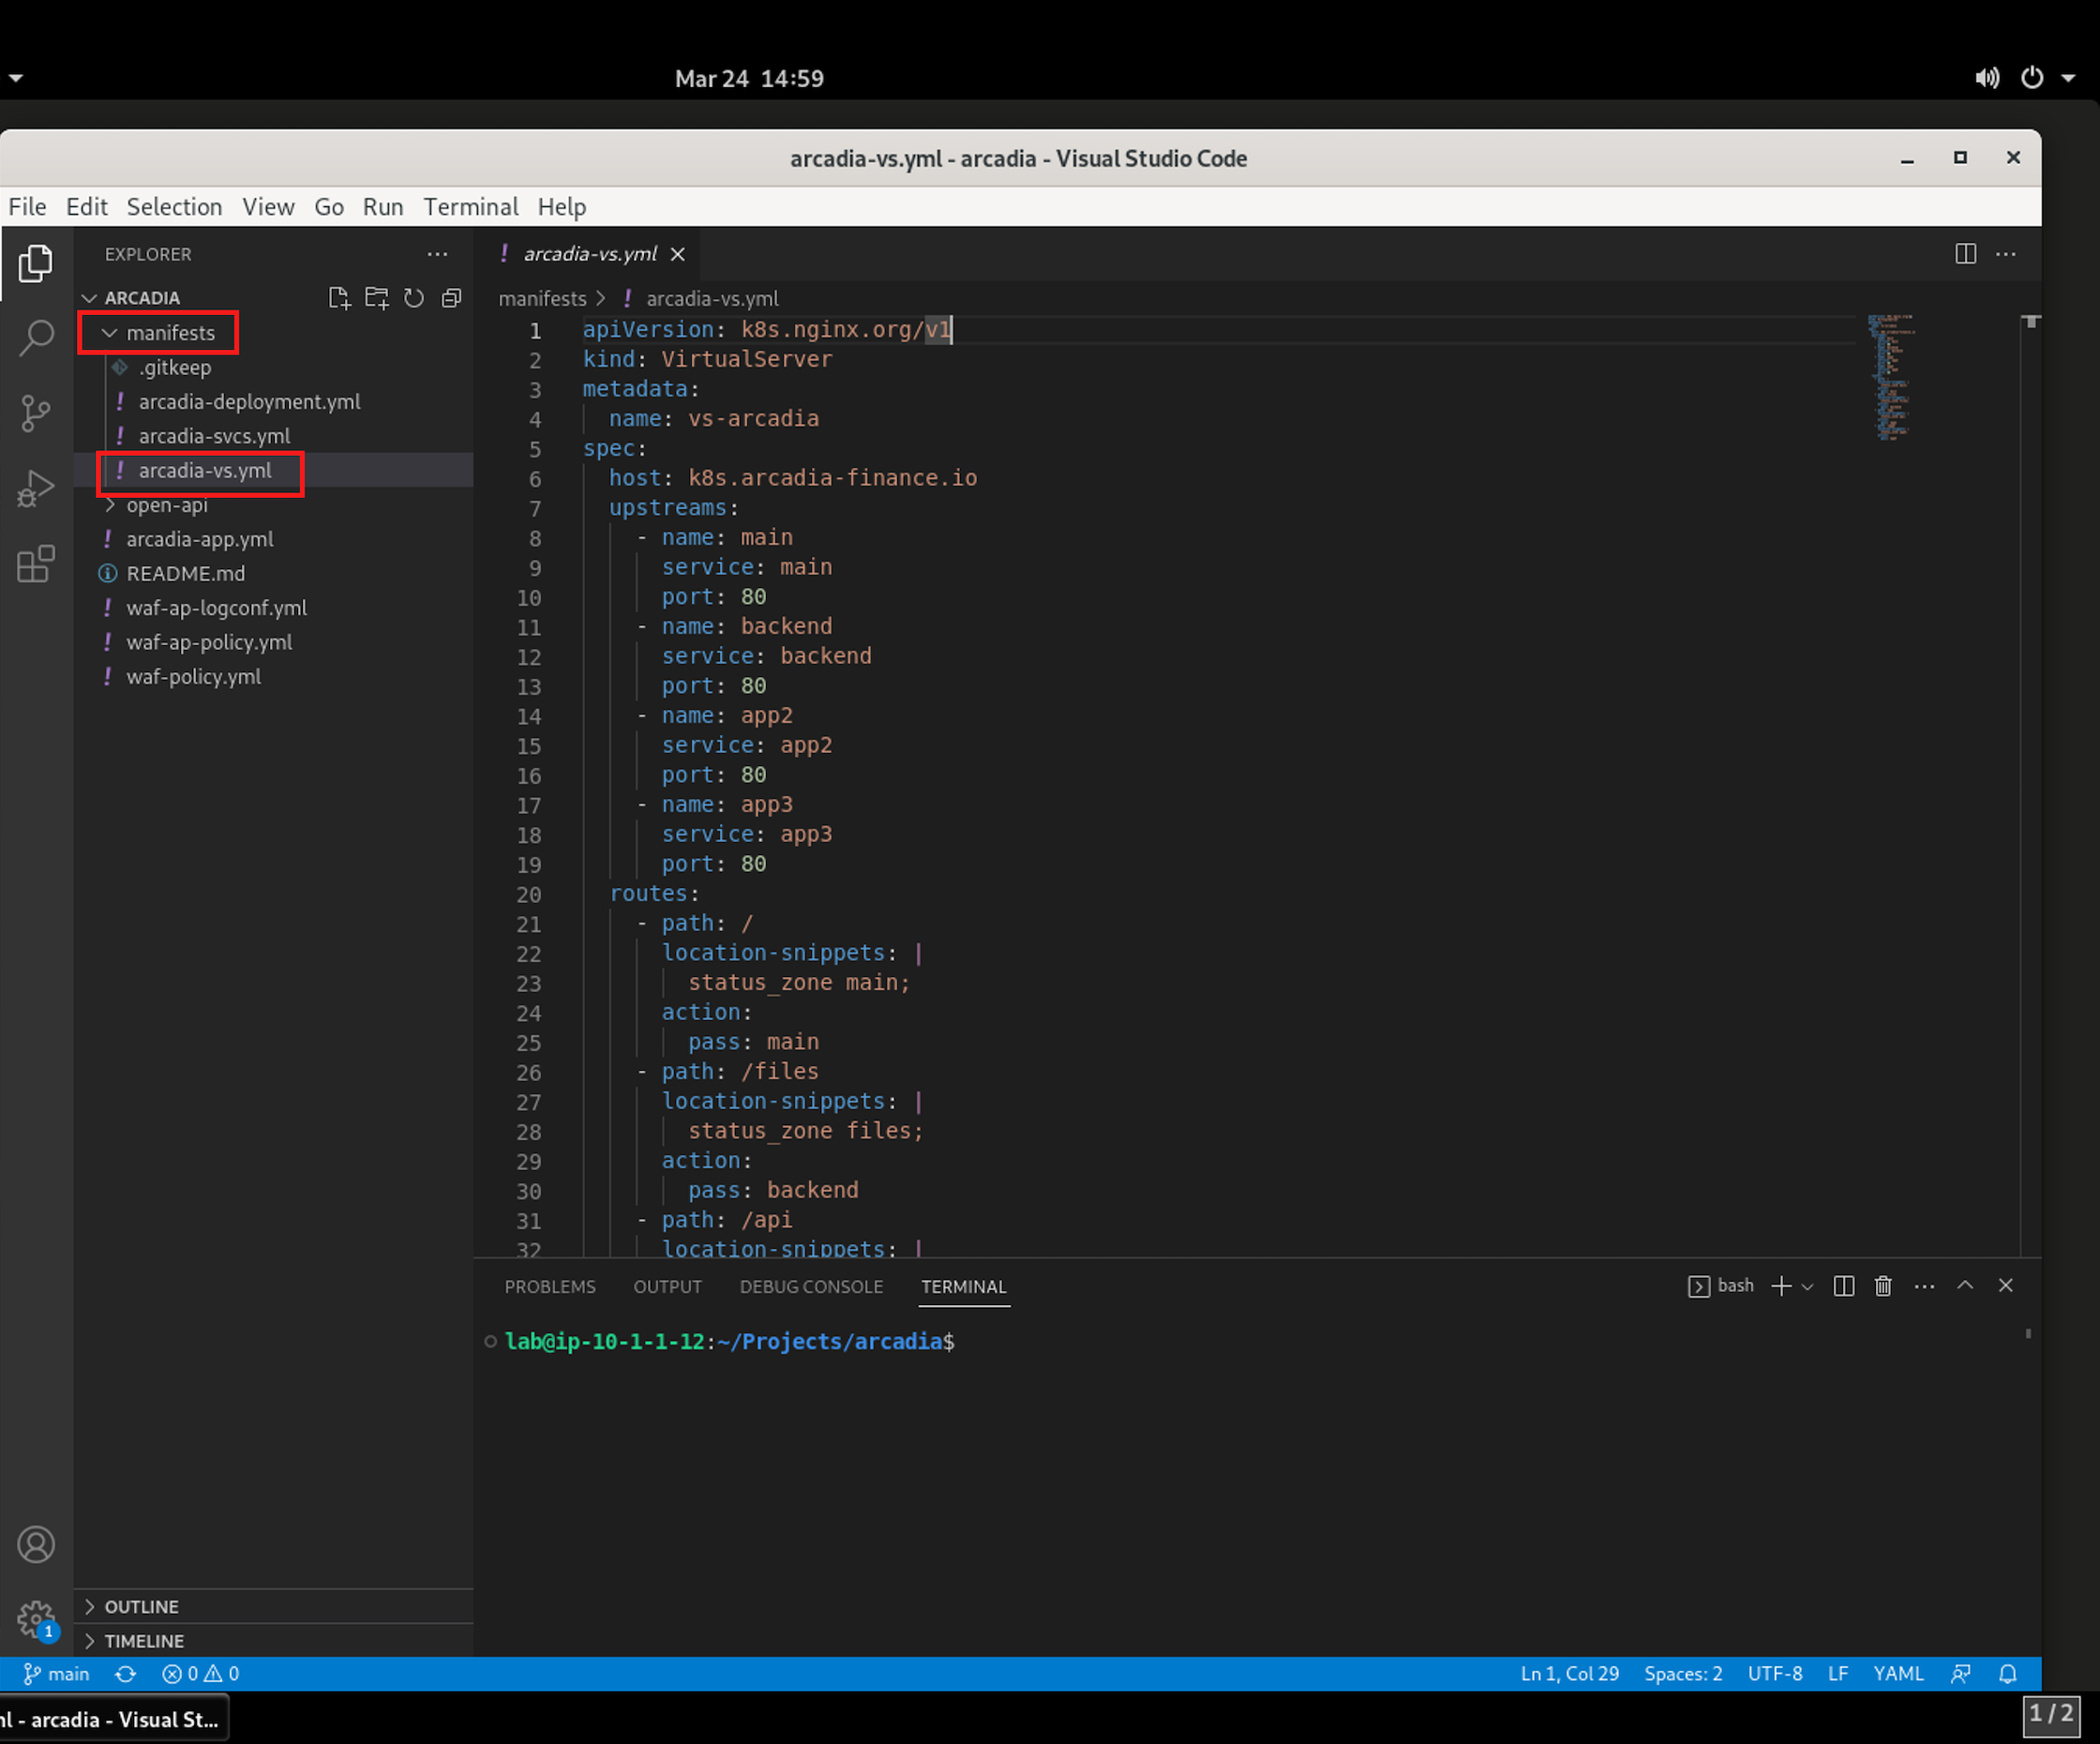
- Now under the manifest directory, you can view the manifests files.
- arcadia-deployment.yml
- arcadia-svcs.yml
- arcadia-vs.yml
For this lab, focus on the arcadia-vs.yml manifest file after you add the security policy files.
- You’ll want to investigate the three new files we’ll be moving into the manifest directory as this is the path Argo CD is monitoring for changes.
- waf-policy.yml (this is the policy that will be attached to the VirtualServer manifest)
- waf-ap-logconf.yml (this defines the logging filters)
- waf-ap-policy.yml (this is the declarative WAF policy with all of the logic)
Caution
We’ll just review these files. Do not make any changes.
First, the policy that is attached to the VirtualServer manifest:
 ---
 apiVersion: k8s.nginx.org/v1
 kind: Policy
 metadata:
   name: waf-policy
 spec:
   waf:
     enable: true
     apPolicy: "arcadia/dataguard-blocking"
     securityLog:
       enable: true
       apLogConf: "arcadia/logconf"
       logDest: "syslog:server=logstash-logstash.default.svc.cluster.local:5144"
Second, the policy for logging and filtering:
---
apiVersion: appprotect.f5.com/v1beta1
kind: APLogConf
metadata:
  name: logconf
spec:
  content:
    format: default
    max_message_size: 64k
    max_request_size: any
  filter:
    request_type: blocked
Finally, the WAF policy:
 ---
 apiVersion: appprotect.f5.com/v1beta1
 kind: APPolicy
 metadata:
   name: dataguard-blocking
 spec:
   policy:
     name: dataguard_blocking
     template:
       name: POLICY_TEMPLATE_NGINX_BASE
     applicationLanguage: utf-8
     enforcementMode: blocking
     blocking-settings:
       violations:
       - name: VIOL_DATA_GUARD
         alarm: true
         block: true
     data-guard:
       enabled: true
       maskData: true
       creditCardNumbers: true
       usSocialSecurityNumbers: true
       enforcementMode: ignore-urls-in-list
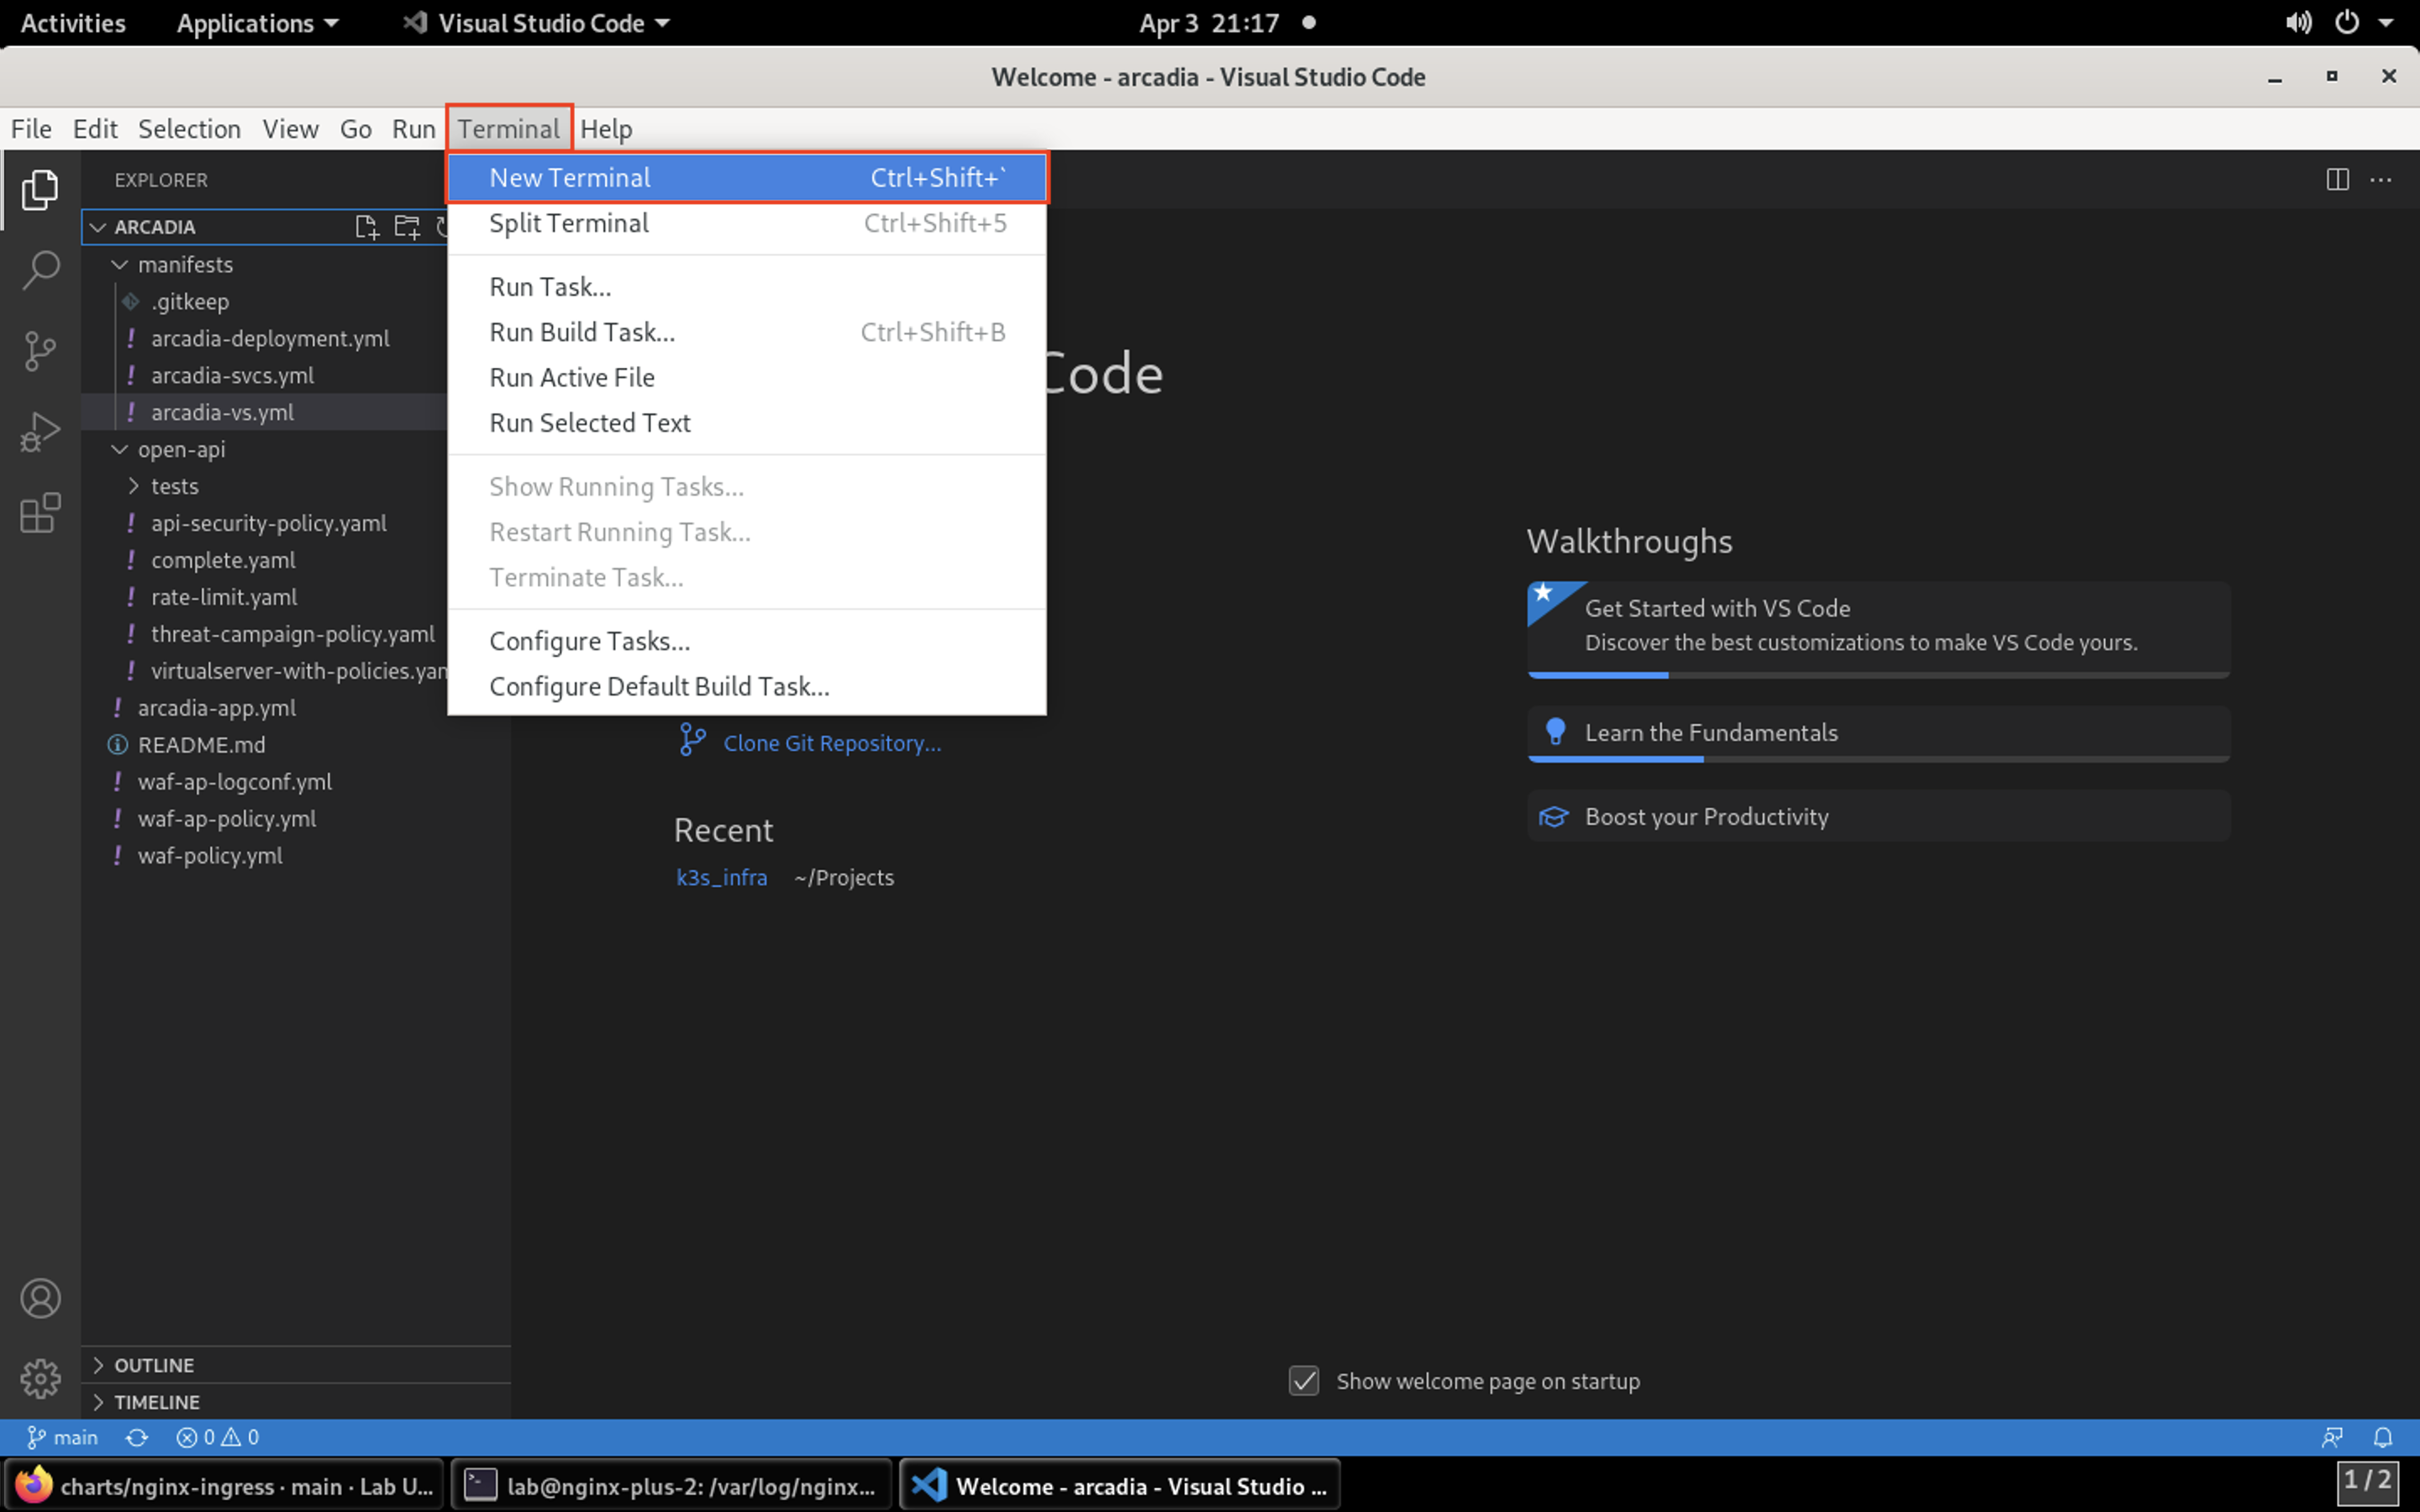
- Open a new command prompt window by navigating to Terminal > New Terminal in the menu bar.
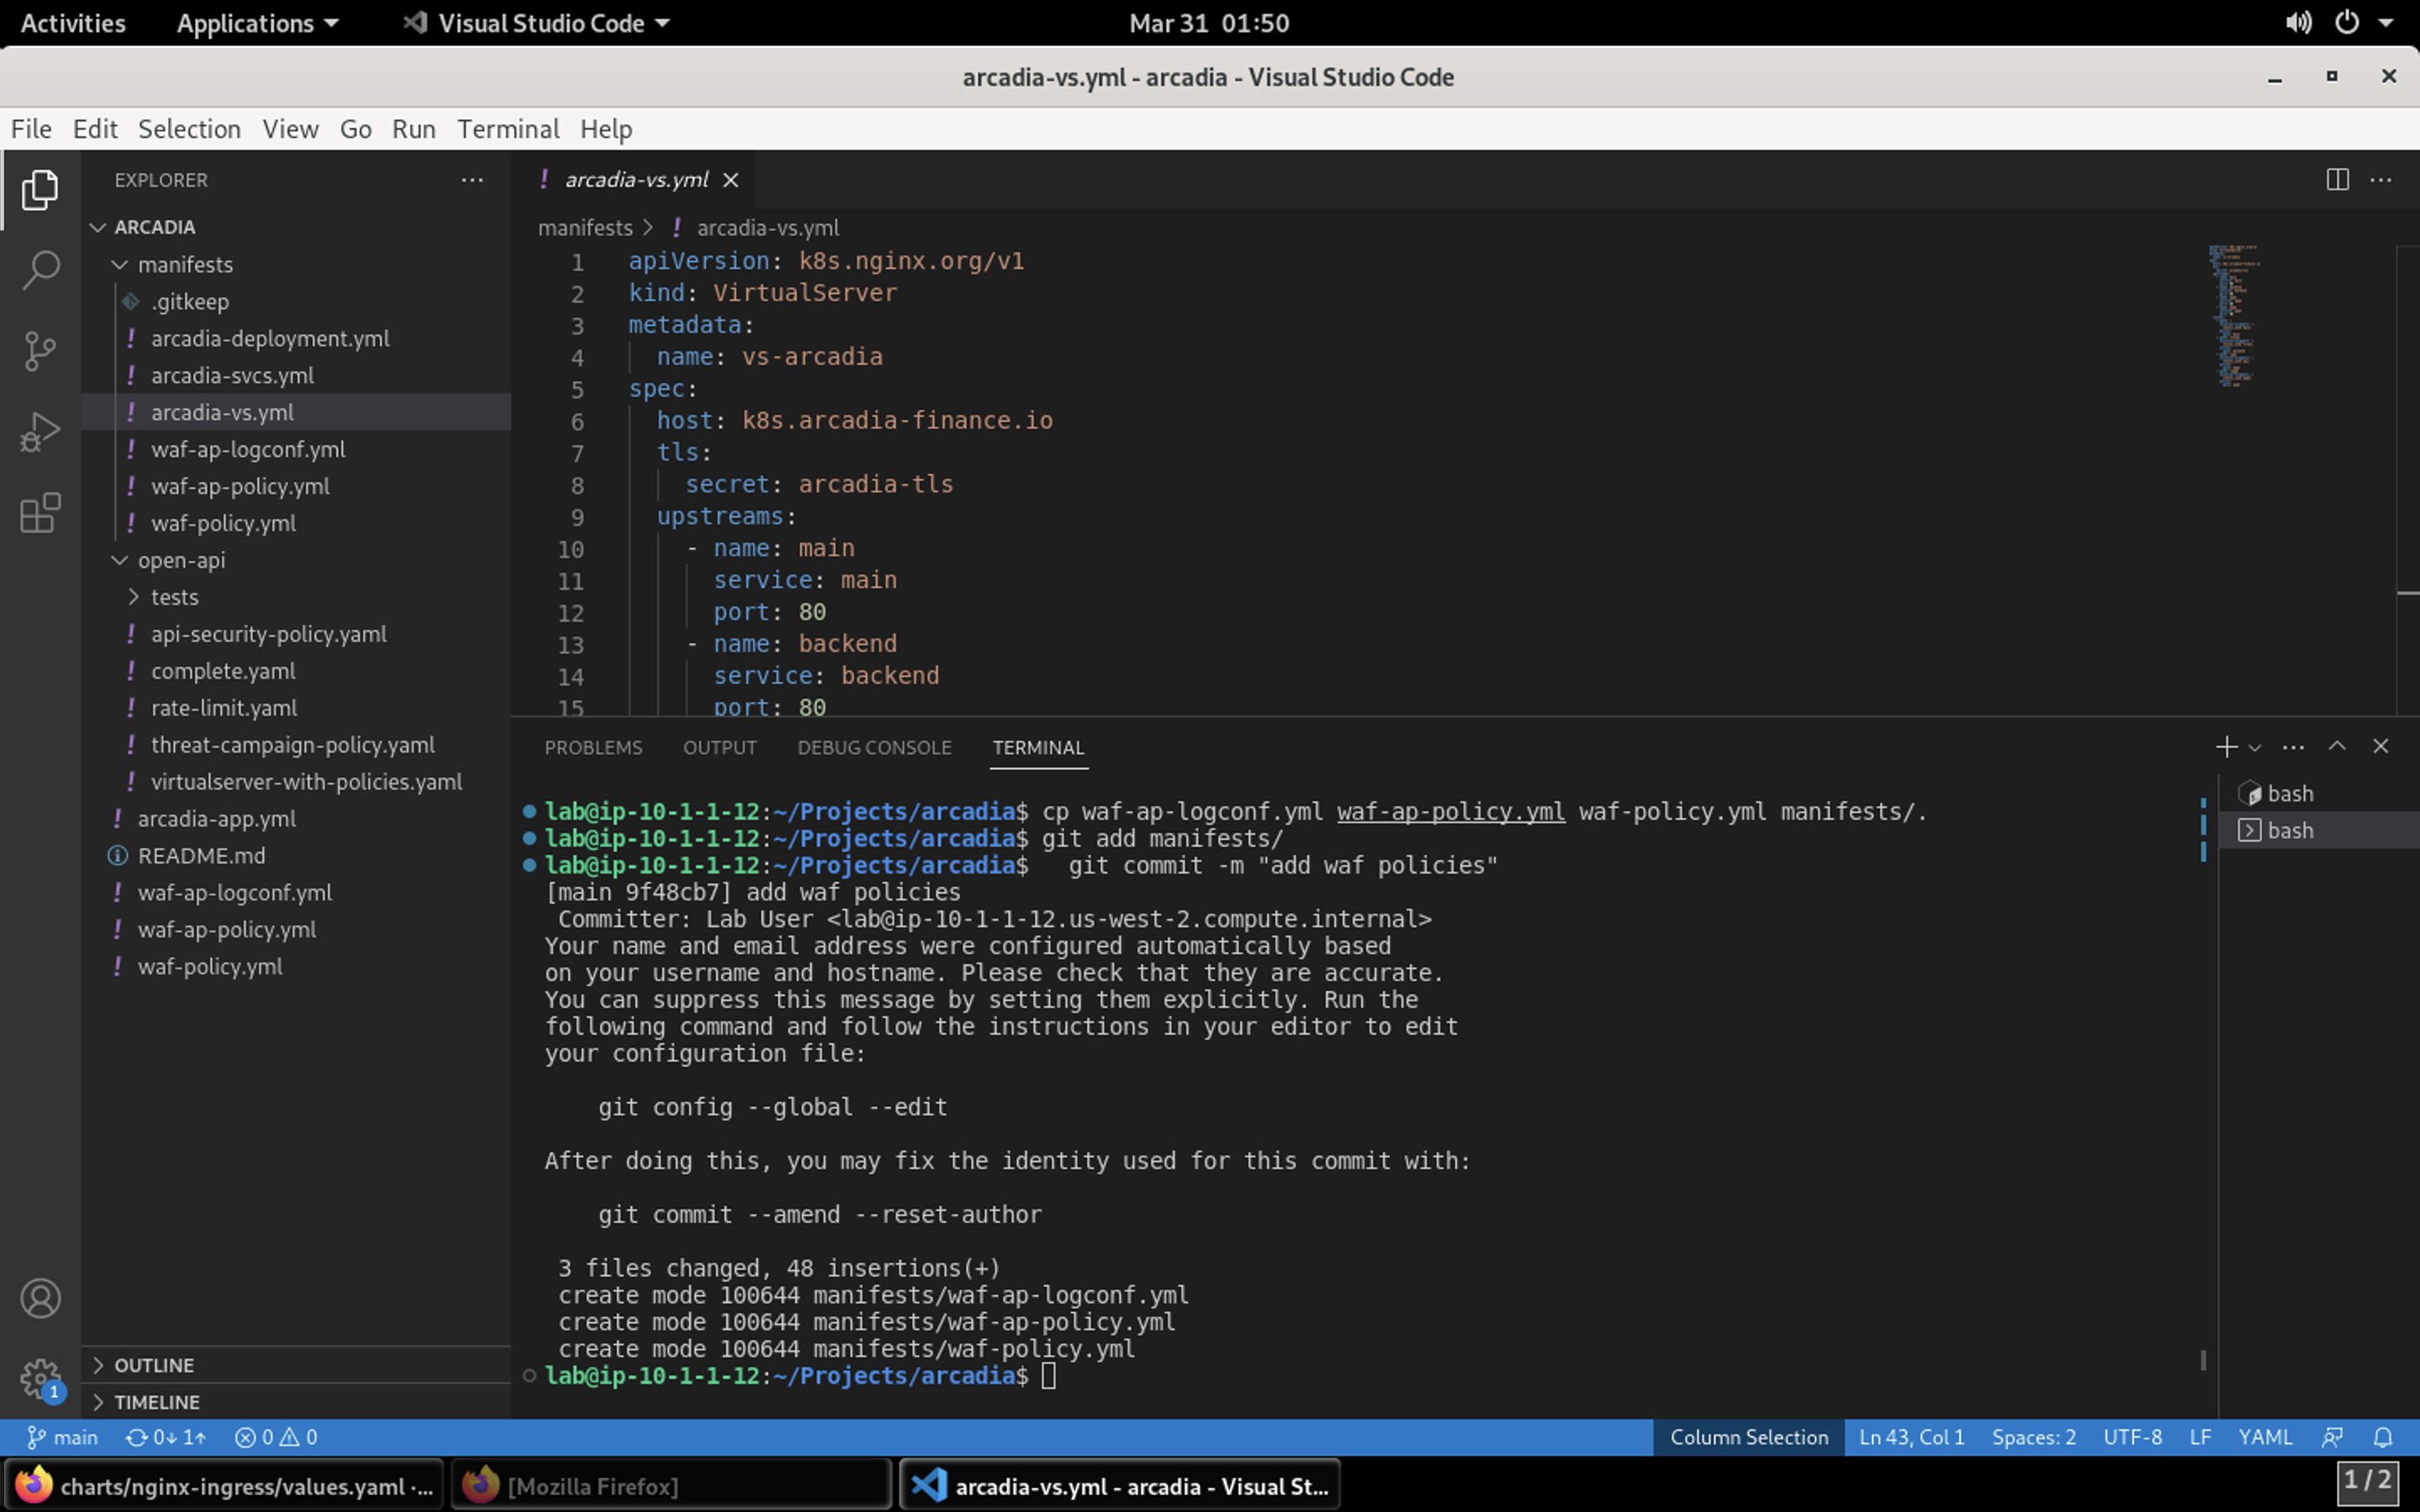
- Now, copy the these files over to the manifests directory so NGINX App Protect can enforce the policy. Use the Terminal window at the bottom of VSCode to issue these commands:
cd ~/Projects/arcadia
cp waf-ap-logconf.yml waf-ap-policy.yml waf-policy.yml manifests/.
git add manifests/
git commit -m "add waf policies"
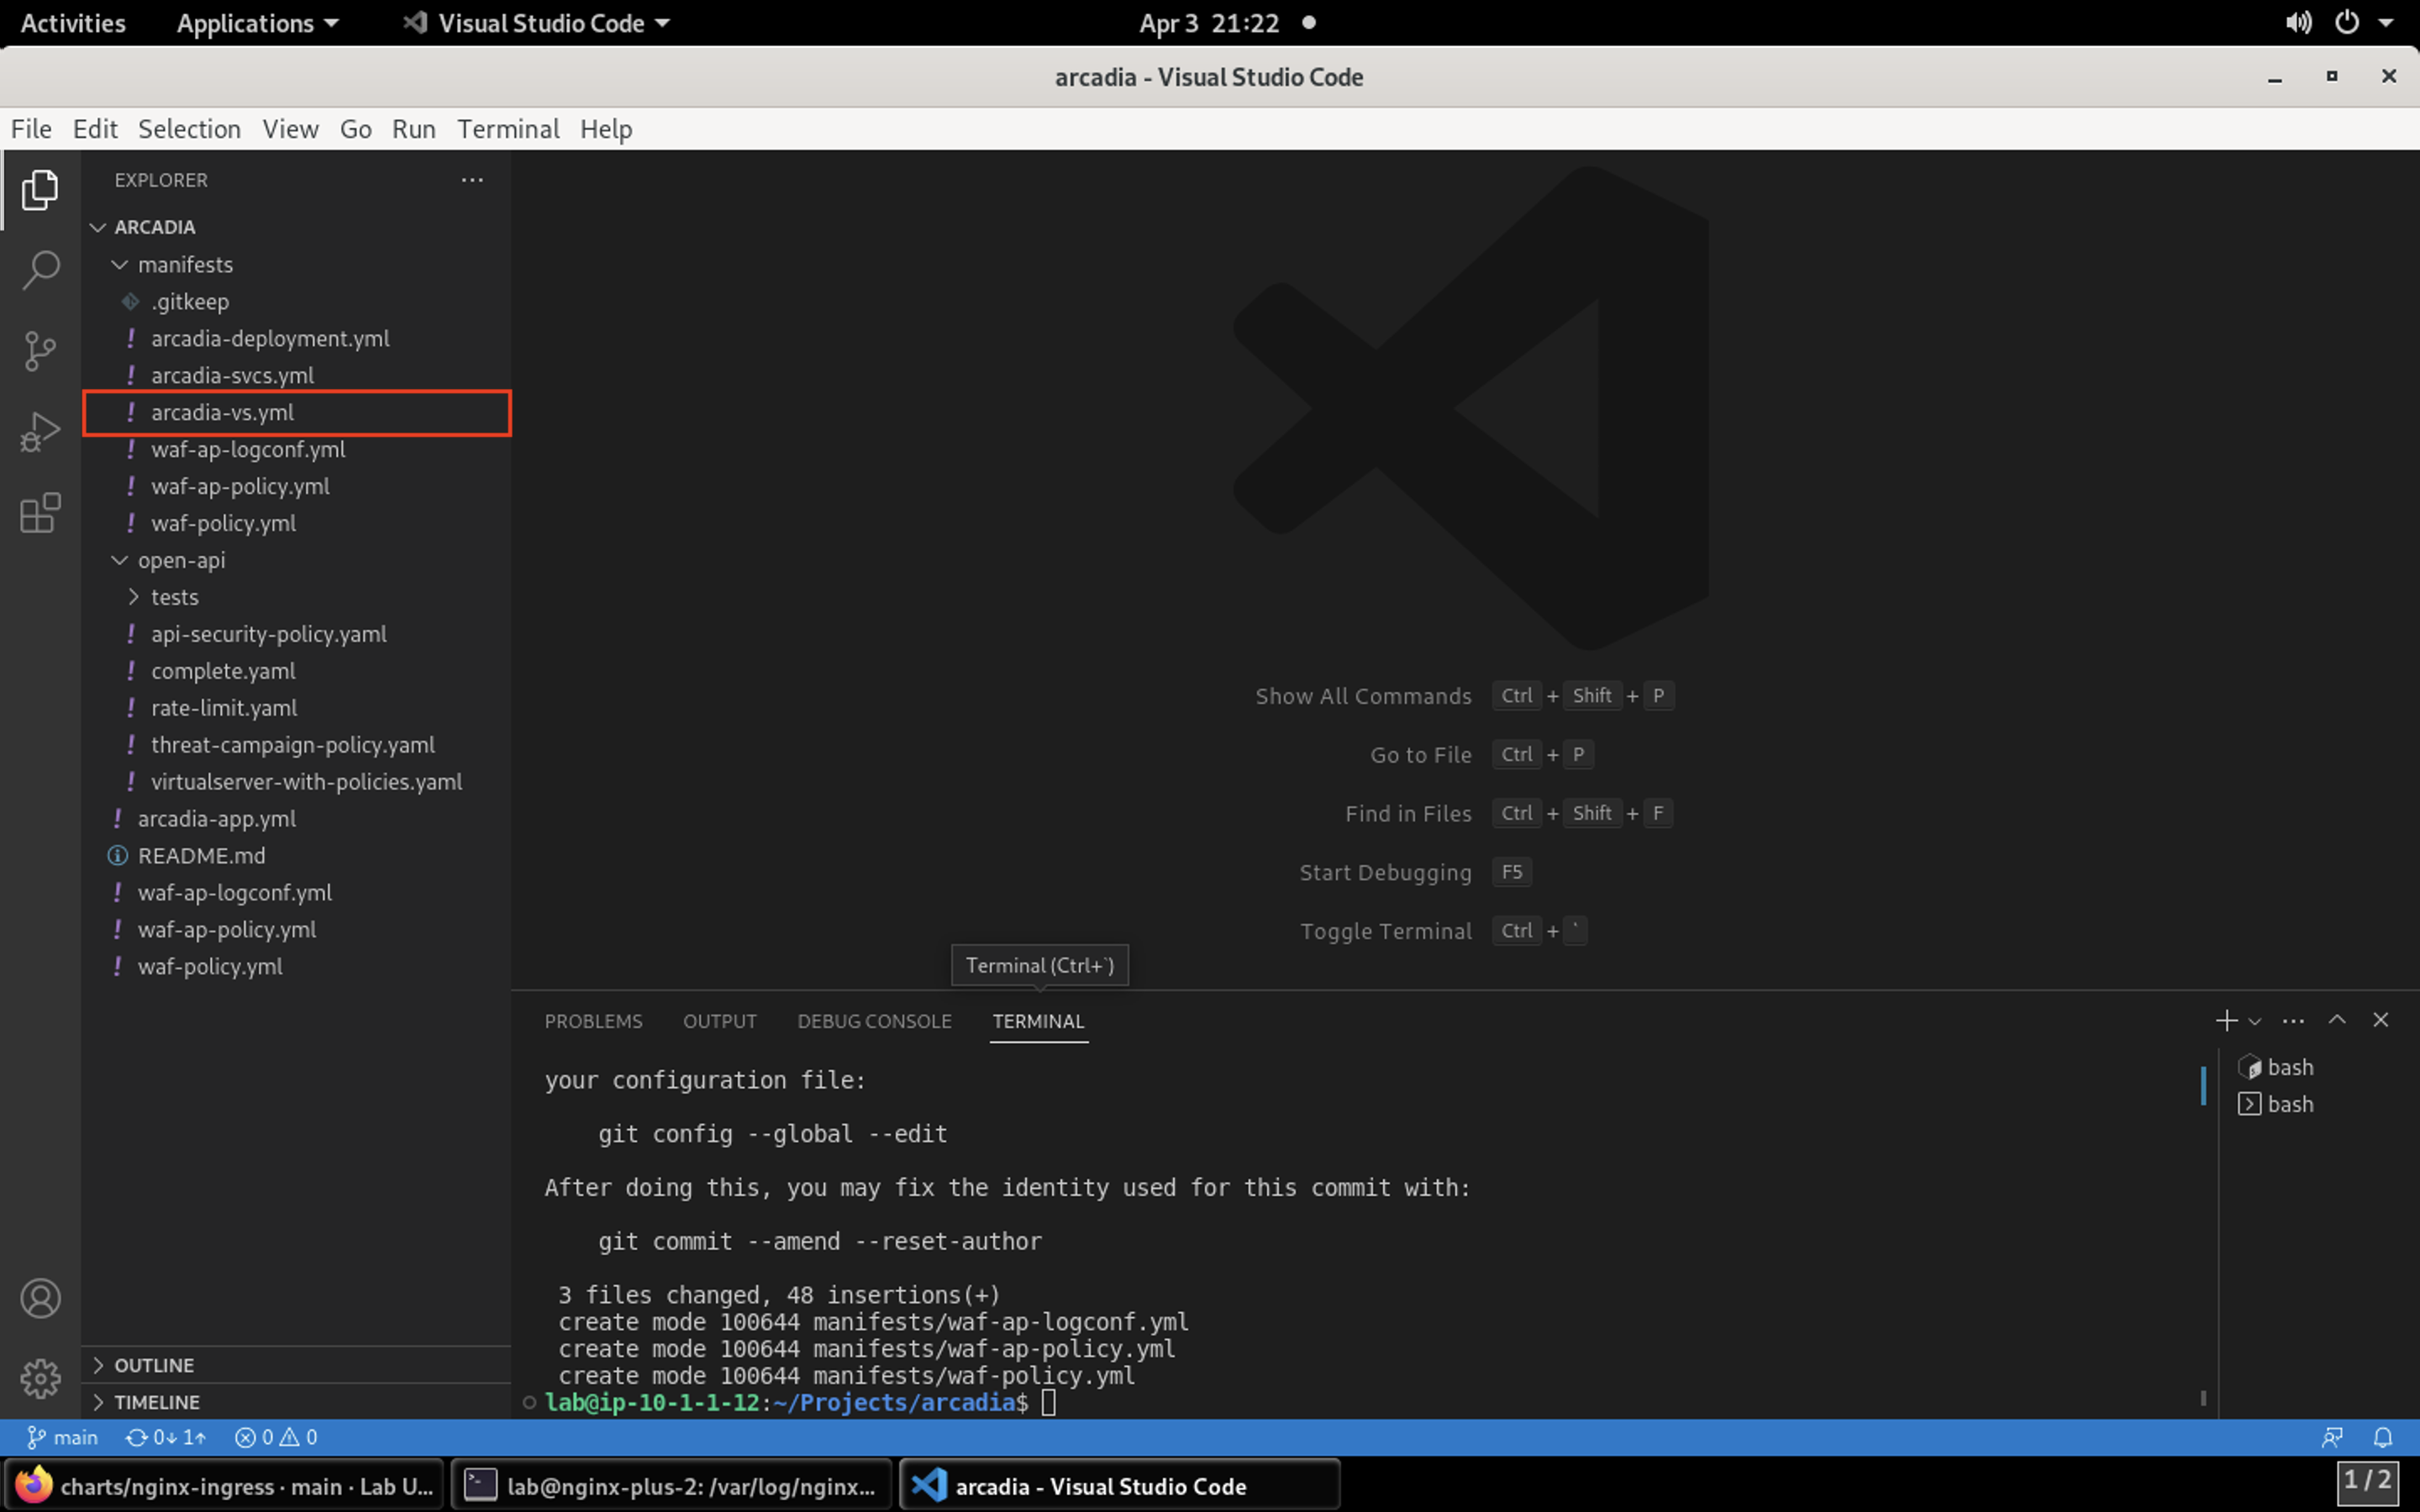
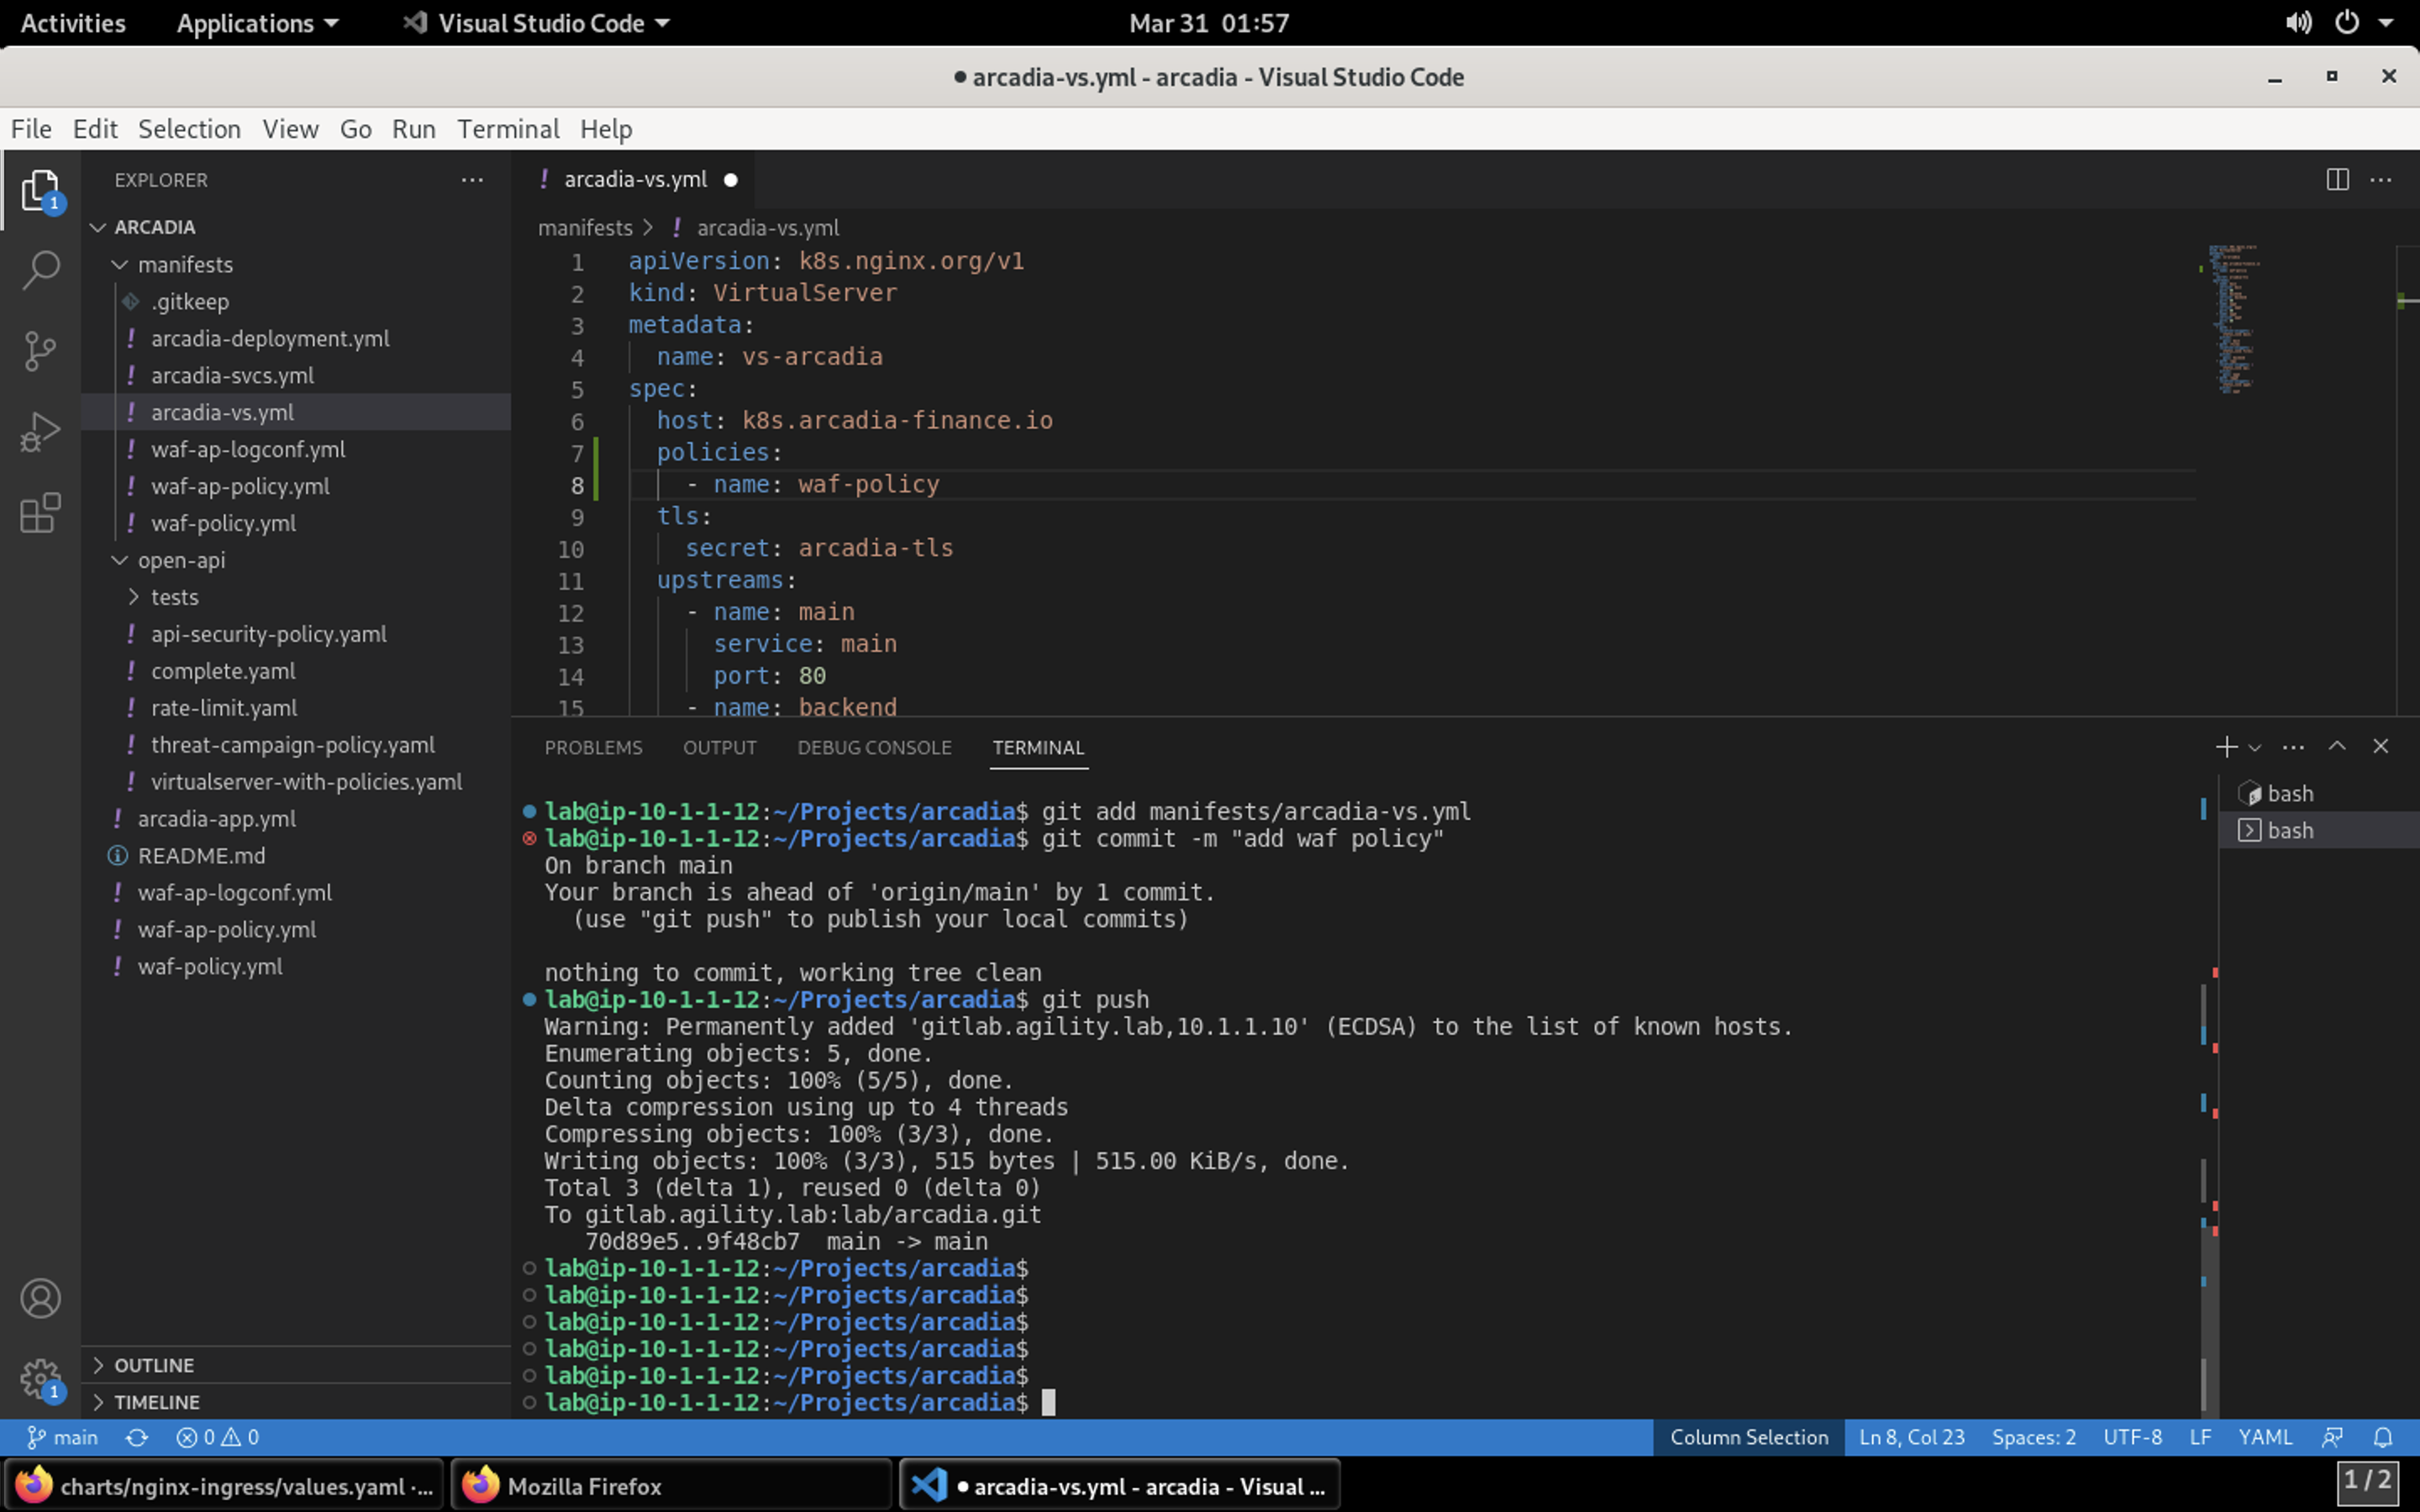
- Now, edit the arcadia-vs.yml manifest to now include the App Protect policy. Open the file by selecting the filename in the left navigation pane.
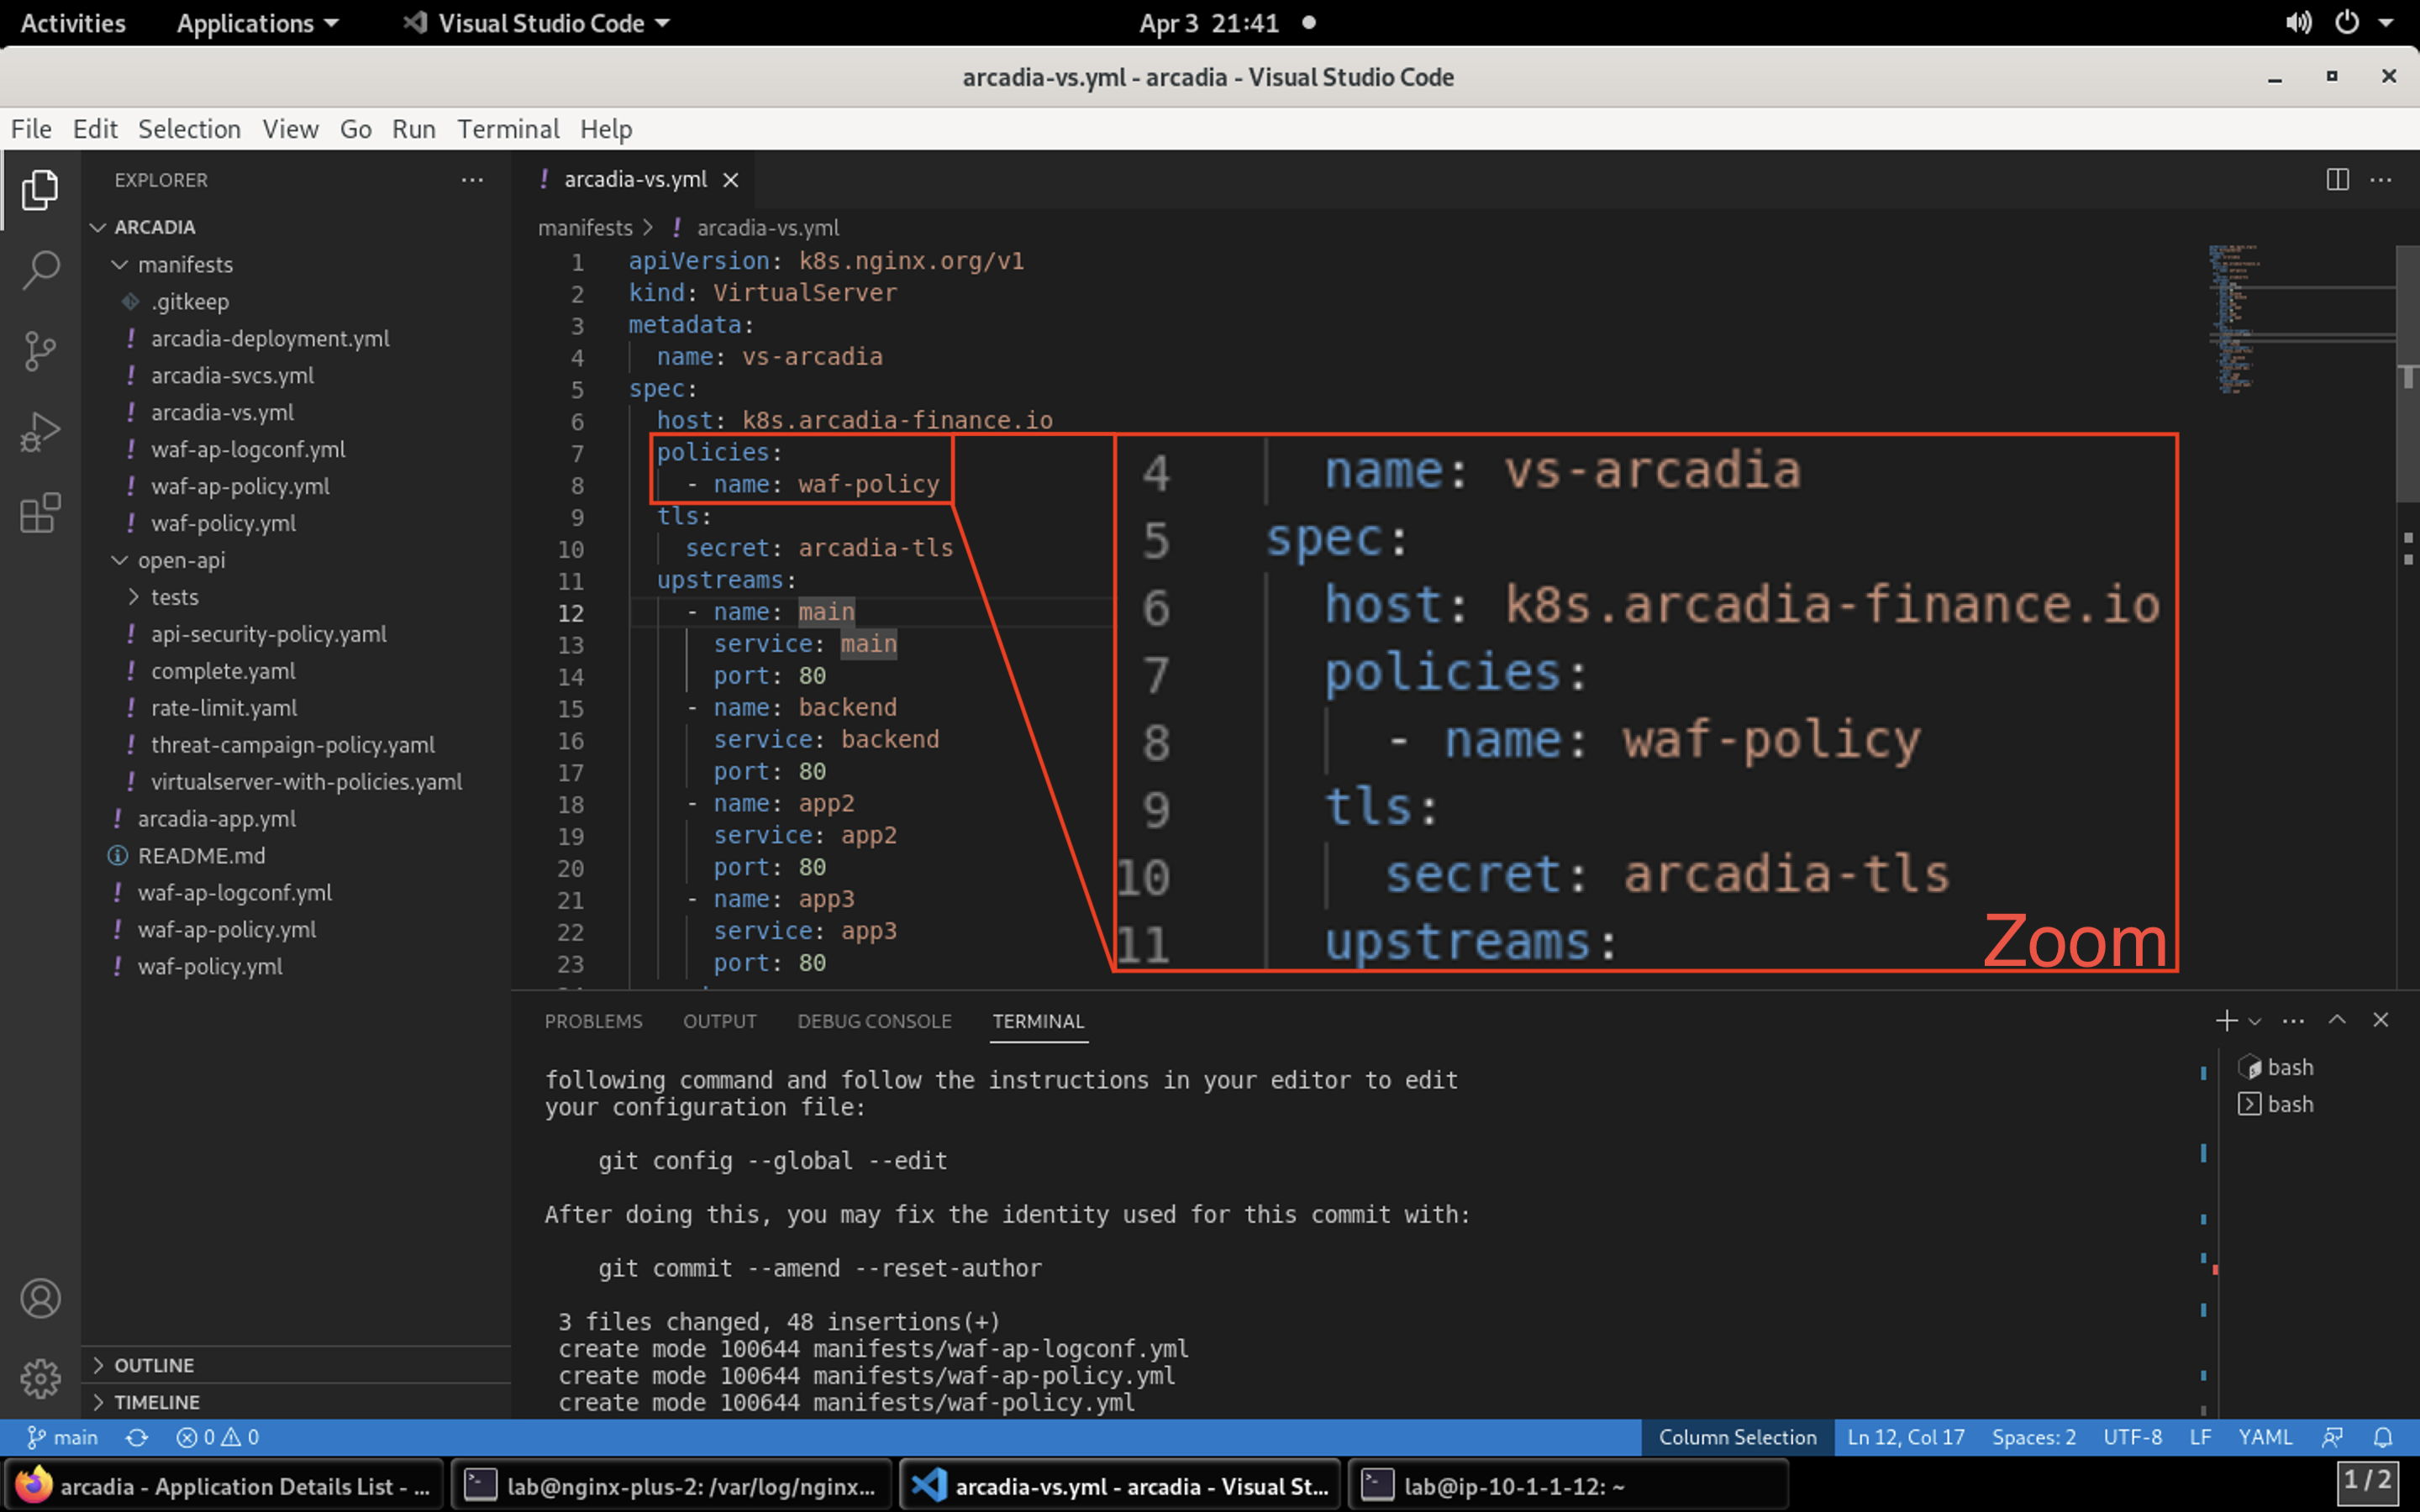
Warning
Please reference the image below as YAML is very strict with indention. After line 6 you’ll insert the new lines.
policies:
  - name: waf-policy
- Now that you’ve updated arcadia-vs.yml it’s time to push the updates back to Gitlab. Please run these commands in the terminal window:
git add manifests/arcadia-vs.yml
git commit -m "add waf policy"
git push
Result
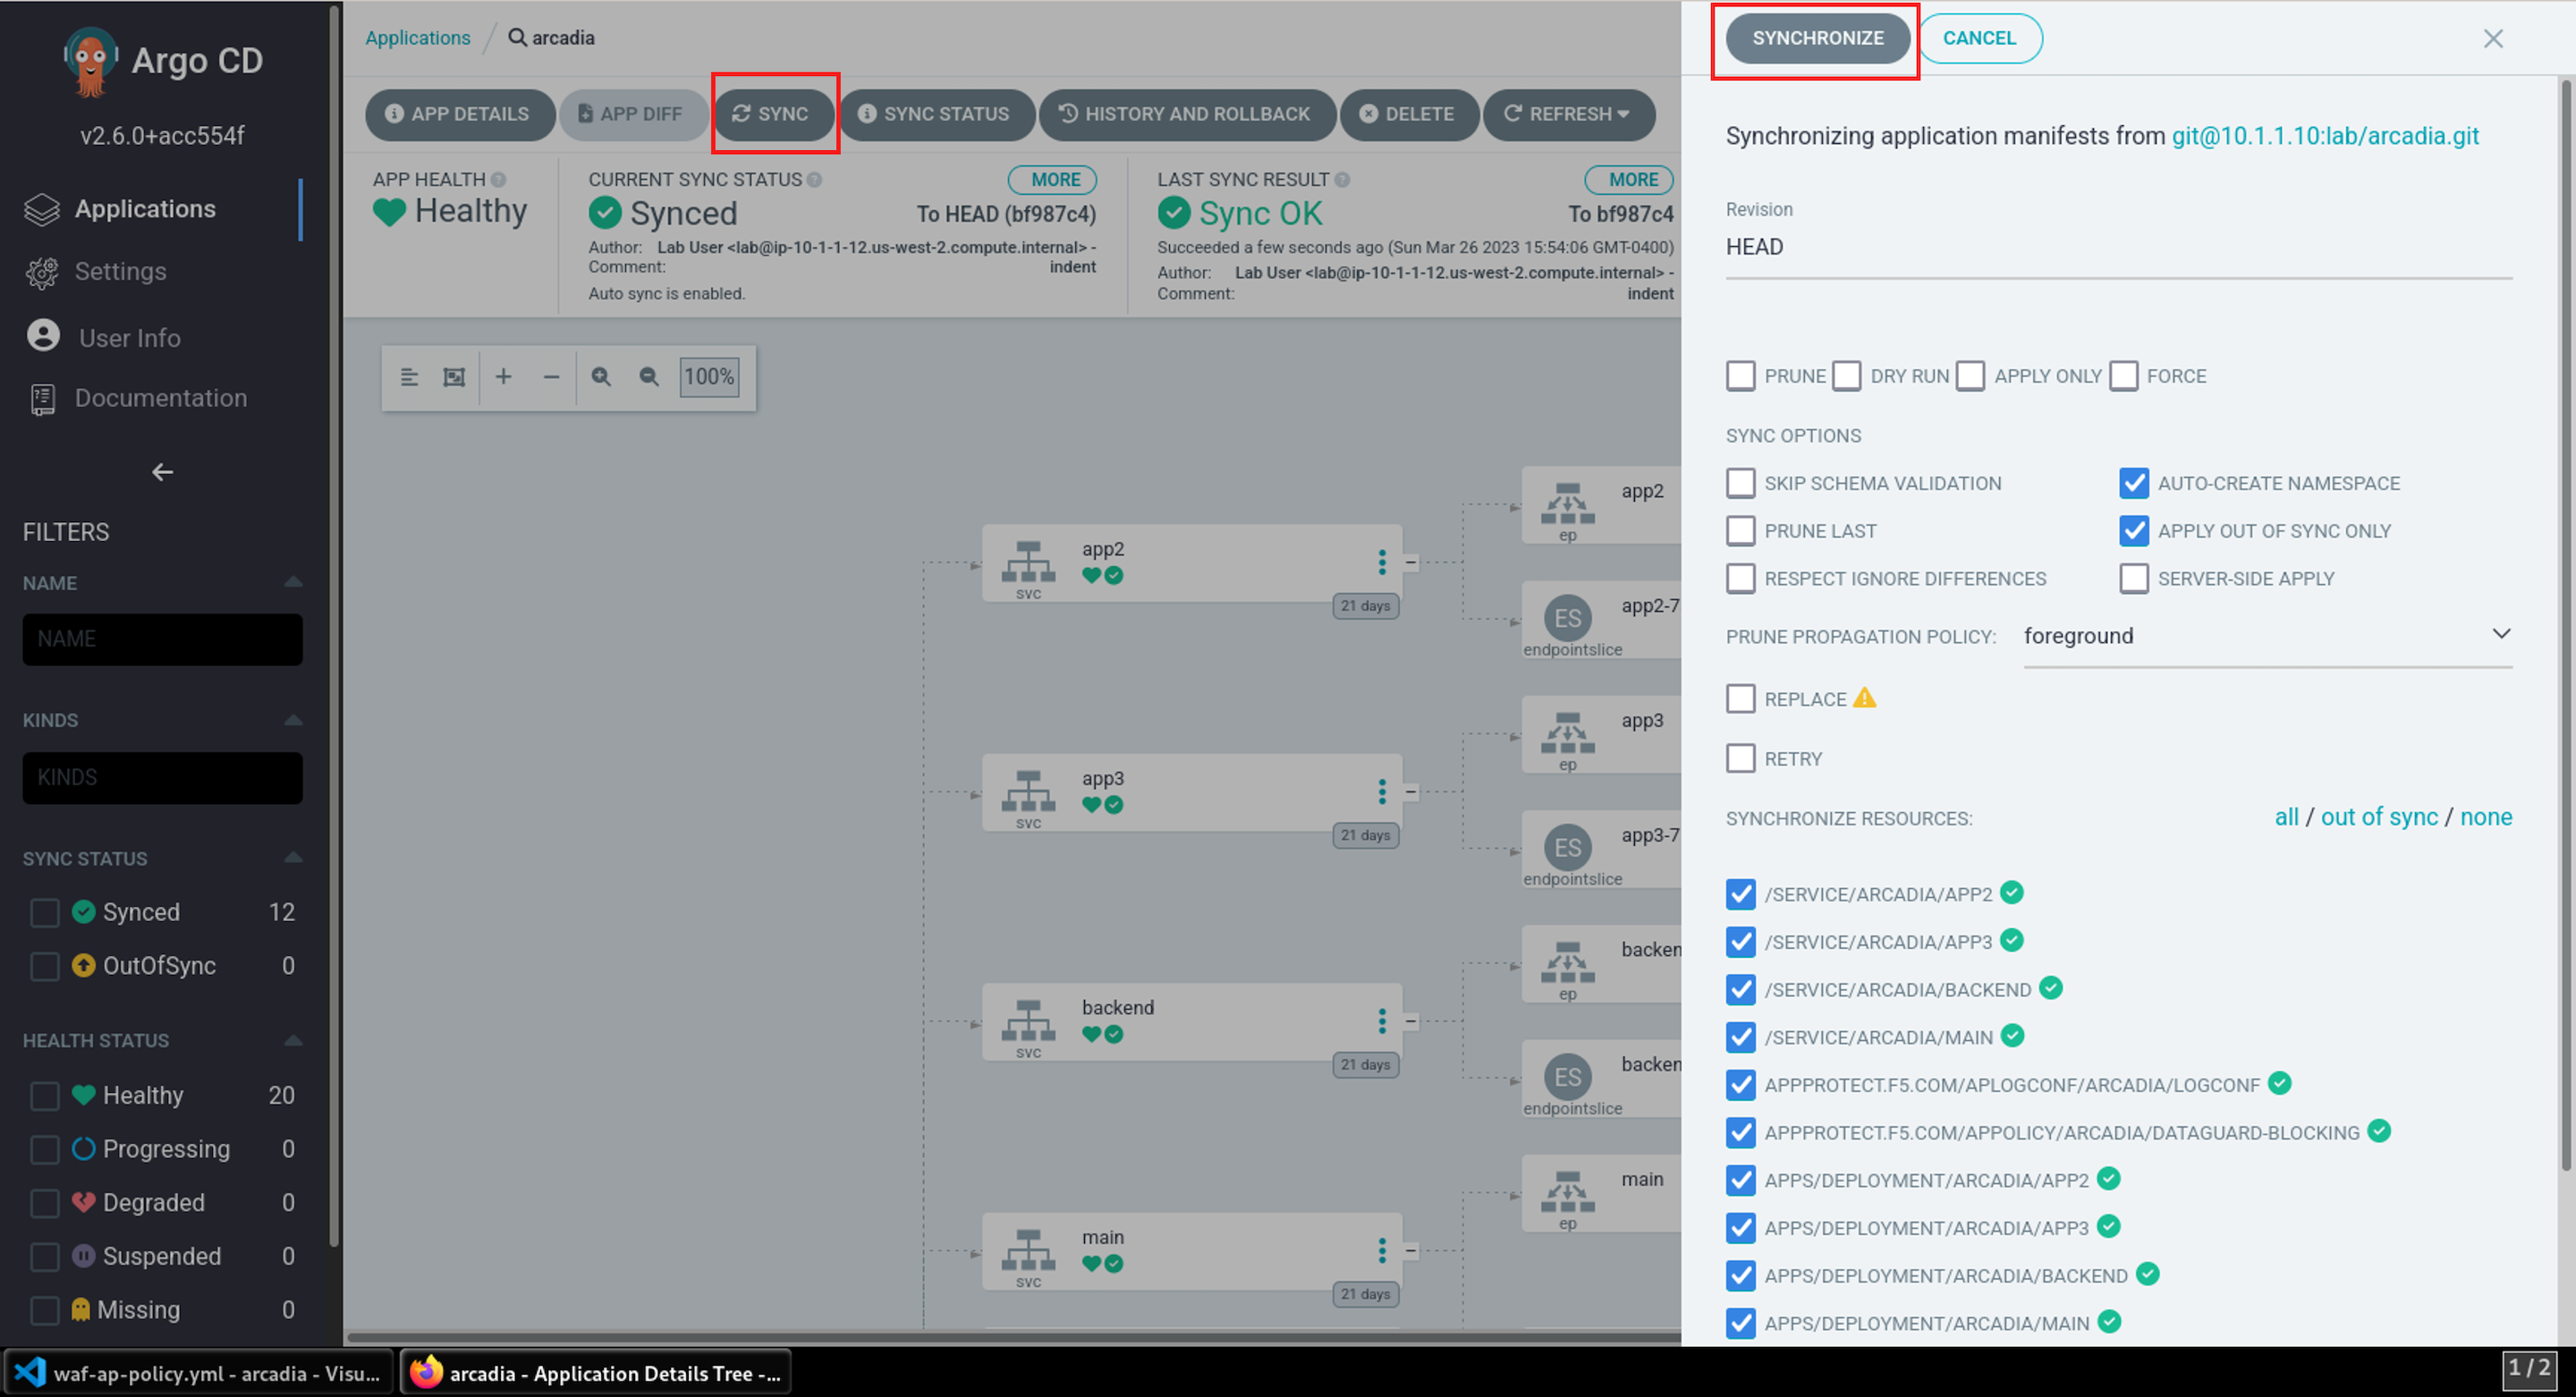
- To make certain the changes are deployed, manually sync Argo with the Git repo. In Firefox, open Argo CD by clicking on the Argo bookmark.
- Click on the Arcadia application tile. Clicking on Sync will open a side panel to click Synchronize. This will pull the changes you submitted to Gitlab and deploy into Kubernetes.
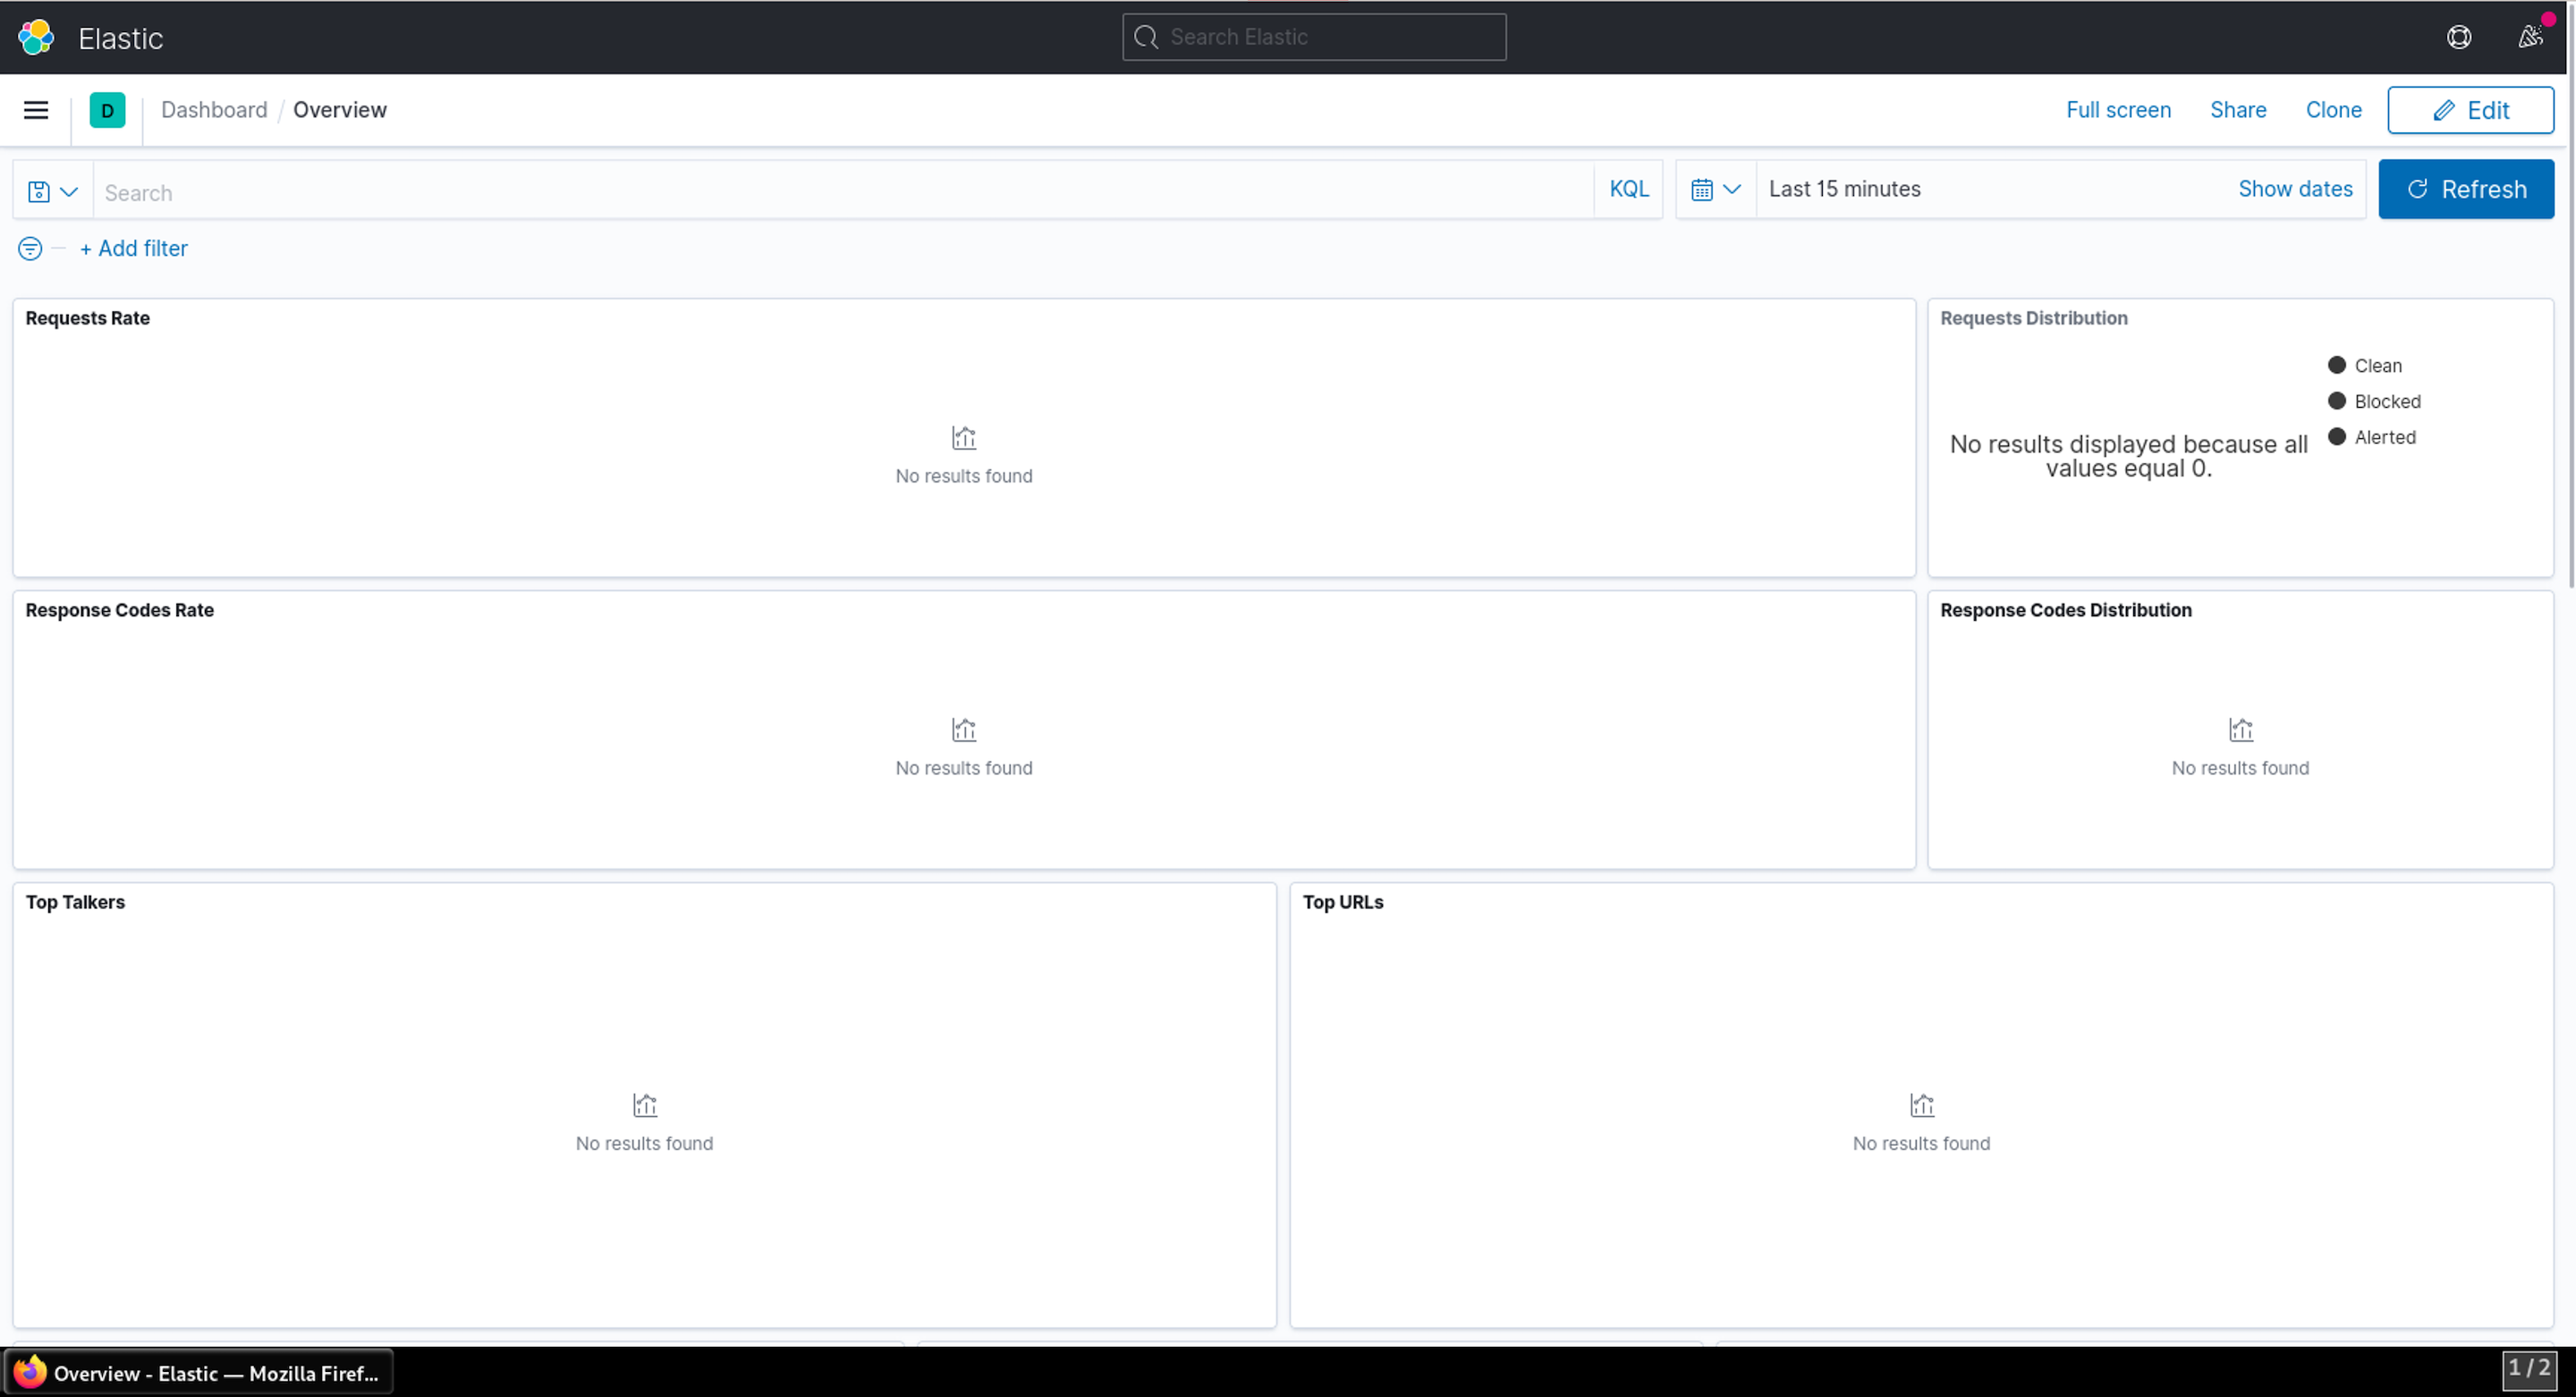
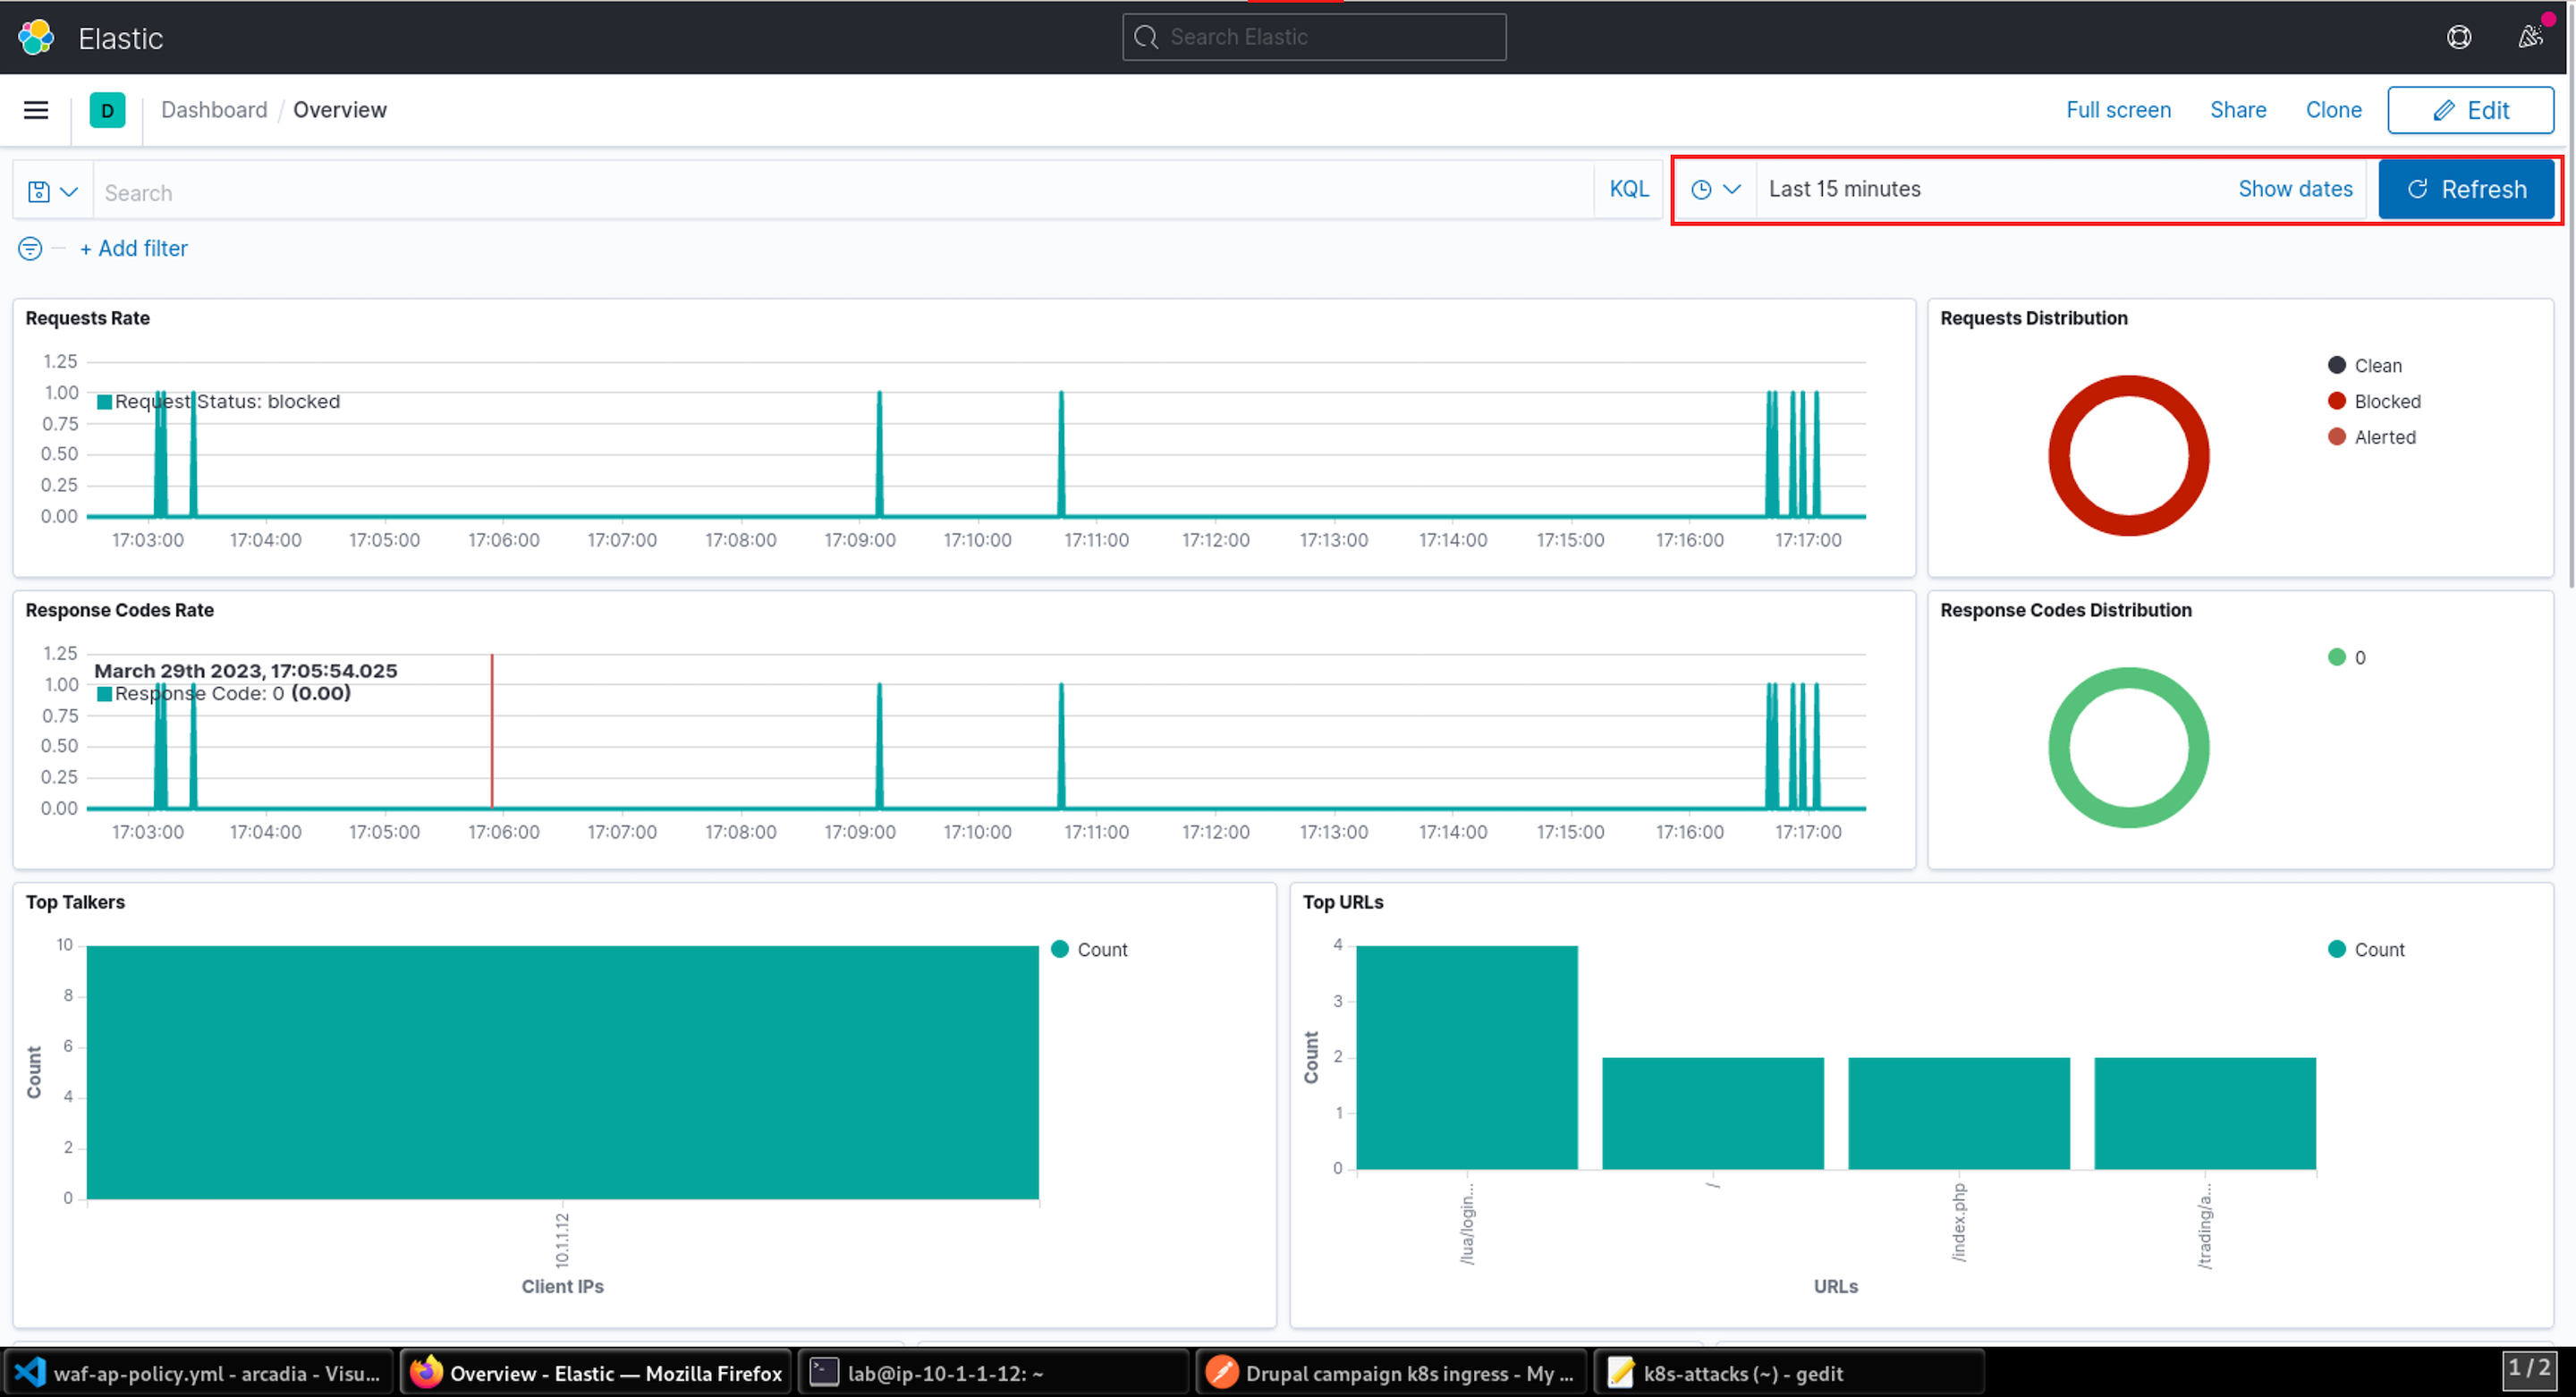
- Before you launch attacks at the Arcadia site, open the ELK bookmark in a new tab in Firefox so you can view the attacks and view Support IDs.
Note
Since there is not yet any application traffic, the dashboard will be empty.
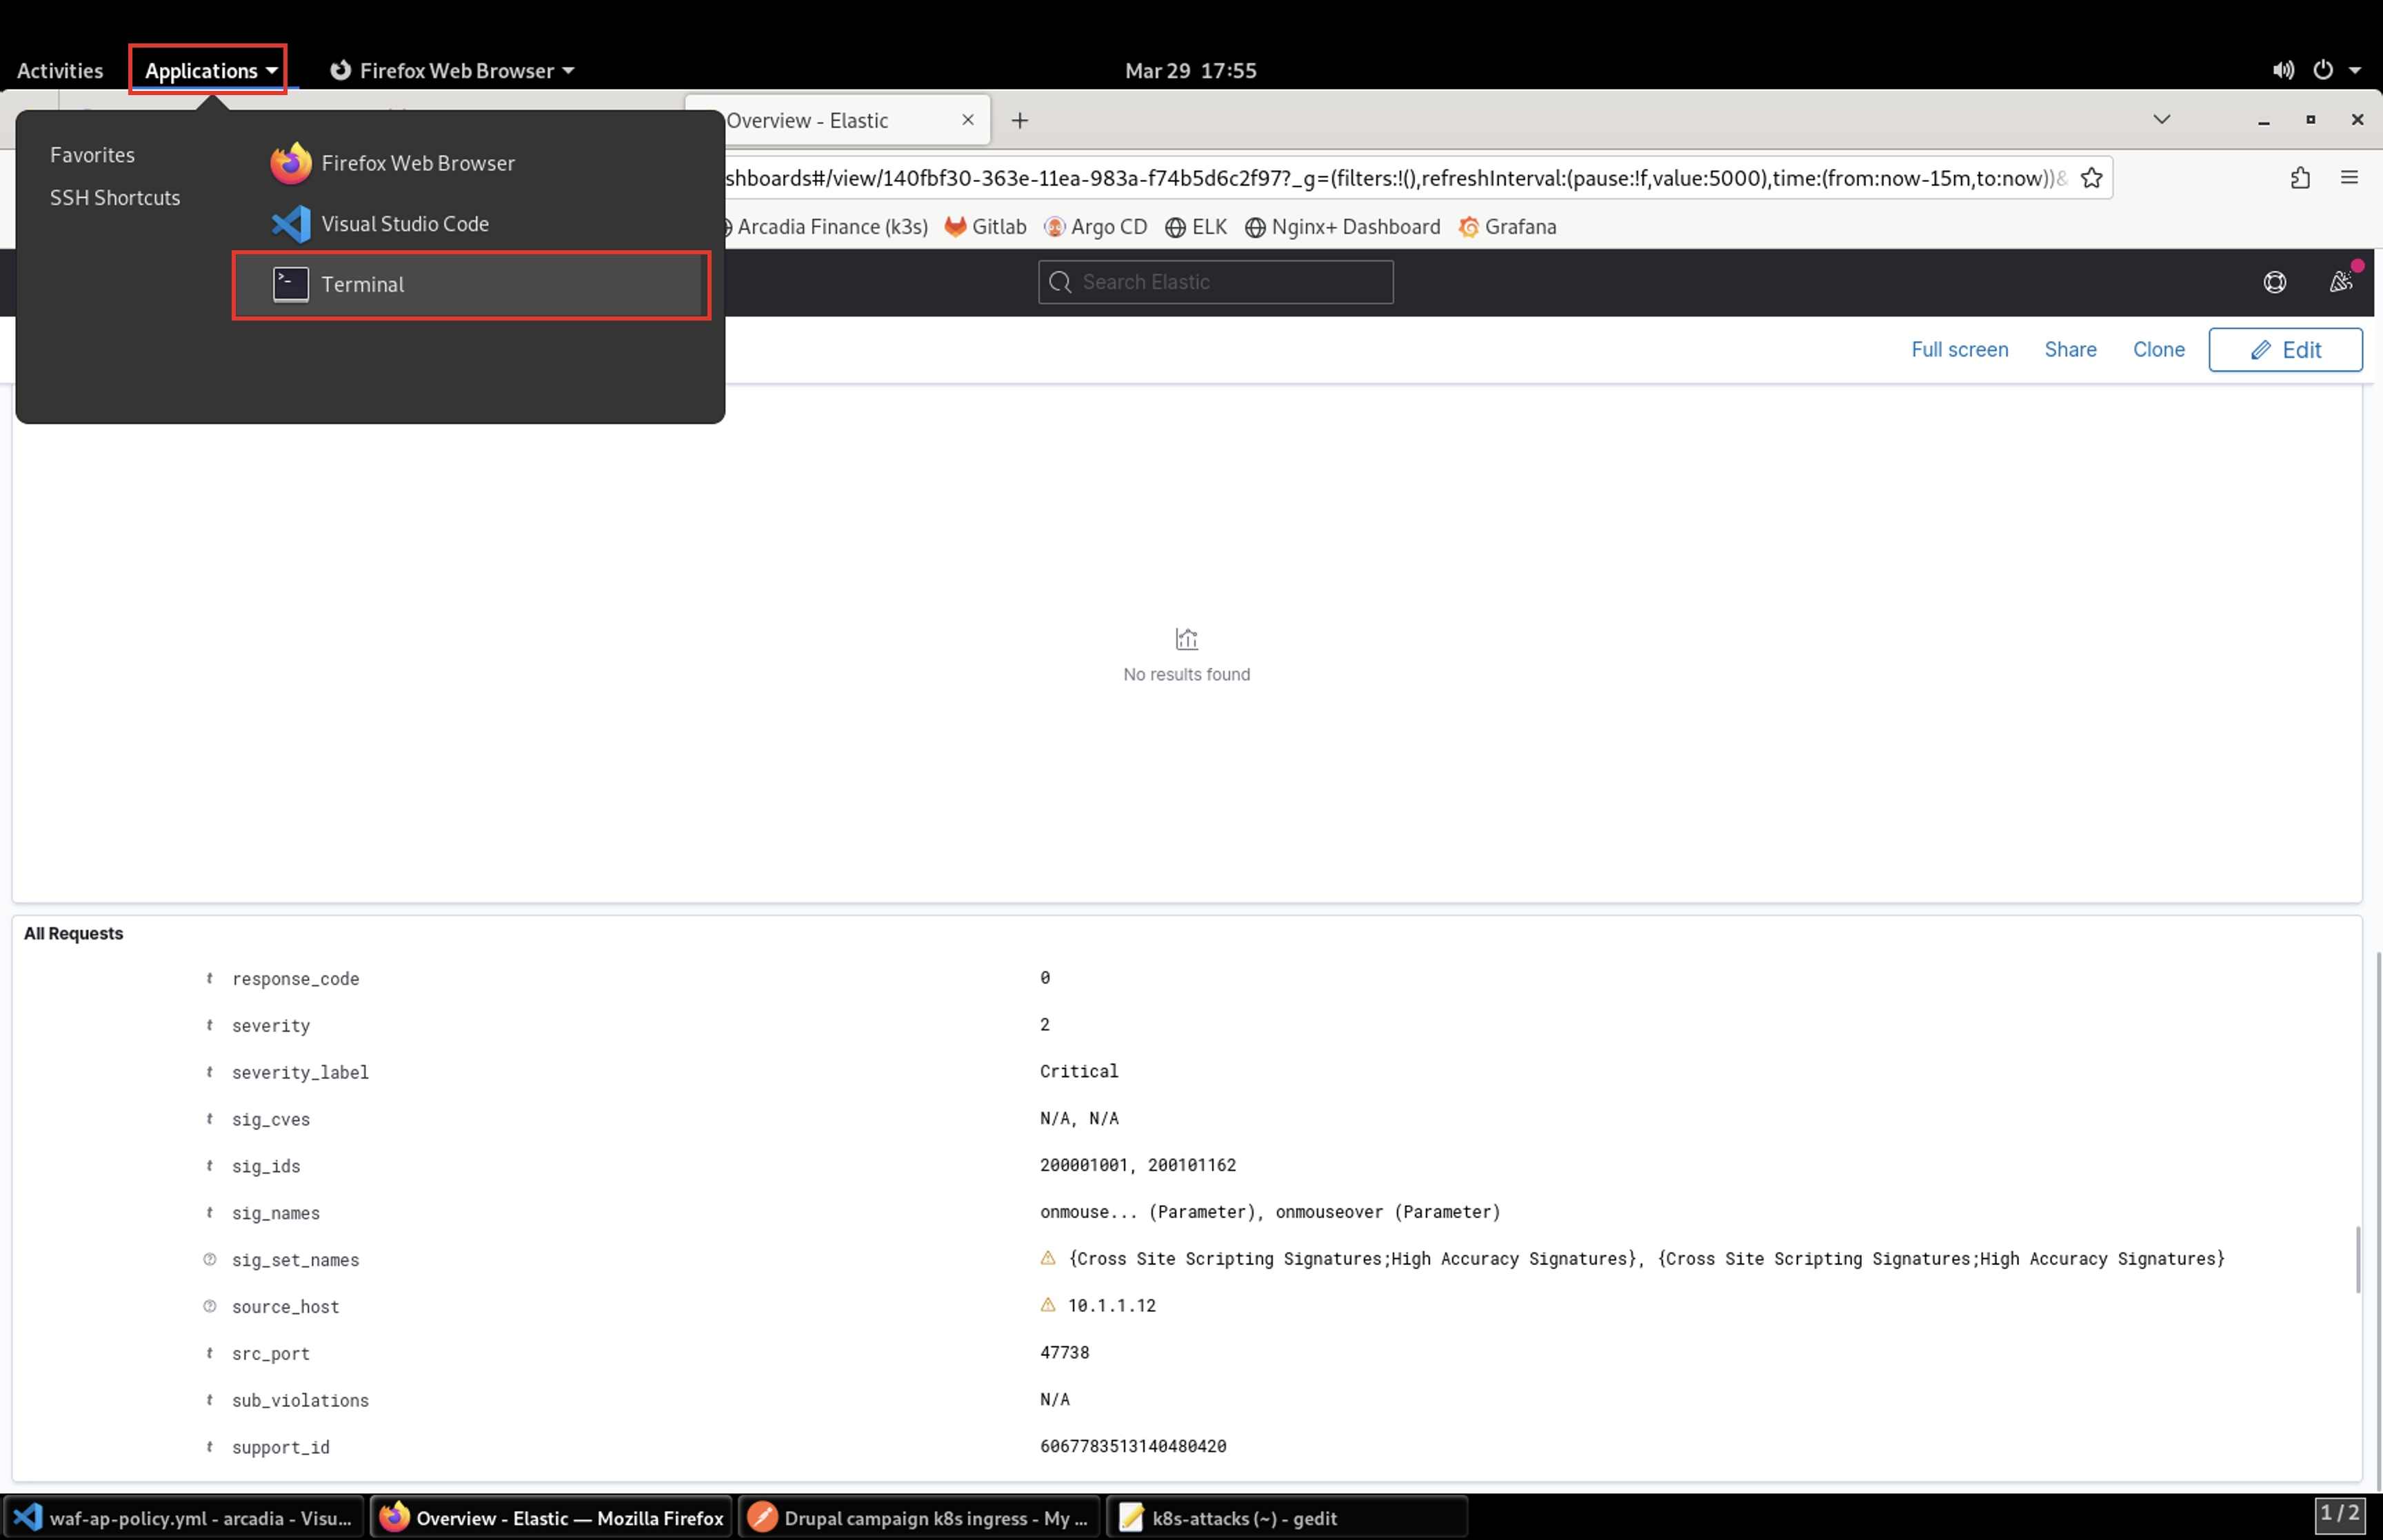
- Now, launch attacks against the Arcadia site. From the Applications drop-down, select Terminal.
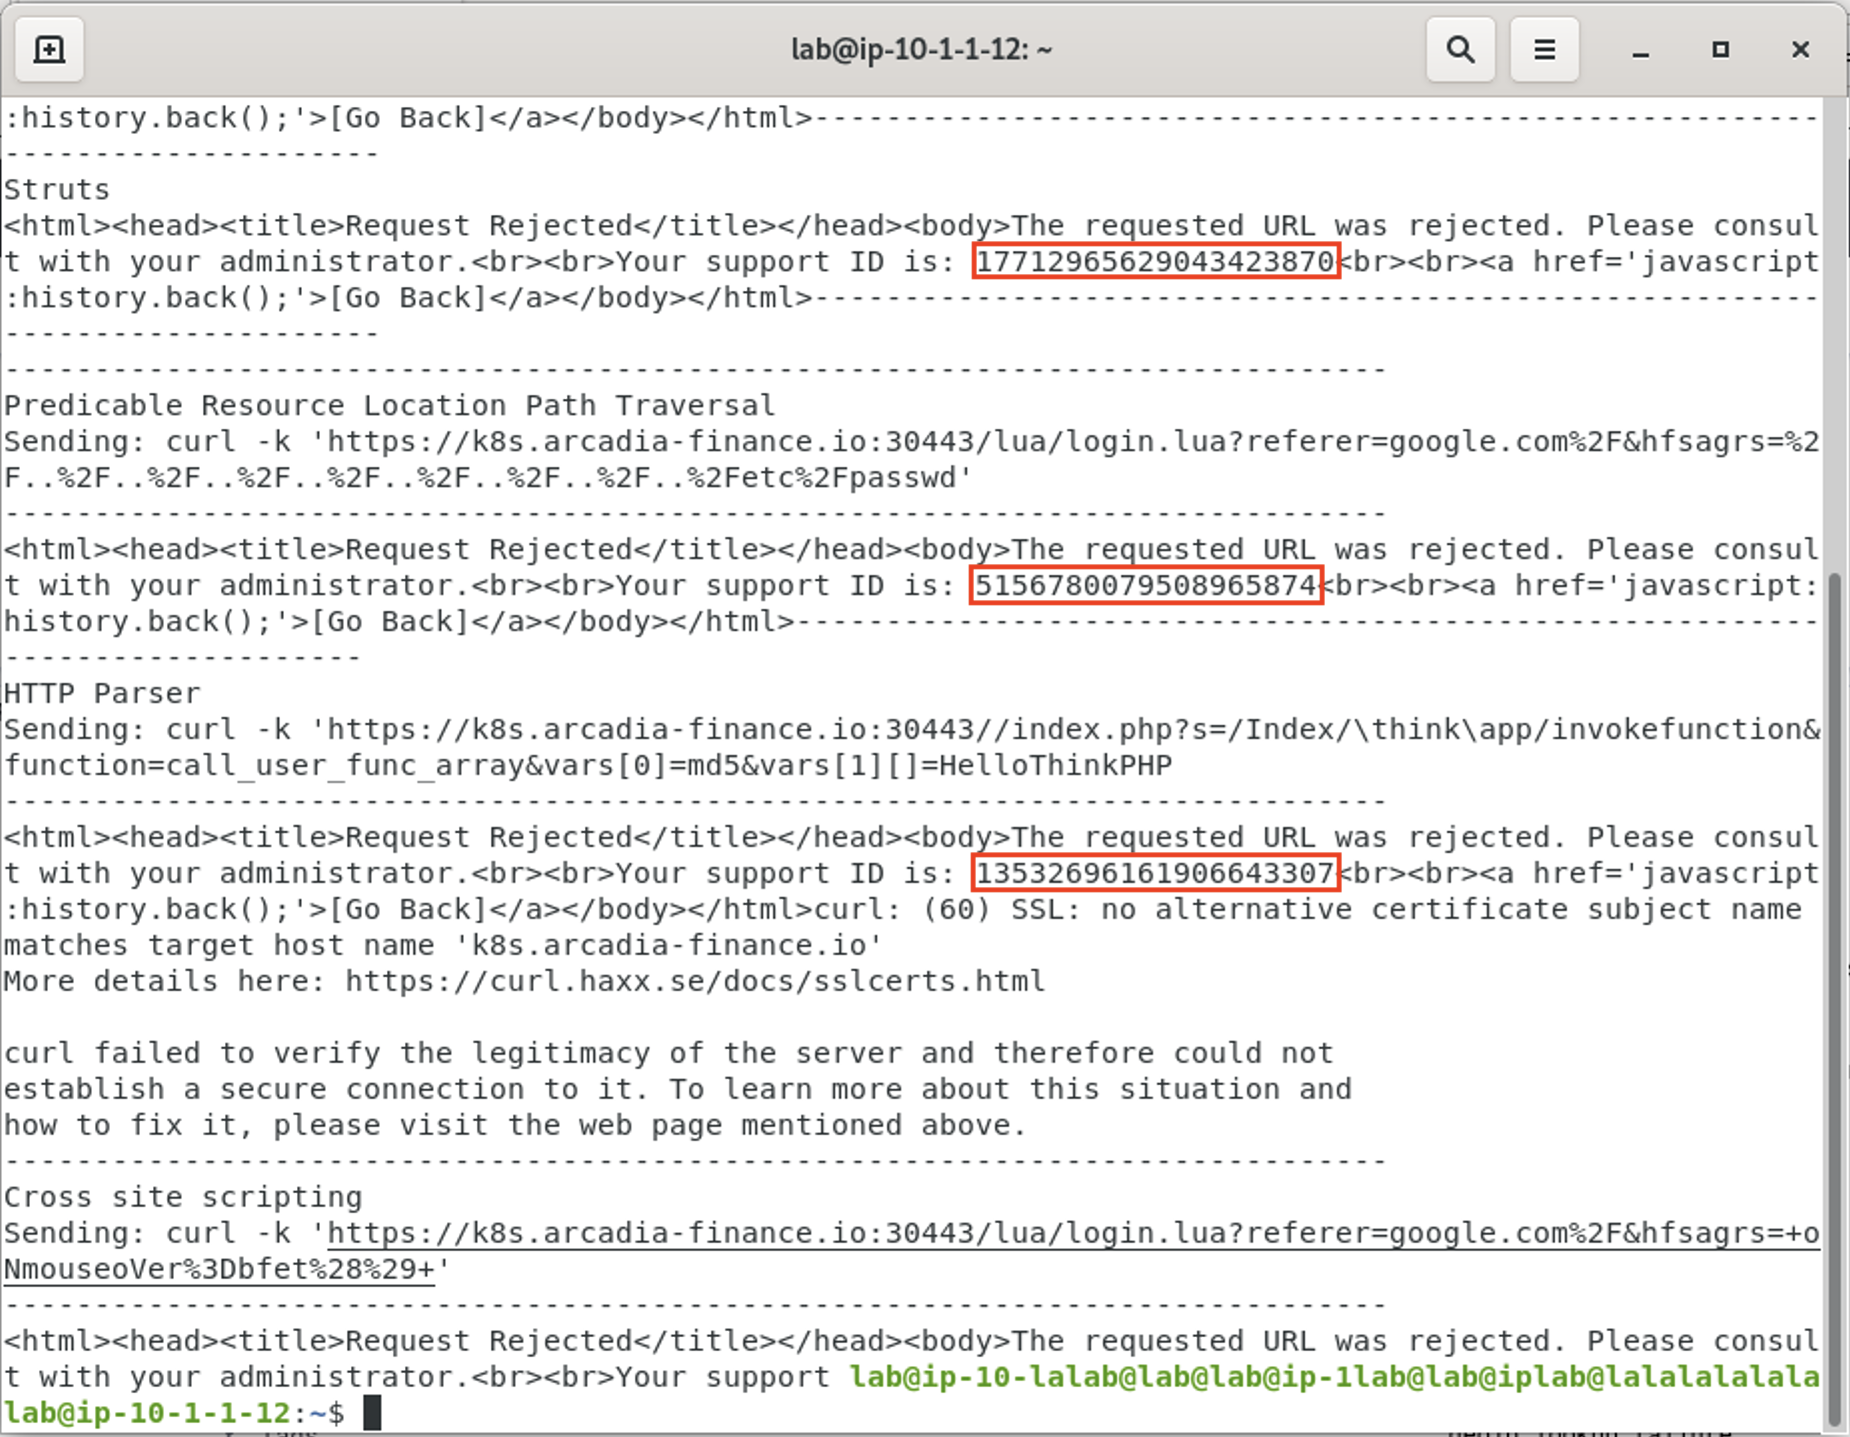
- When the terminal opens, you’ll run the below command. Please be sure to leave your terminal open as we’ll reference the Support ID it provides later.
source k8s-attacks
This is a bash file that launches various attacks at the application using CURL and well-known exploits.
Note
Wait for the script to complete before continuing with the lab.
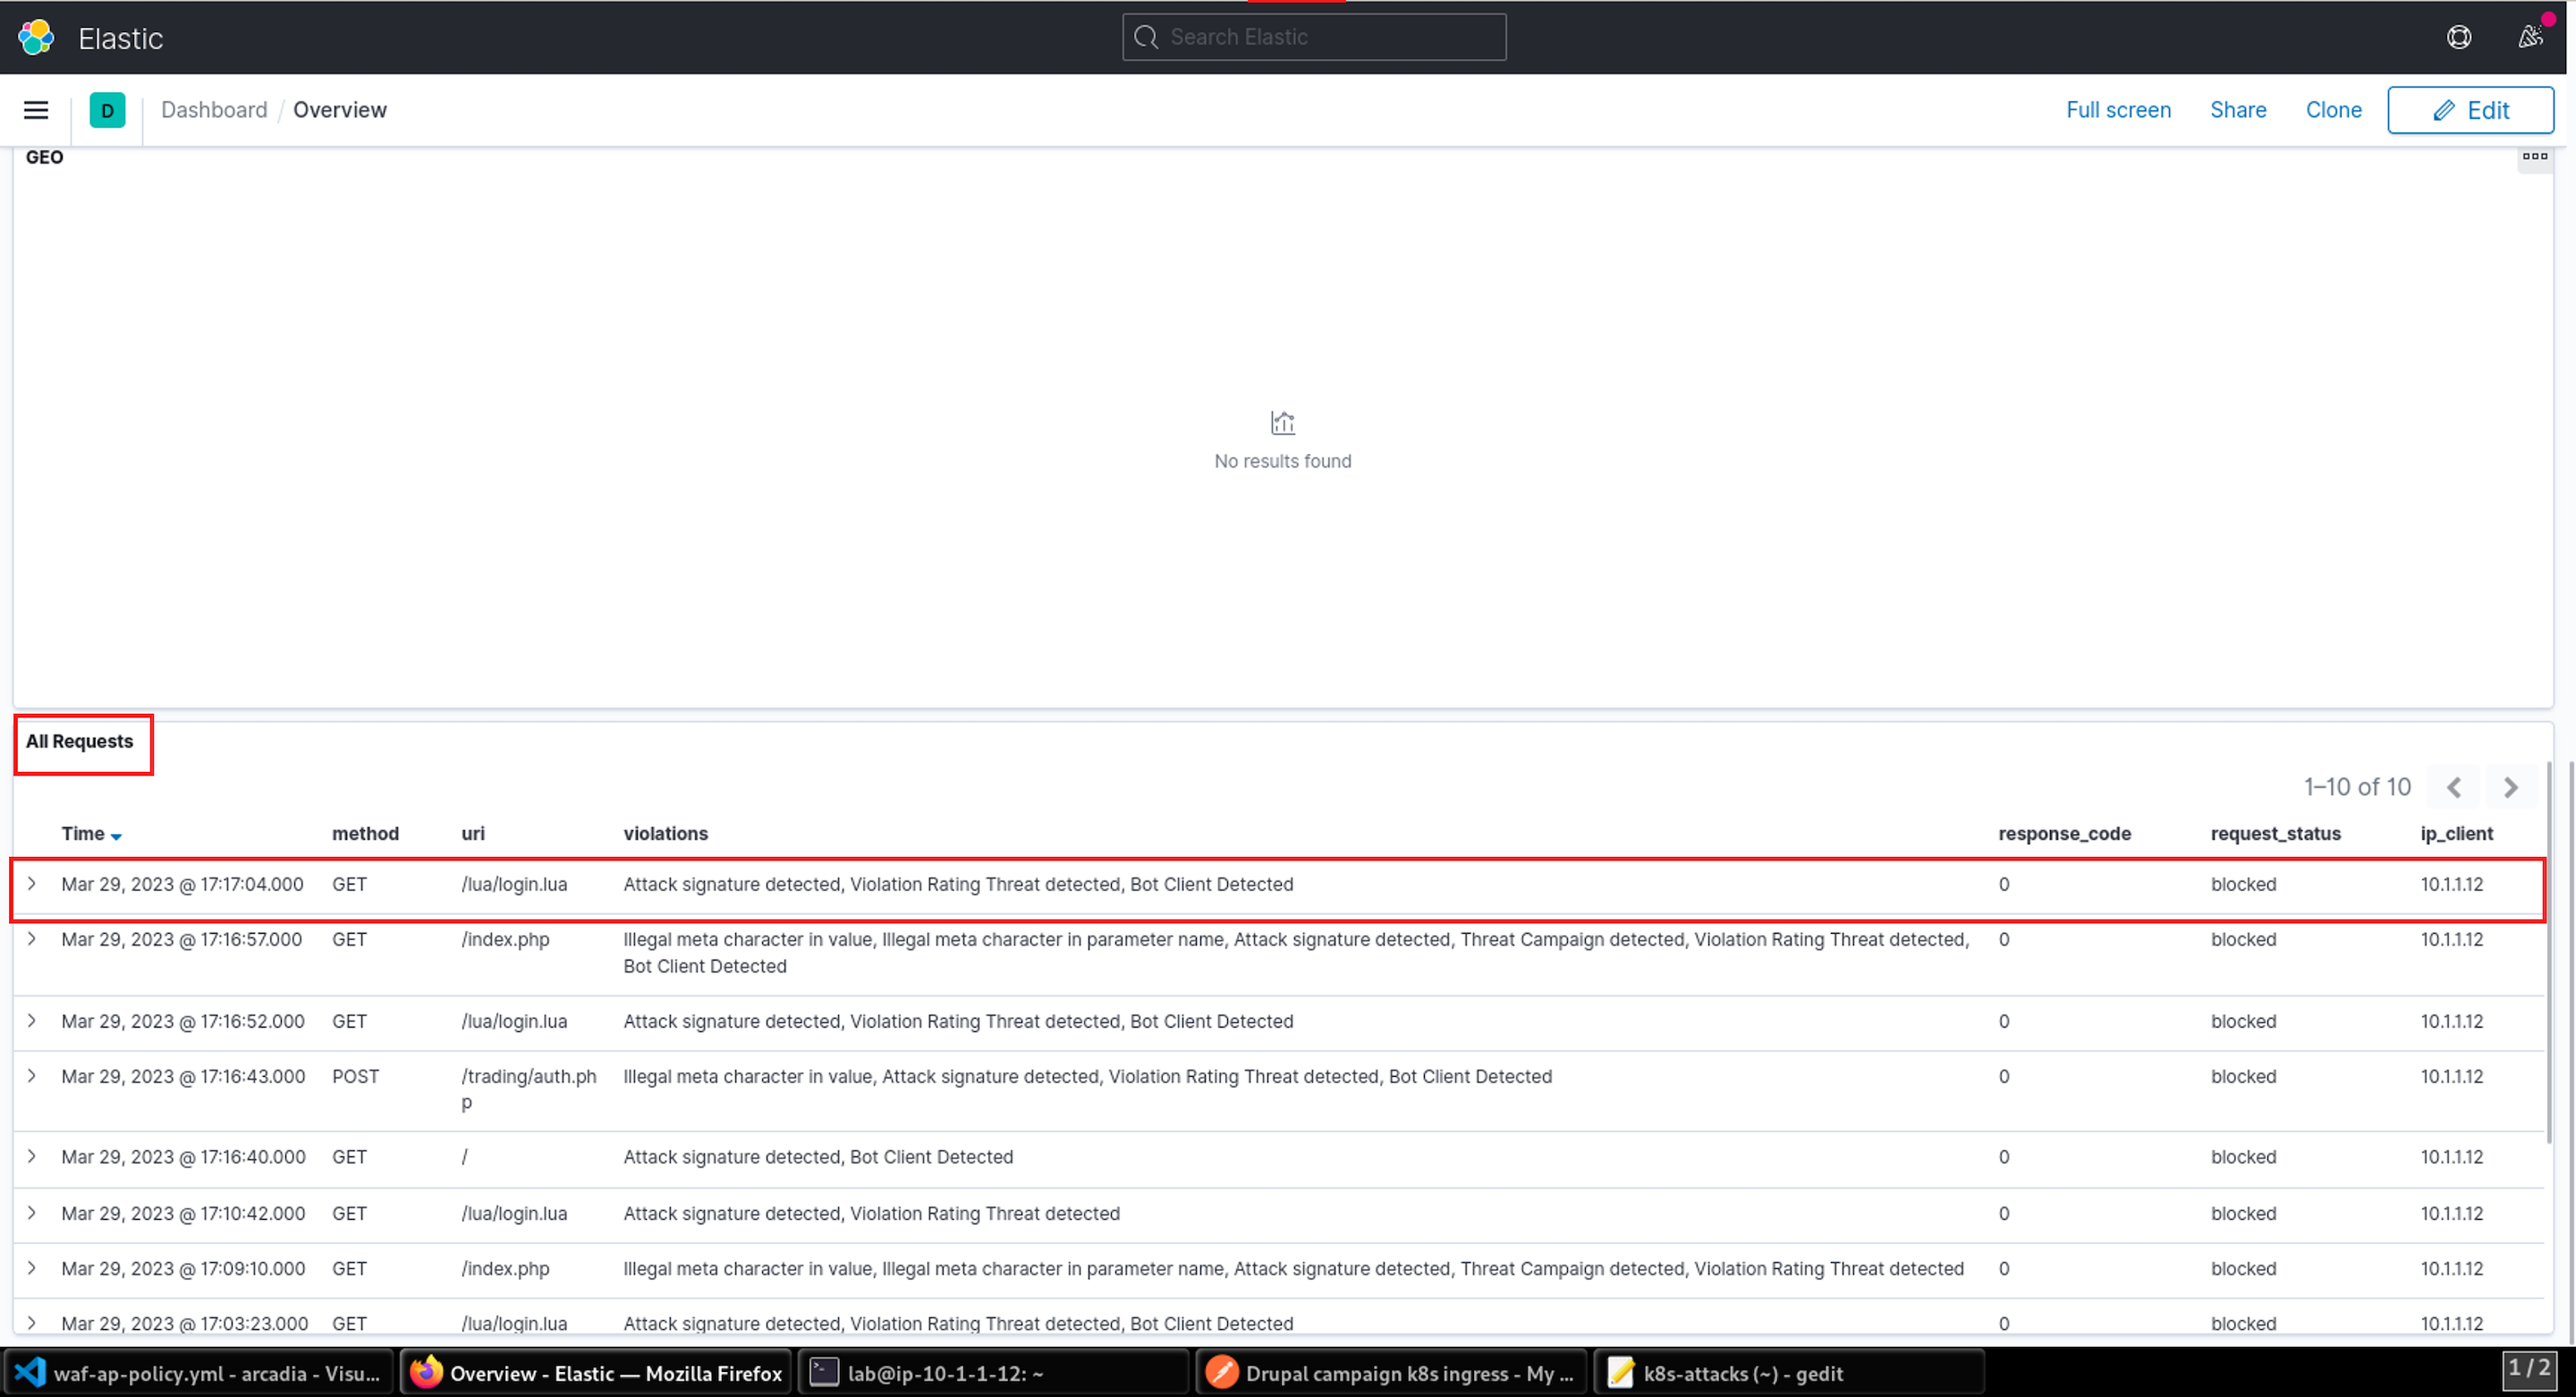
- Once the attack script completes, return to the ELK tab you opened earlier. You may need to click Refresh to see statistics.
- In the ELK dashboard, scroll down to the All Requests section. Here you will see entries for each of the attacks blocked by NGINX App Protect which were generated by the attack script. The details of each request can be viewed by clicking on the > icon next to the request.
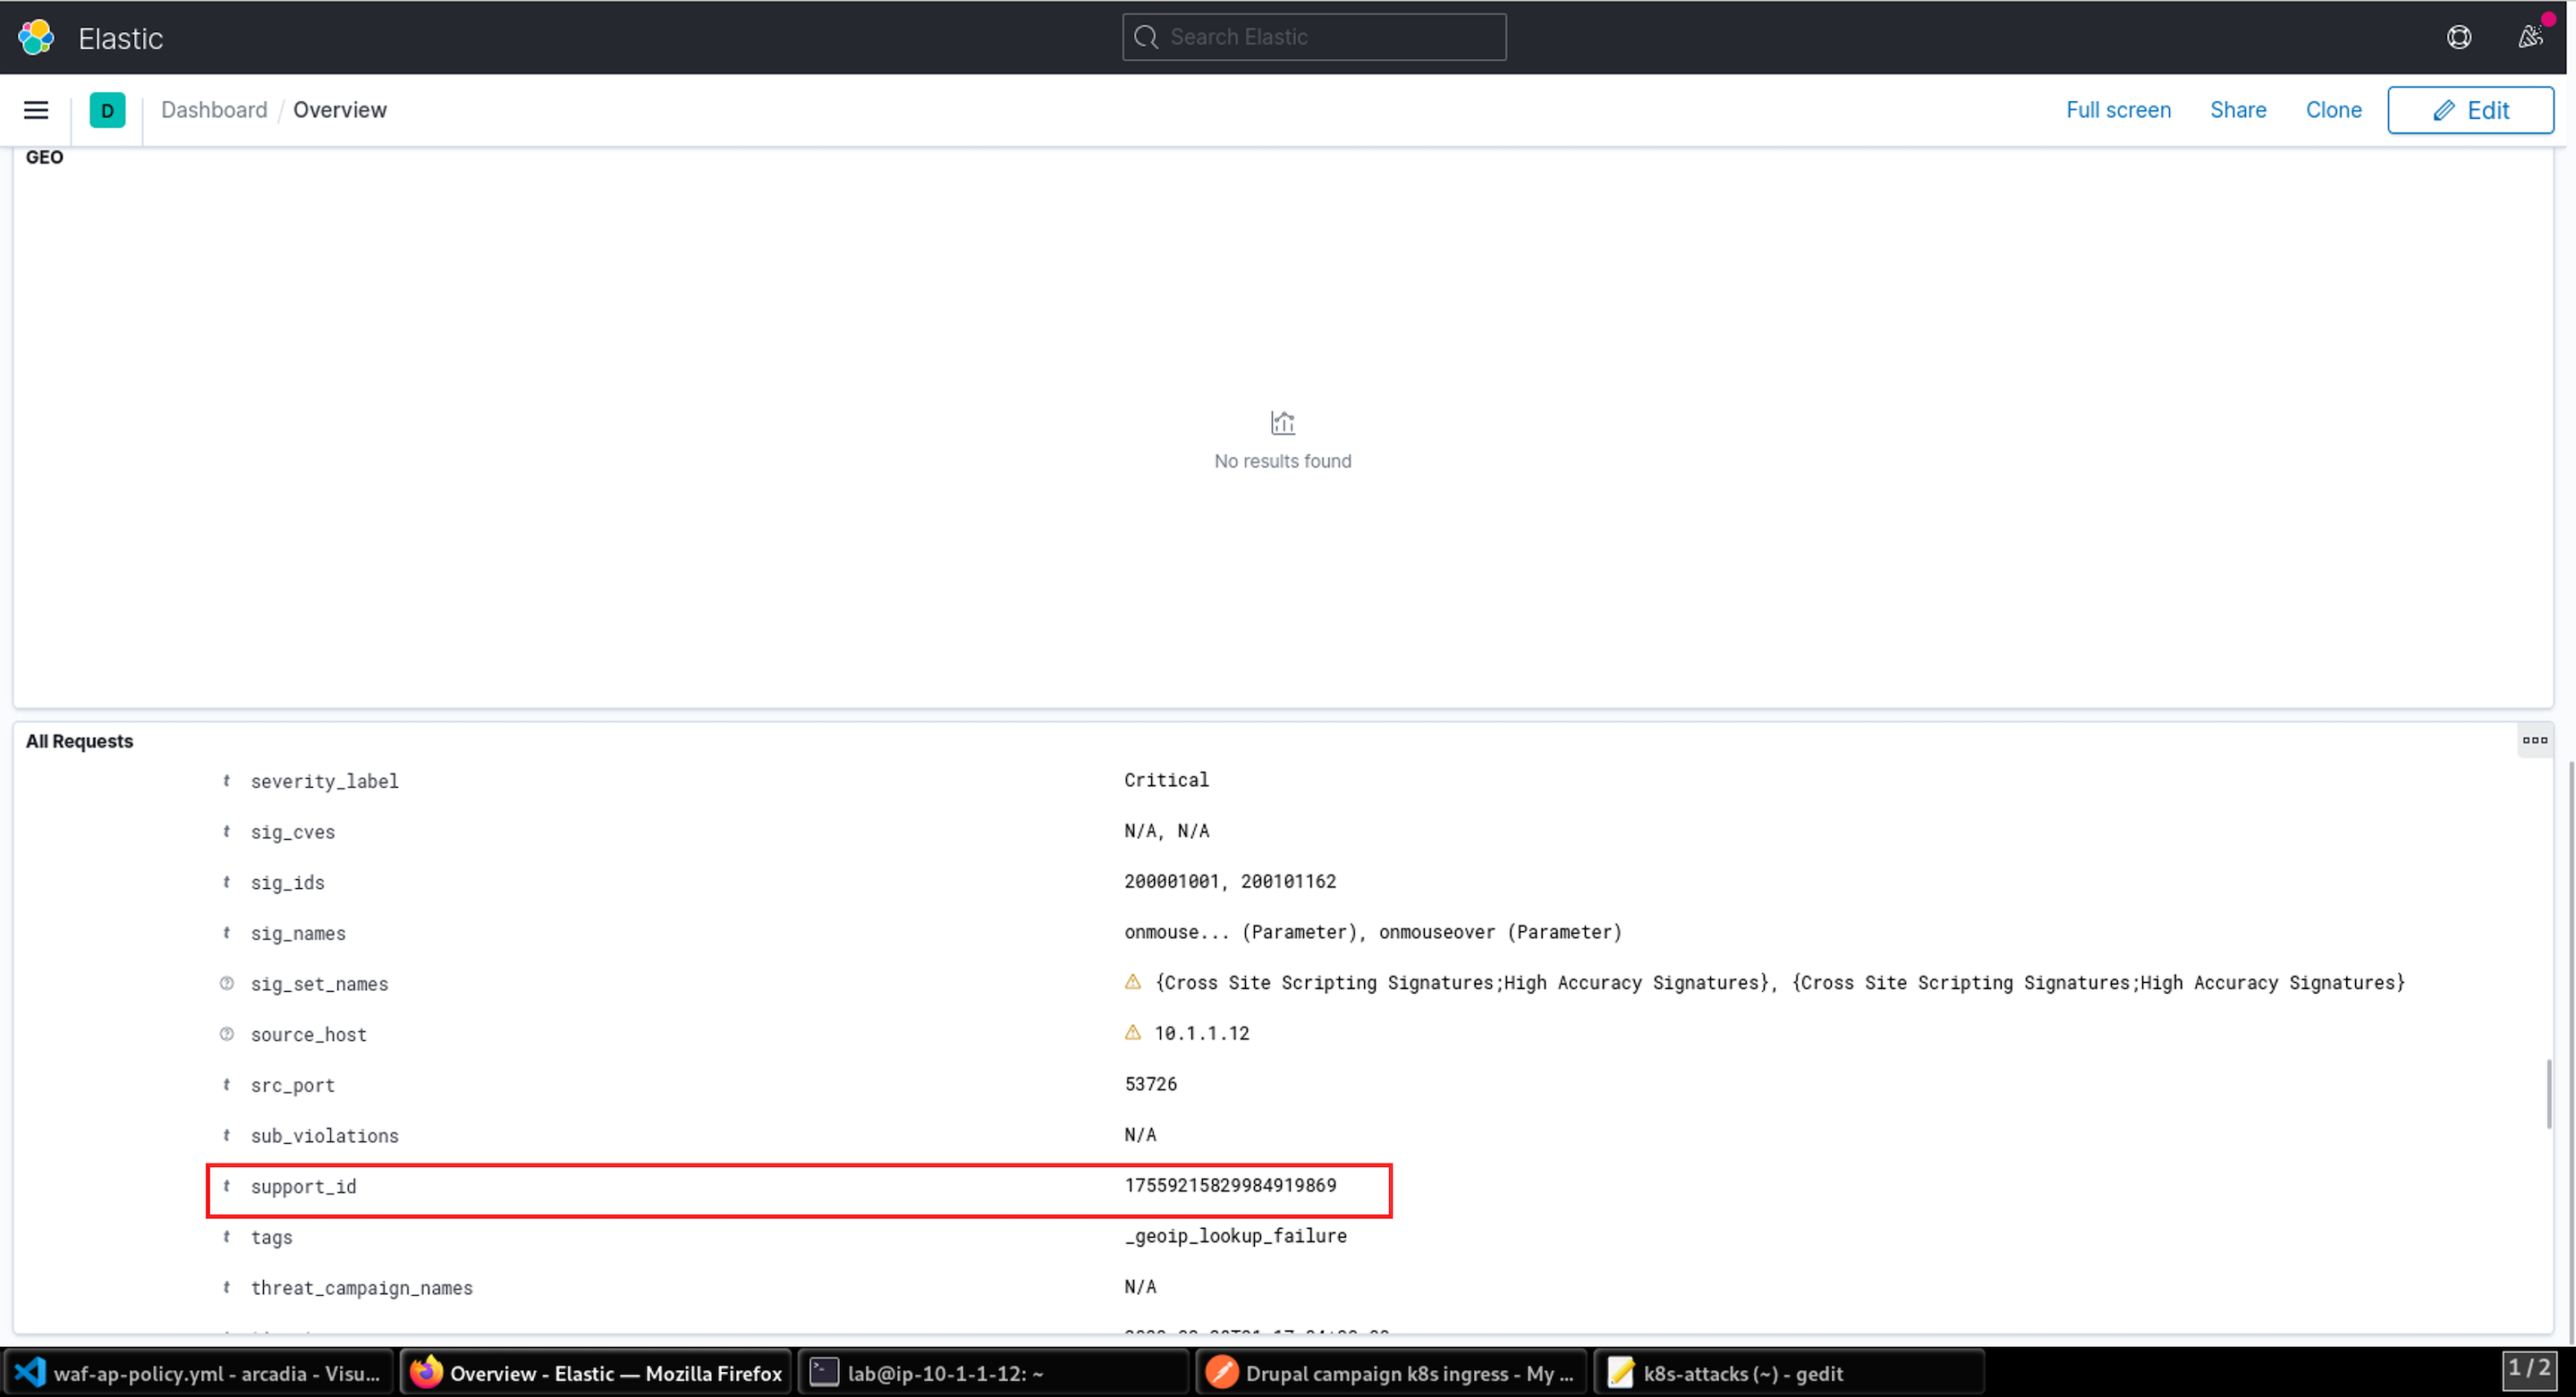
- You can drill into an event to see the support_id, which you can use to correlate the ELK dashboard Request details and the attack details shown in the CLI from step 22.
This concludes this portion of the lab.