F5 Analytics and Visibility Solutions > Class 3 - F5 Telemetry Streaming Source | Edit on
Telemetry Streaming With Kibana
In this lab we will configure our Telemetry Streaming JSON declaration to establish a connection between our Kibana consumer and our BIG-IP.
Exercise 1 - Configure Kibana as the Telemetry Consumer
Open Postman.
Open the collection Create ELK Consumer.
Click the ELK Consumer request.
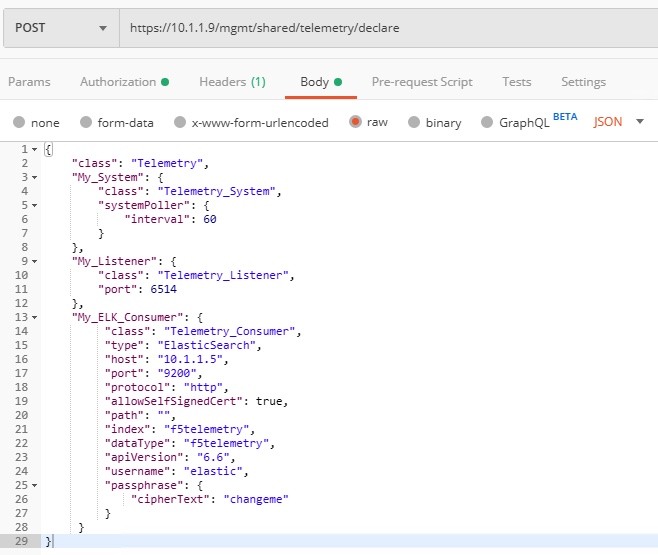
Click on the Body tab.
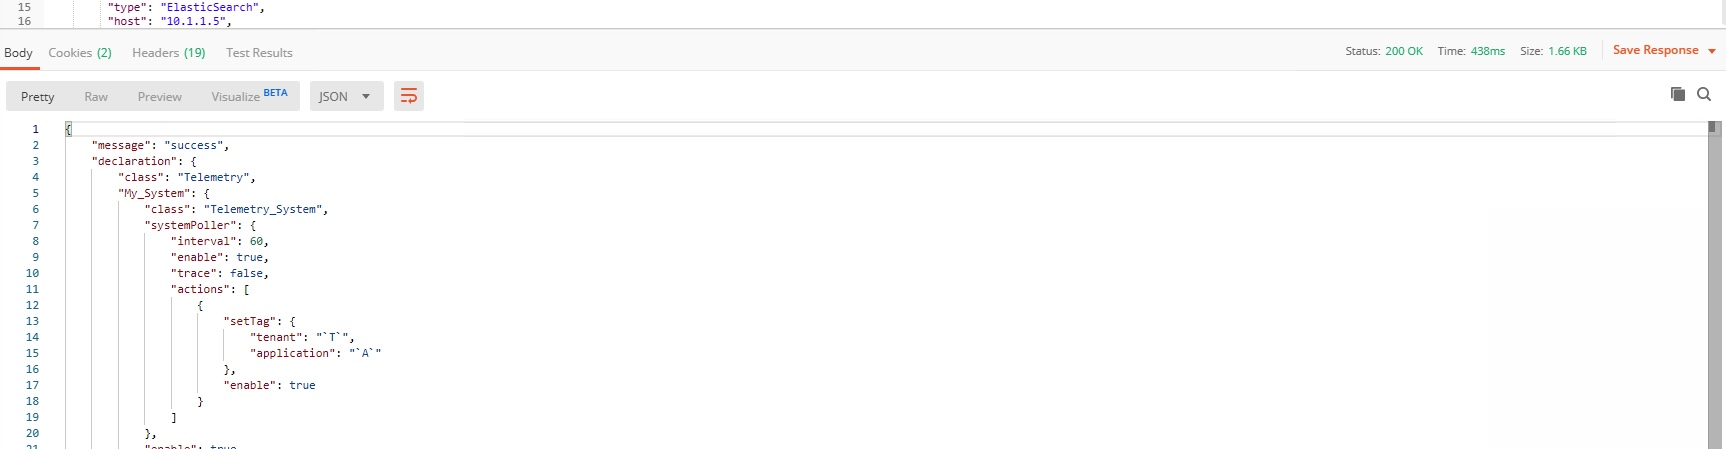
Send the POST request by clicking the blue ‘Send’ button. Ensure a ‘Status: 200 OK’ response.
Hint
Here is what is important from this declaration:
- The Listener collects event logs from all BIG-IP sources, including LTM, ASM, AFM, APM, and AVR. You can configure all of these by POSTing a single AS3 declaration or you can use TMSH or the GUI to configure individual modules.
- The Consumer class is the third party consumer we wish to send our captured data to.
Note
By sending this POST request to https://10.1.1.9/mgmt/shared/telemetry/declare with the correct credentials and current body we’ve established a connection between our consumer and our BIG-IP.
Note
Additionally, you should see a Read Only collection in Postman. These API calls are necessary to configure the Elastic database and provide a mapping of indexes between the BigIP and Elastic. You do not need to send these commands as the ELK environment is already pre-configured.
Note
To learn more about AS3, visit https://clouddocs.f5.com/products/extensions/f5-telemetry-streaming/latest/
Exercise 2 - Generate Traffic on OpenCart
- From the UDF page, find the host named Traffic Gen and select Web Shell from the dropdown
- Type su for sudo user access. If prompted, the password is toor.
- Change directory to /home/ec2-user
- Run ./baseline_menu.sh
- From the menu, choose 2) Alternate and let it run while you continue with the labs
Exercise 3 - Analyze Telemetry via Kibana
Back in the Windows RDP session, open a new tab in Chrome and click the Kibana bookmark.
Select the Discover tab on the top left.
Ensure that f5 is selected in the dropdown and that a reasonable time range is selected in the top right (ie 15 minutes in the screenshot below).
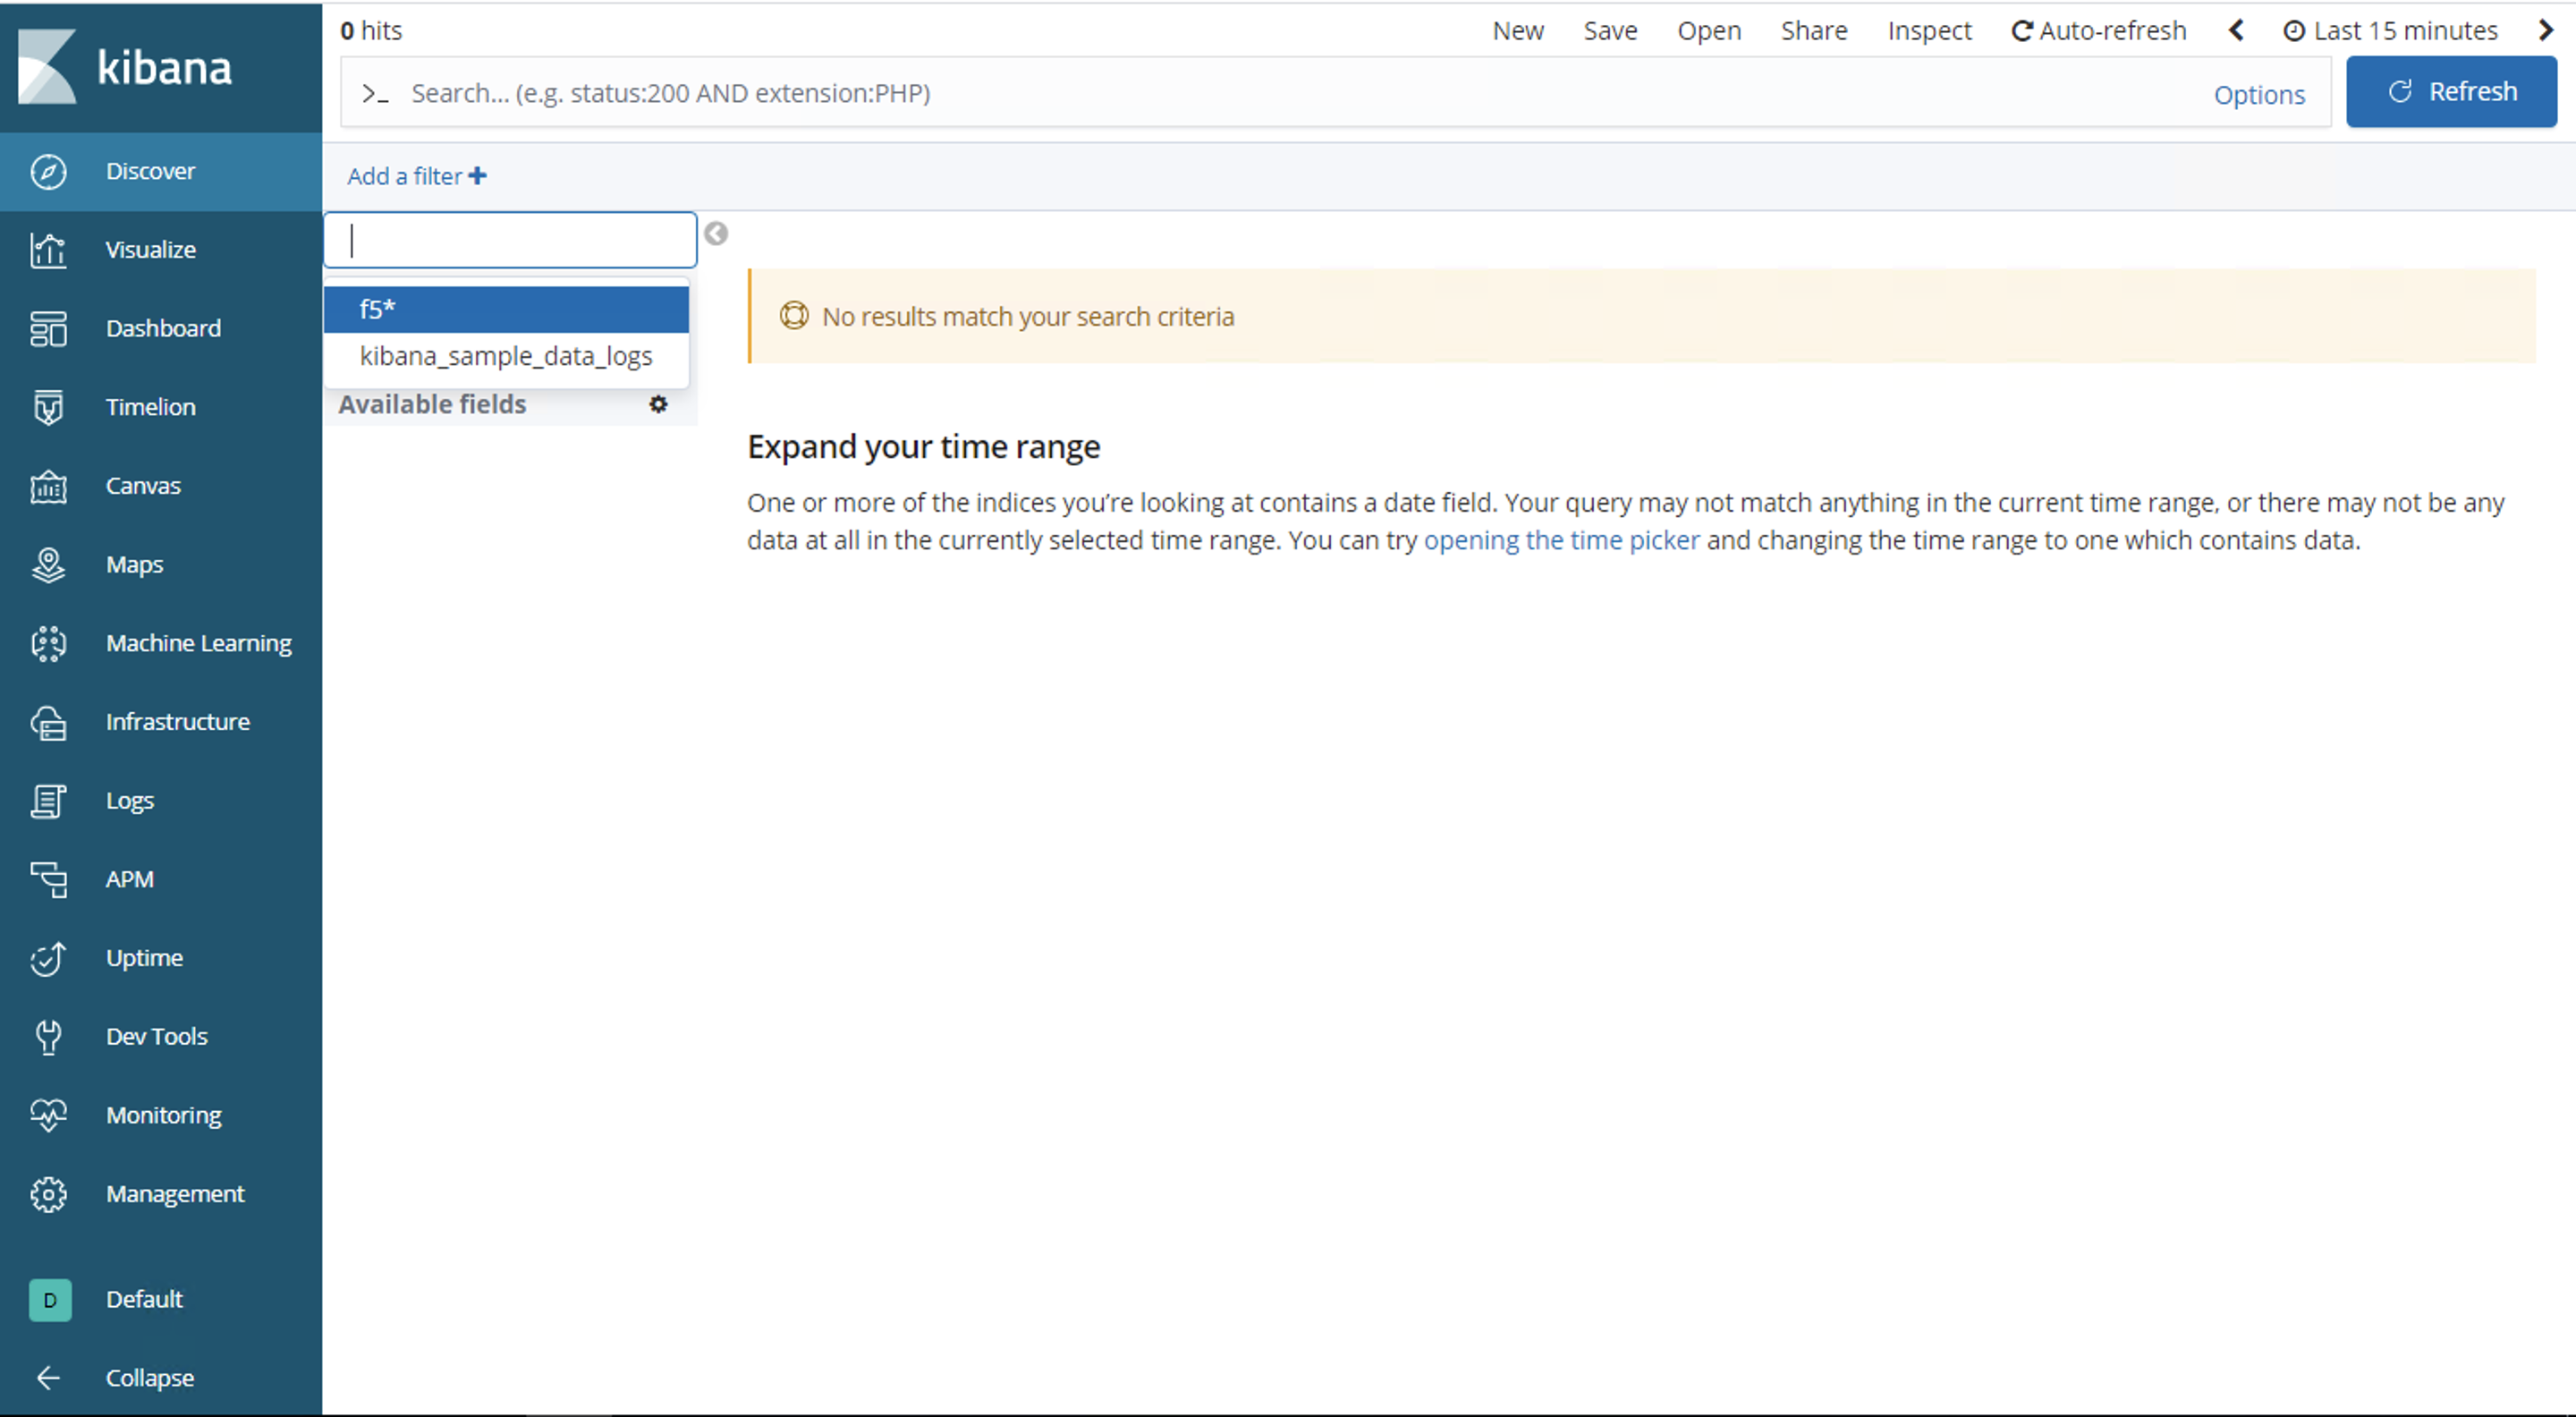
Now you should see some logs coming in.
Exercise 4 - Create a Simple Kibana Visualization
In Discover, type
data.http_code \: 40*. This will show you all HTTP resonses starting with 40. Press the blue Refresh to apply.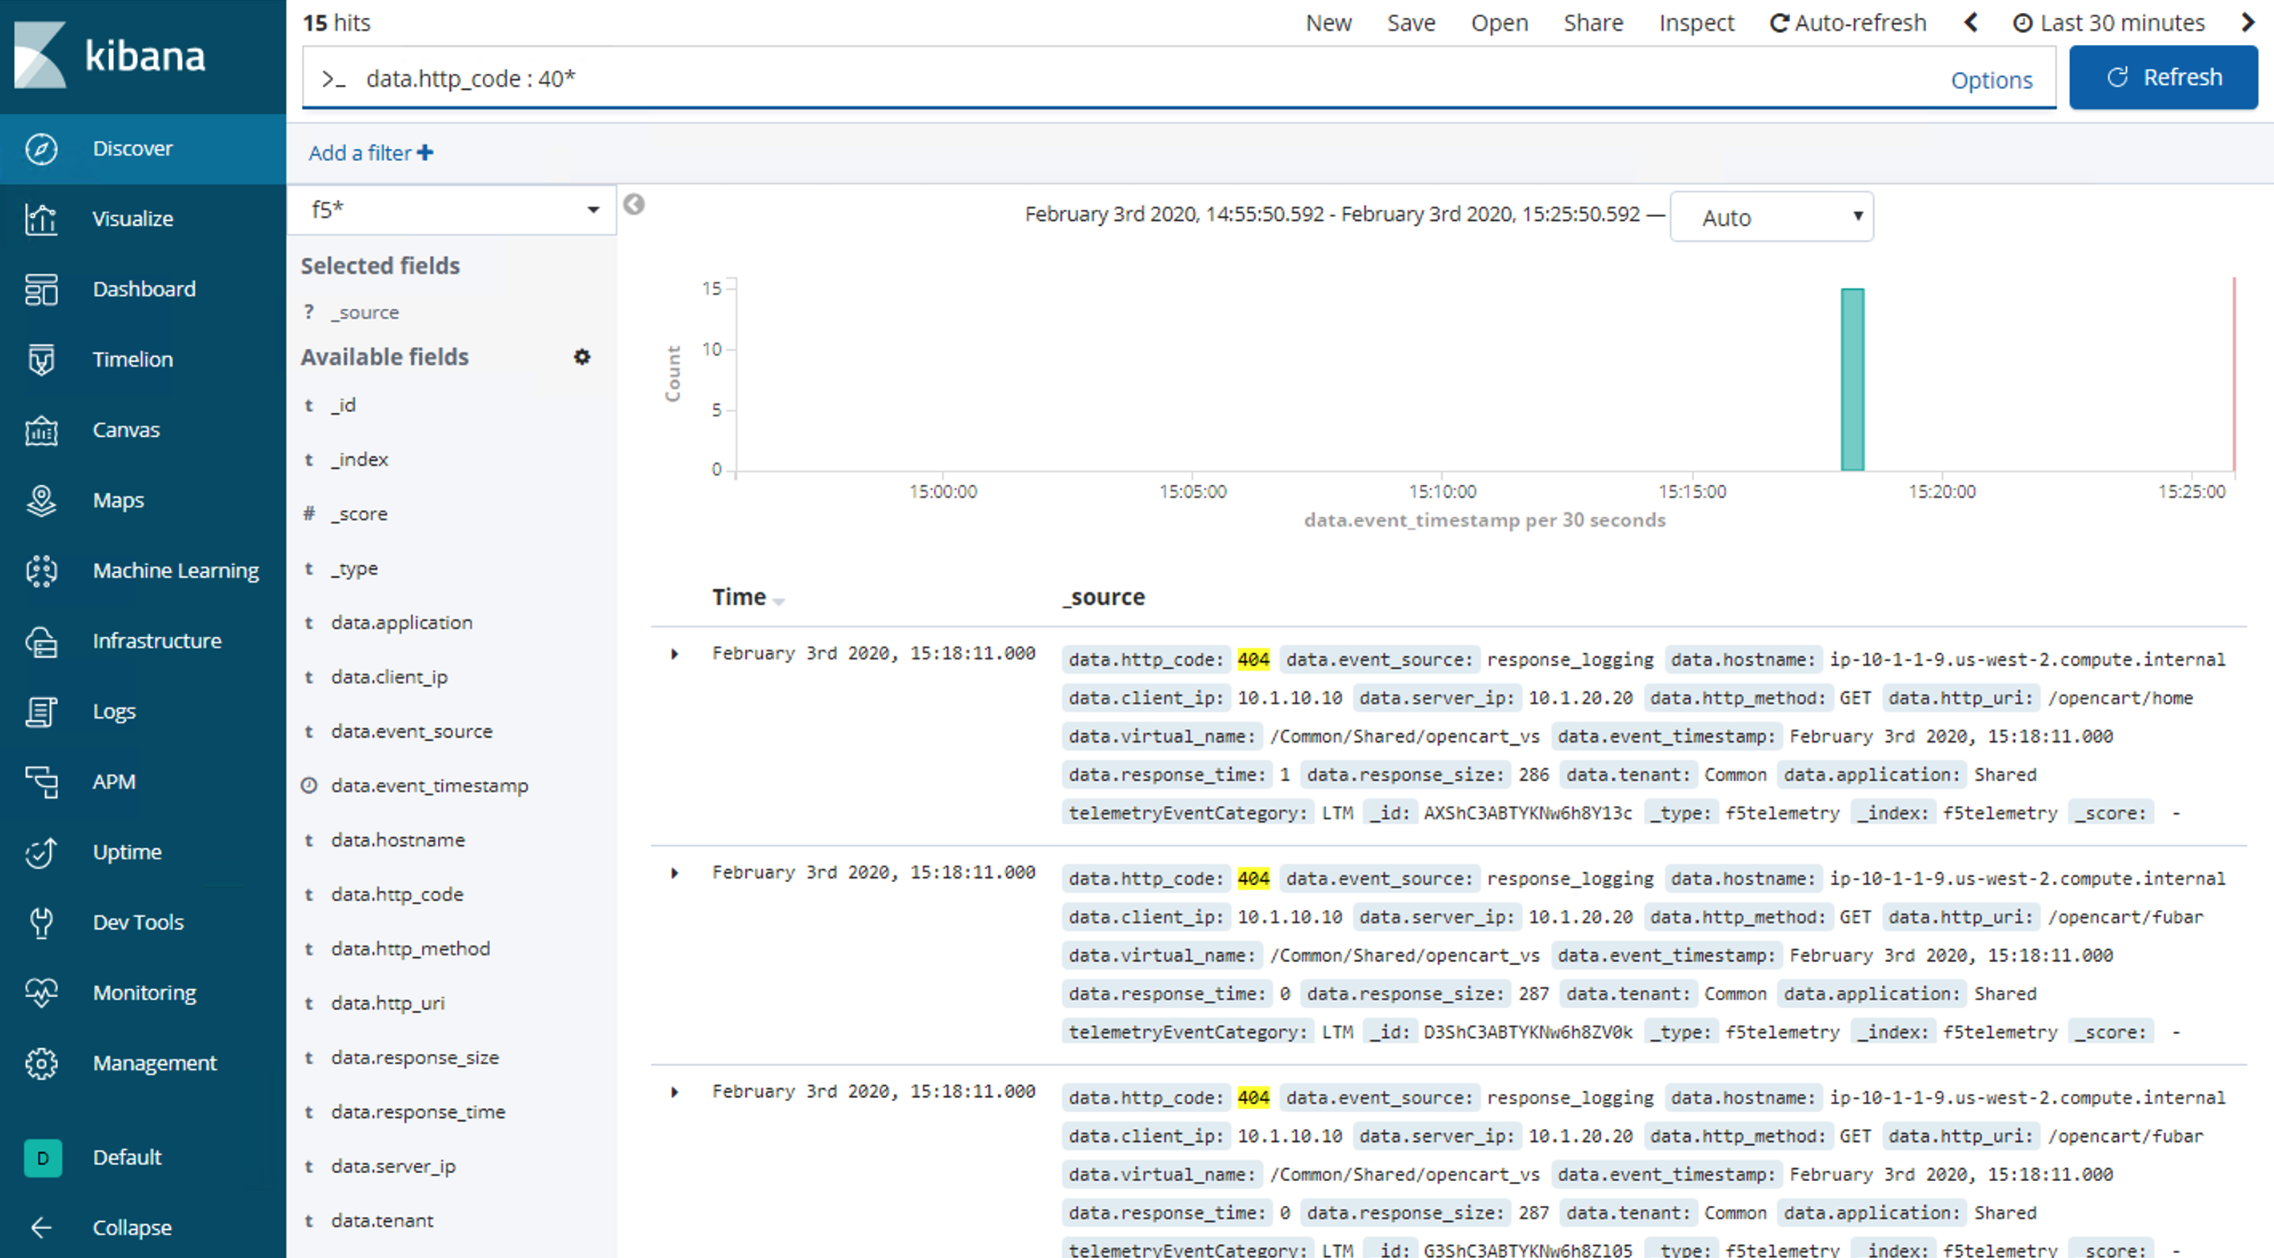
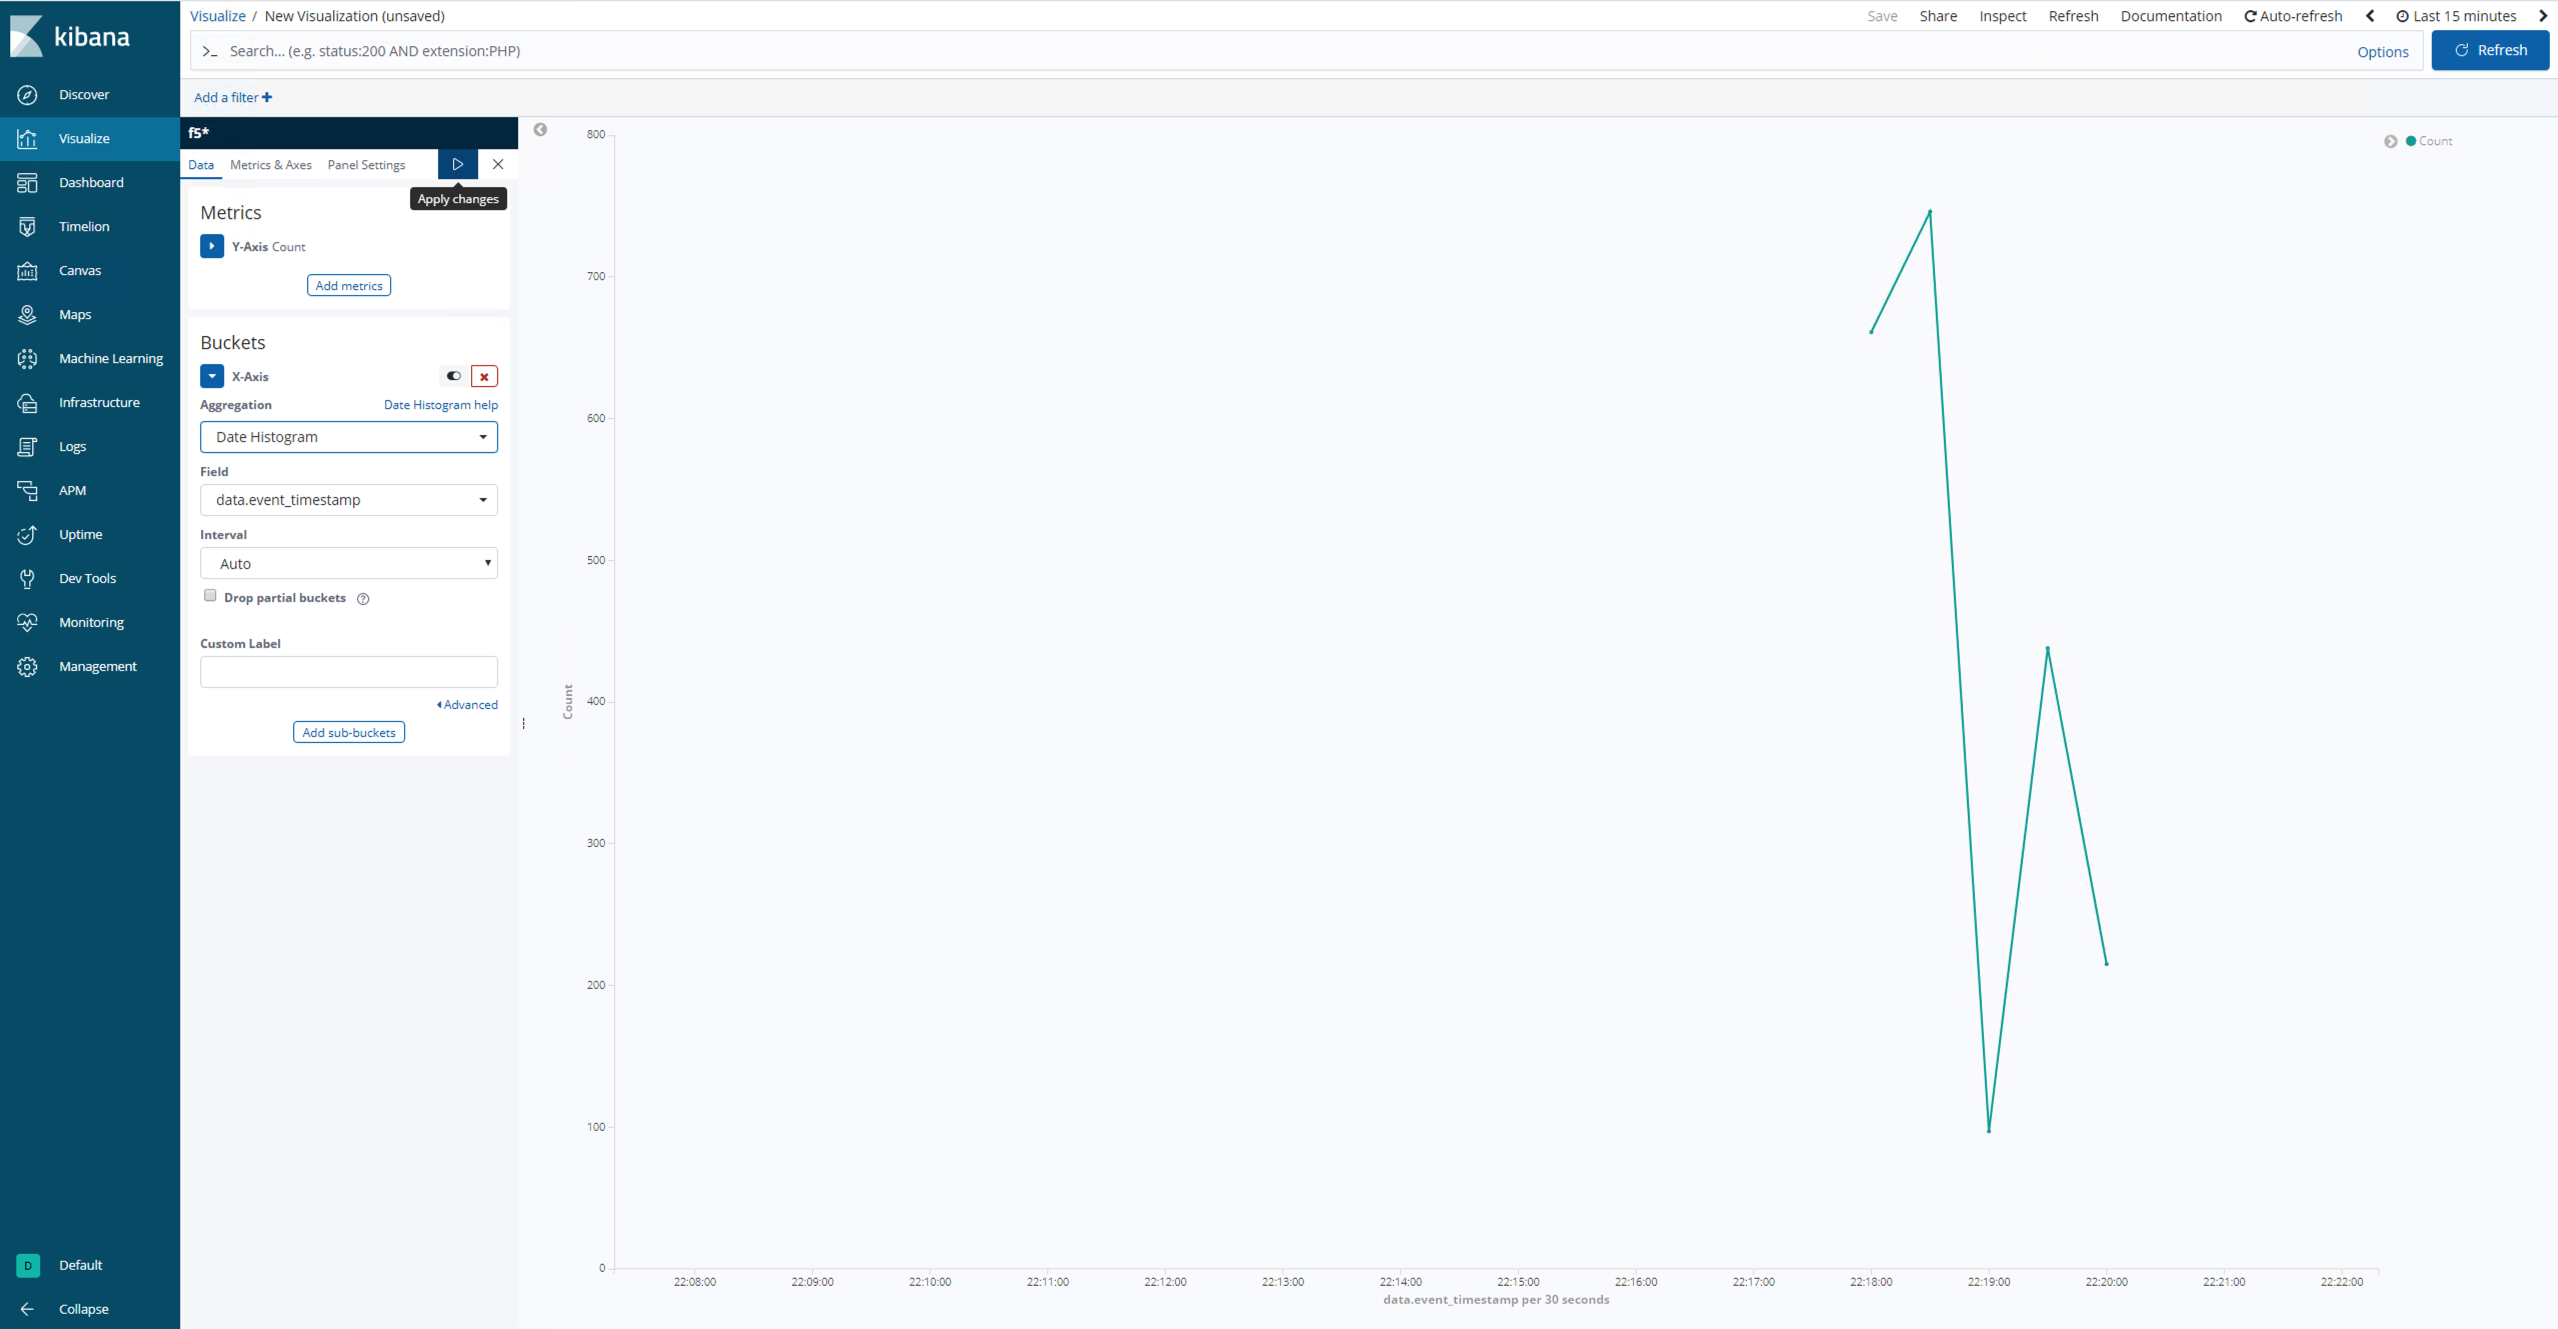
Click the Visualize tab on the left and click Create a Visualization
You can explore various types of graphs. For this exercise we will select the Line graph
Under Select Index select f5*
On the left, under Buckets select X-Axis. Select Date Histogram from the Aggregation dropdown, data.event_timestamp from the Field dropdown, and Auto from the Interval dropdown.
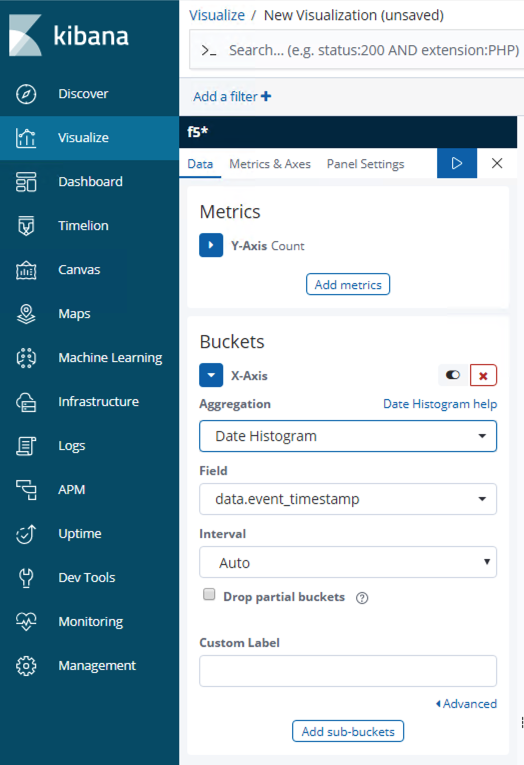
Now select the Apply Changes play button next to Panel Settings. Press the blue Refresh button on the top right. View your visualization.