F5 Application Study Tool Labs > Class 1: Introduction to F5 Application Study Tool > Module 3: Exploring the F5 AST Dashboards Source | Edit on
BIG-IP - Fleet Dashboards
In this lab, we’ll explore the Application Study Tool’s BIG-IP Fleet dashboards:
Fleet Inventory
Device Utilization
Virtual Servers
SSL Certificate Status
Firewall
APM Sessions
DoS
CGNAT
Note
There is an exhaustive list of metrics collected, some of which have been exposed through the pre-built dashboards you are about to explore.
These dashboards provide views into fundamental metrics we have observed have value in real-world scenarios, based upon field experience. We have designed this tool in a way that facilitates and enables users to customize it to meet their unique needs. Grafana provides just that, and we encourage you to add it to your toolbelt.
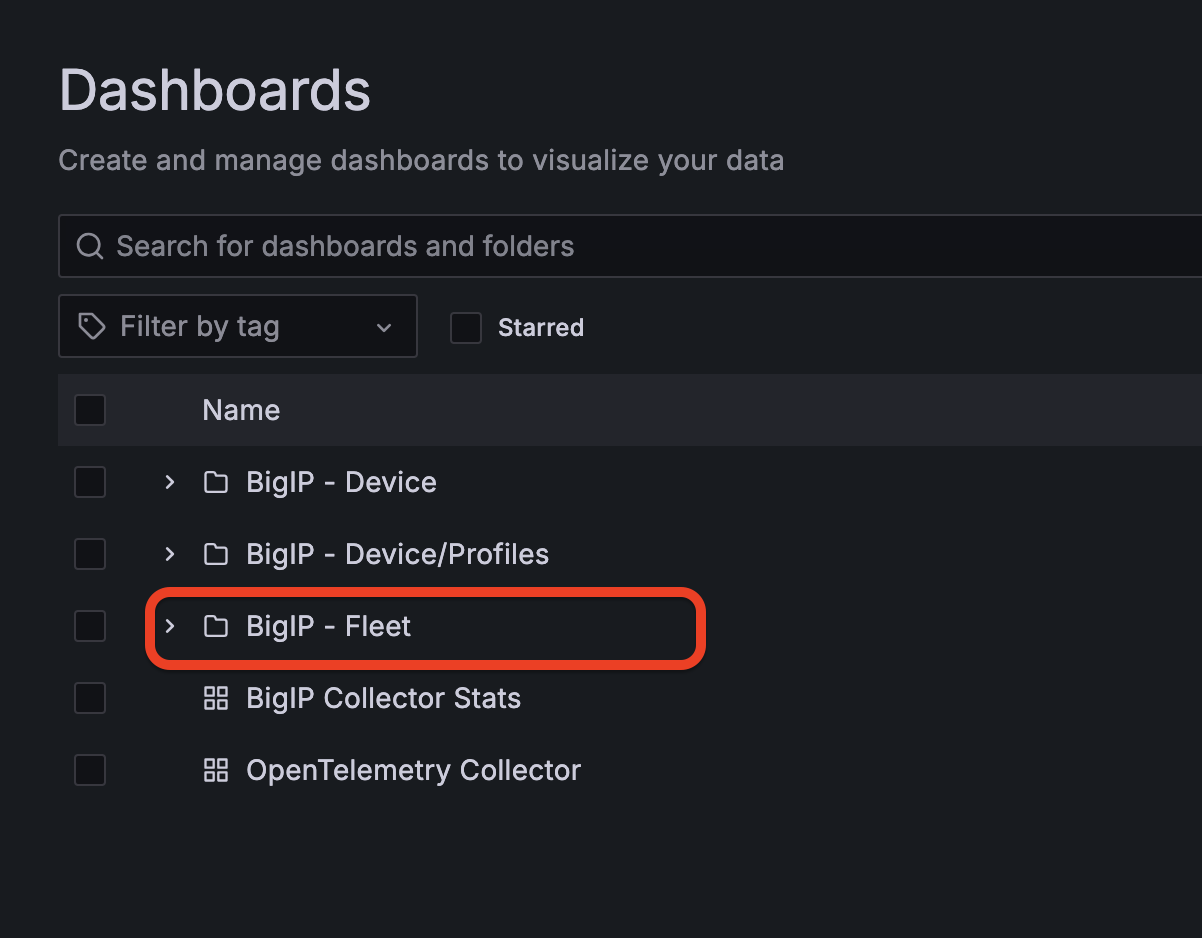
From the Grafana Dashboards landing page, select BIG-IP - Fleet
You’ll be presented with a list of available dashboards:
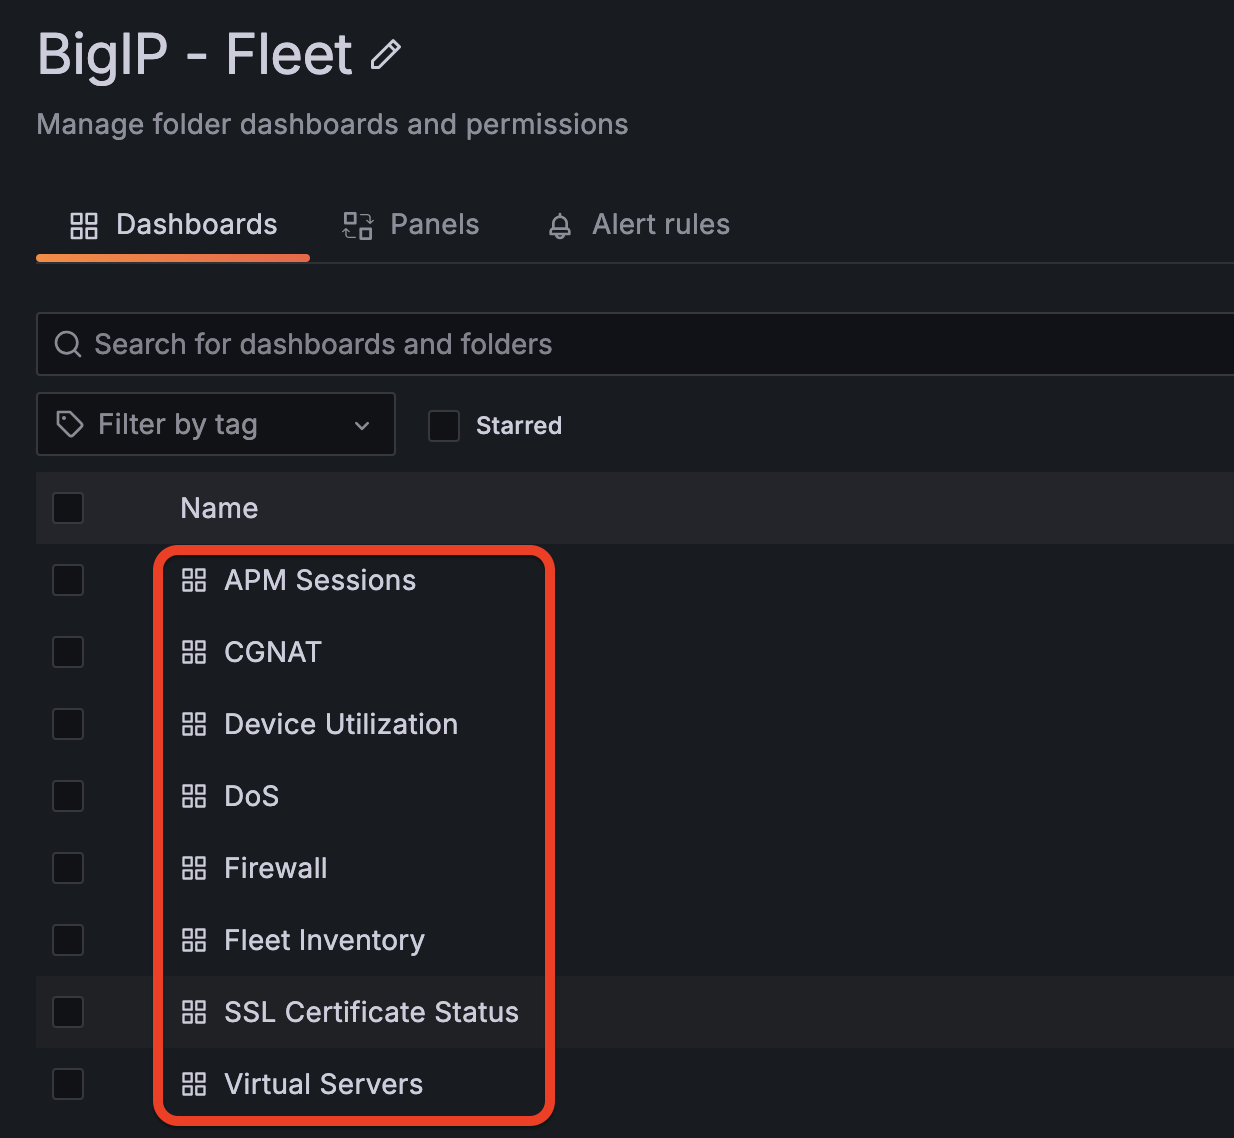
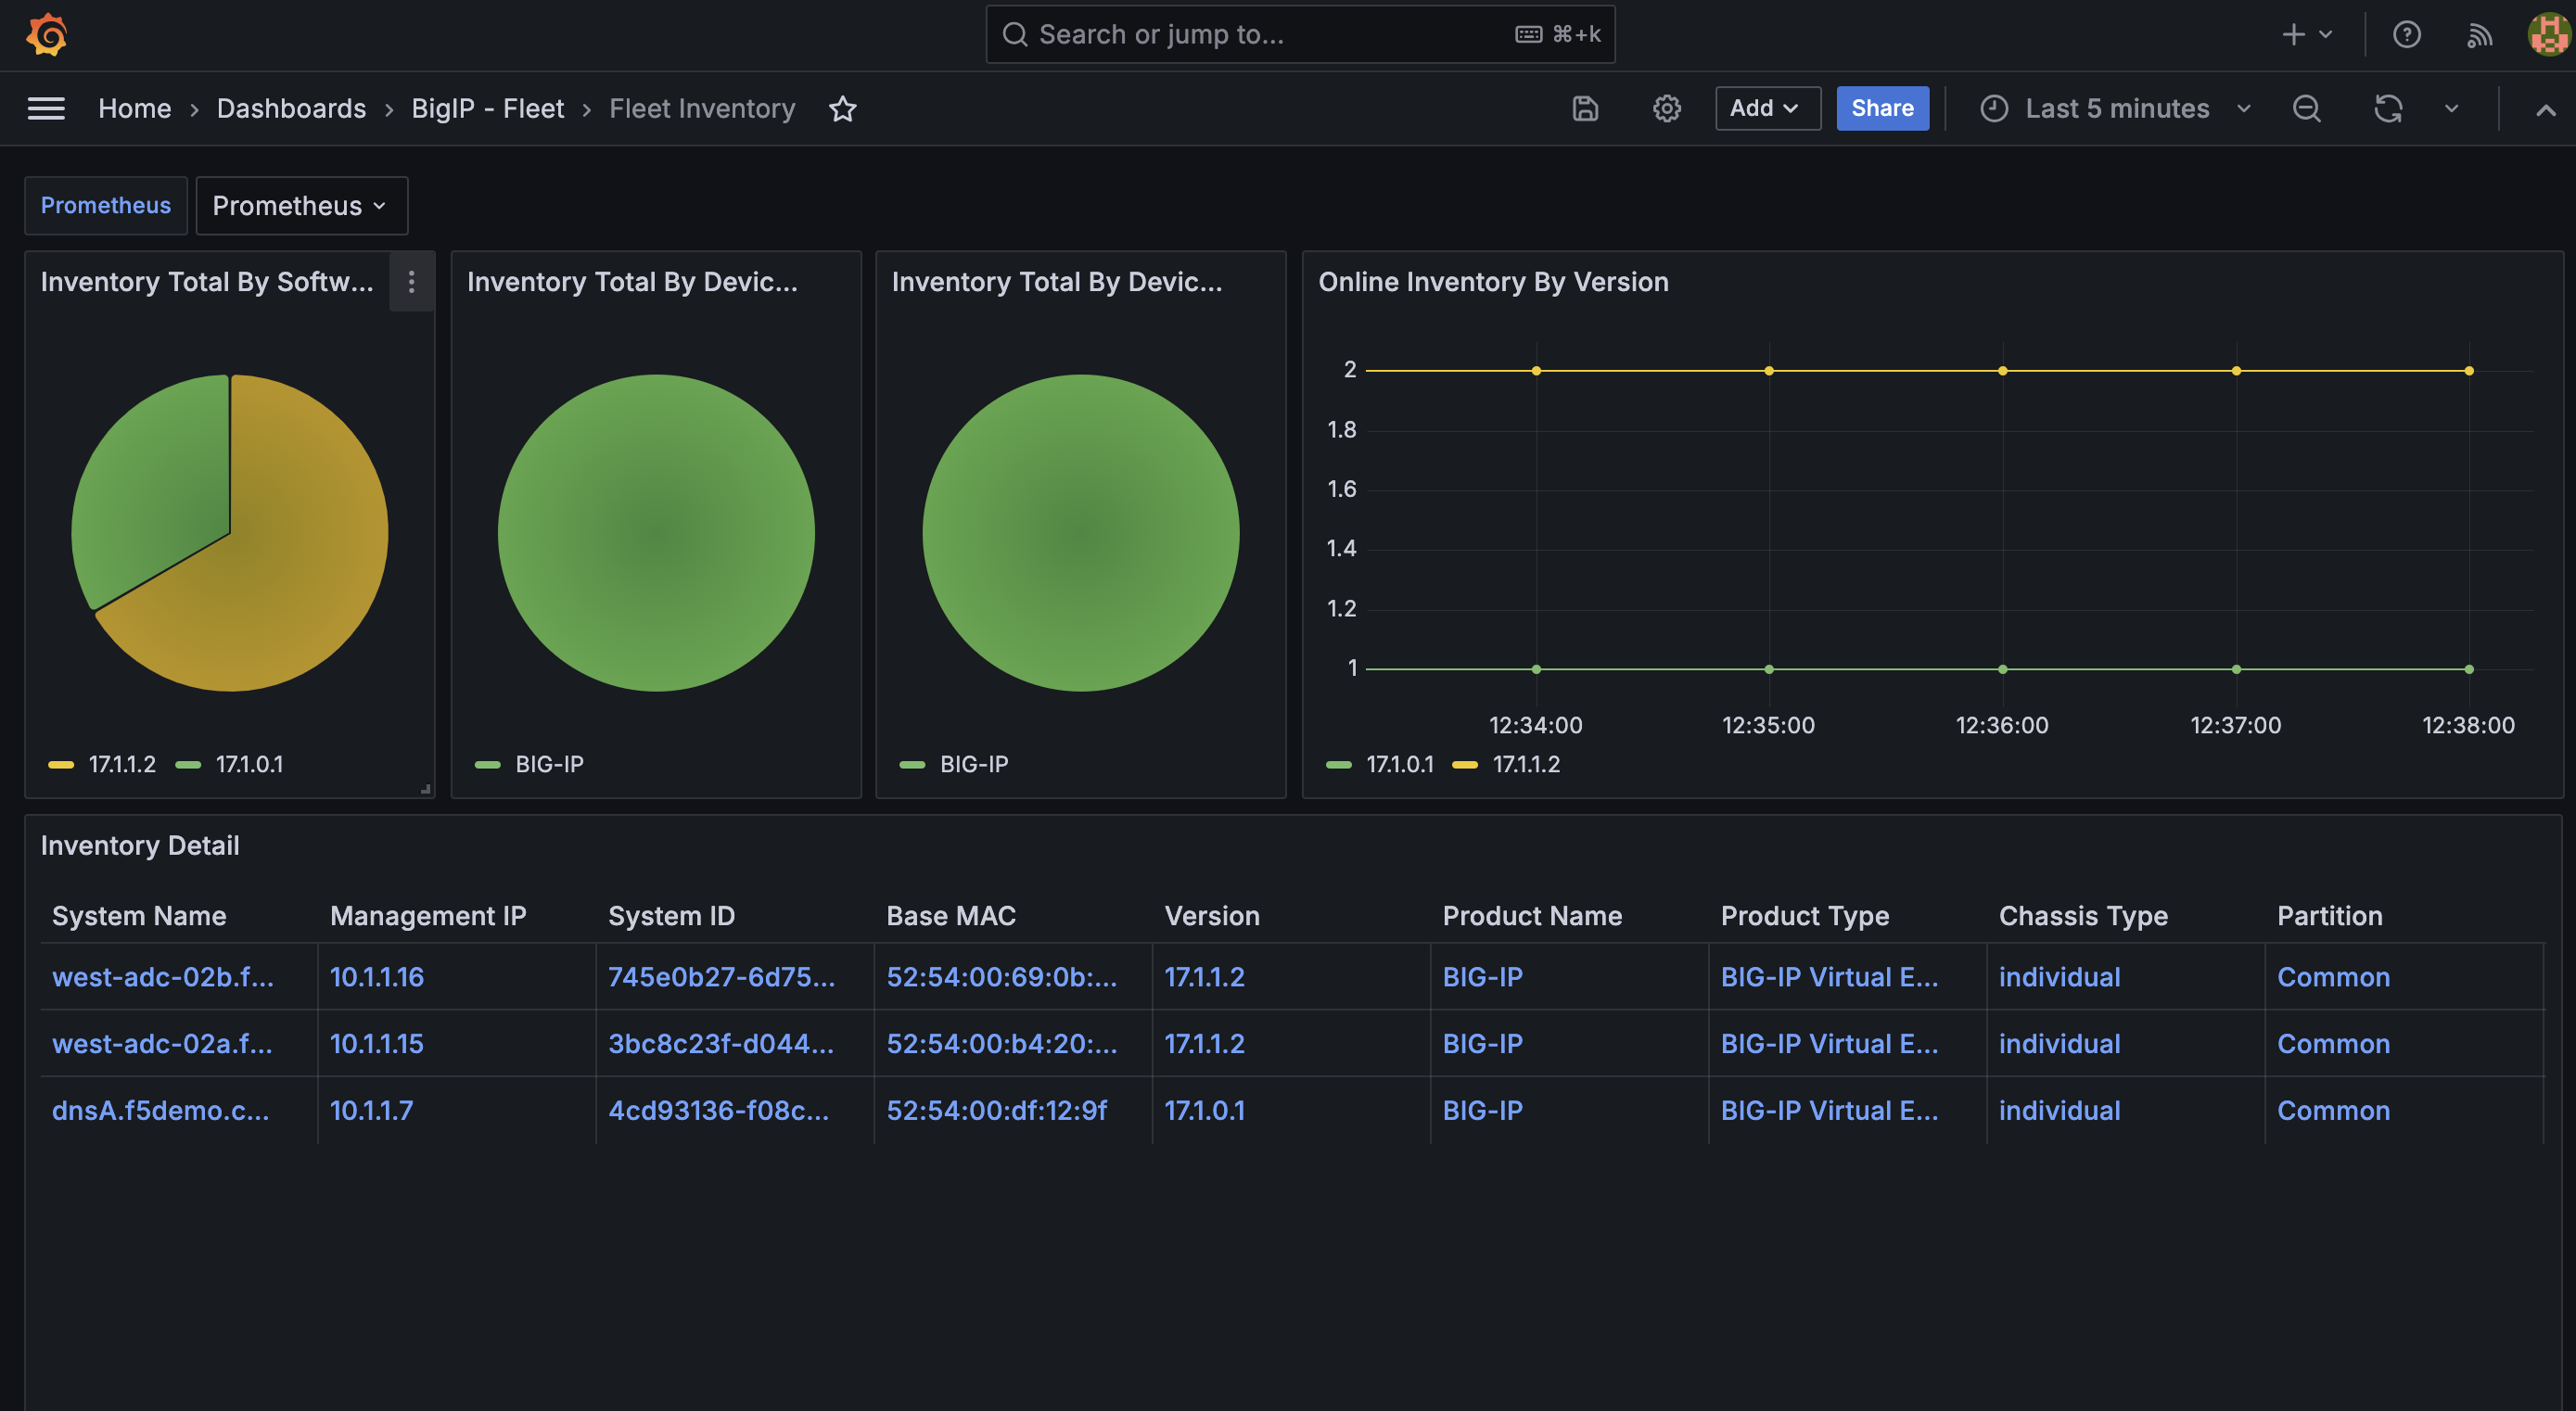
Fleet Inventory
The Fleet Inventory dashboard is your one-stop shop for a list of all the F5 BIG-IPs in your estate from which F5 AST is collecting data.
Available Metrics include:
Inventory Total by Software Version
Inventory Total by Product Name
Inventory Total by Product Type
Online Inventory by Version
Module Status
Inventory Detail
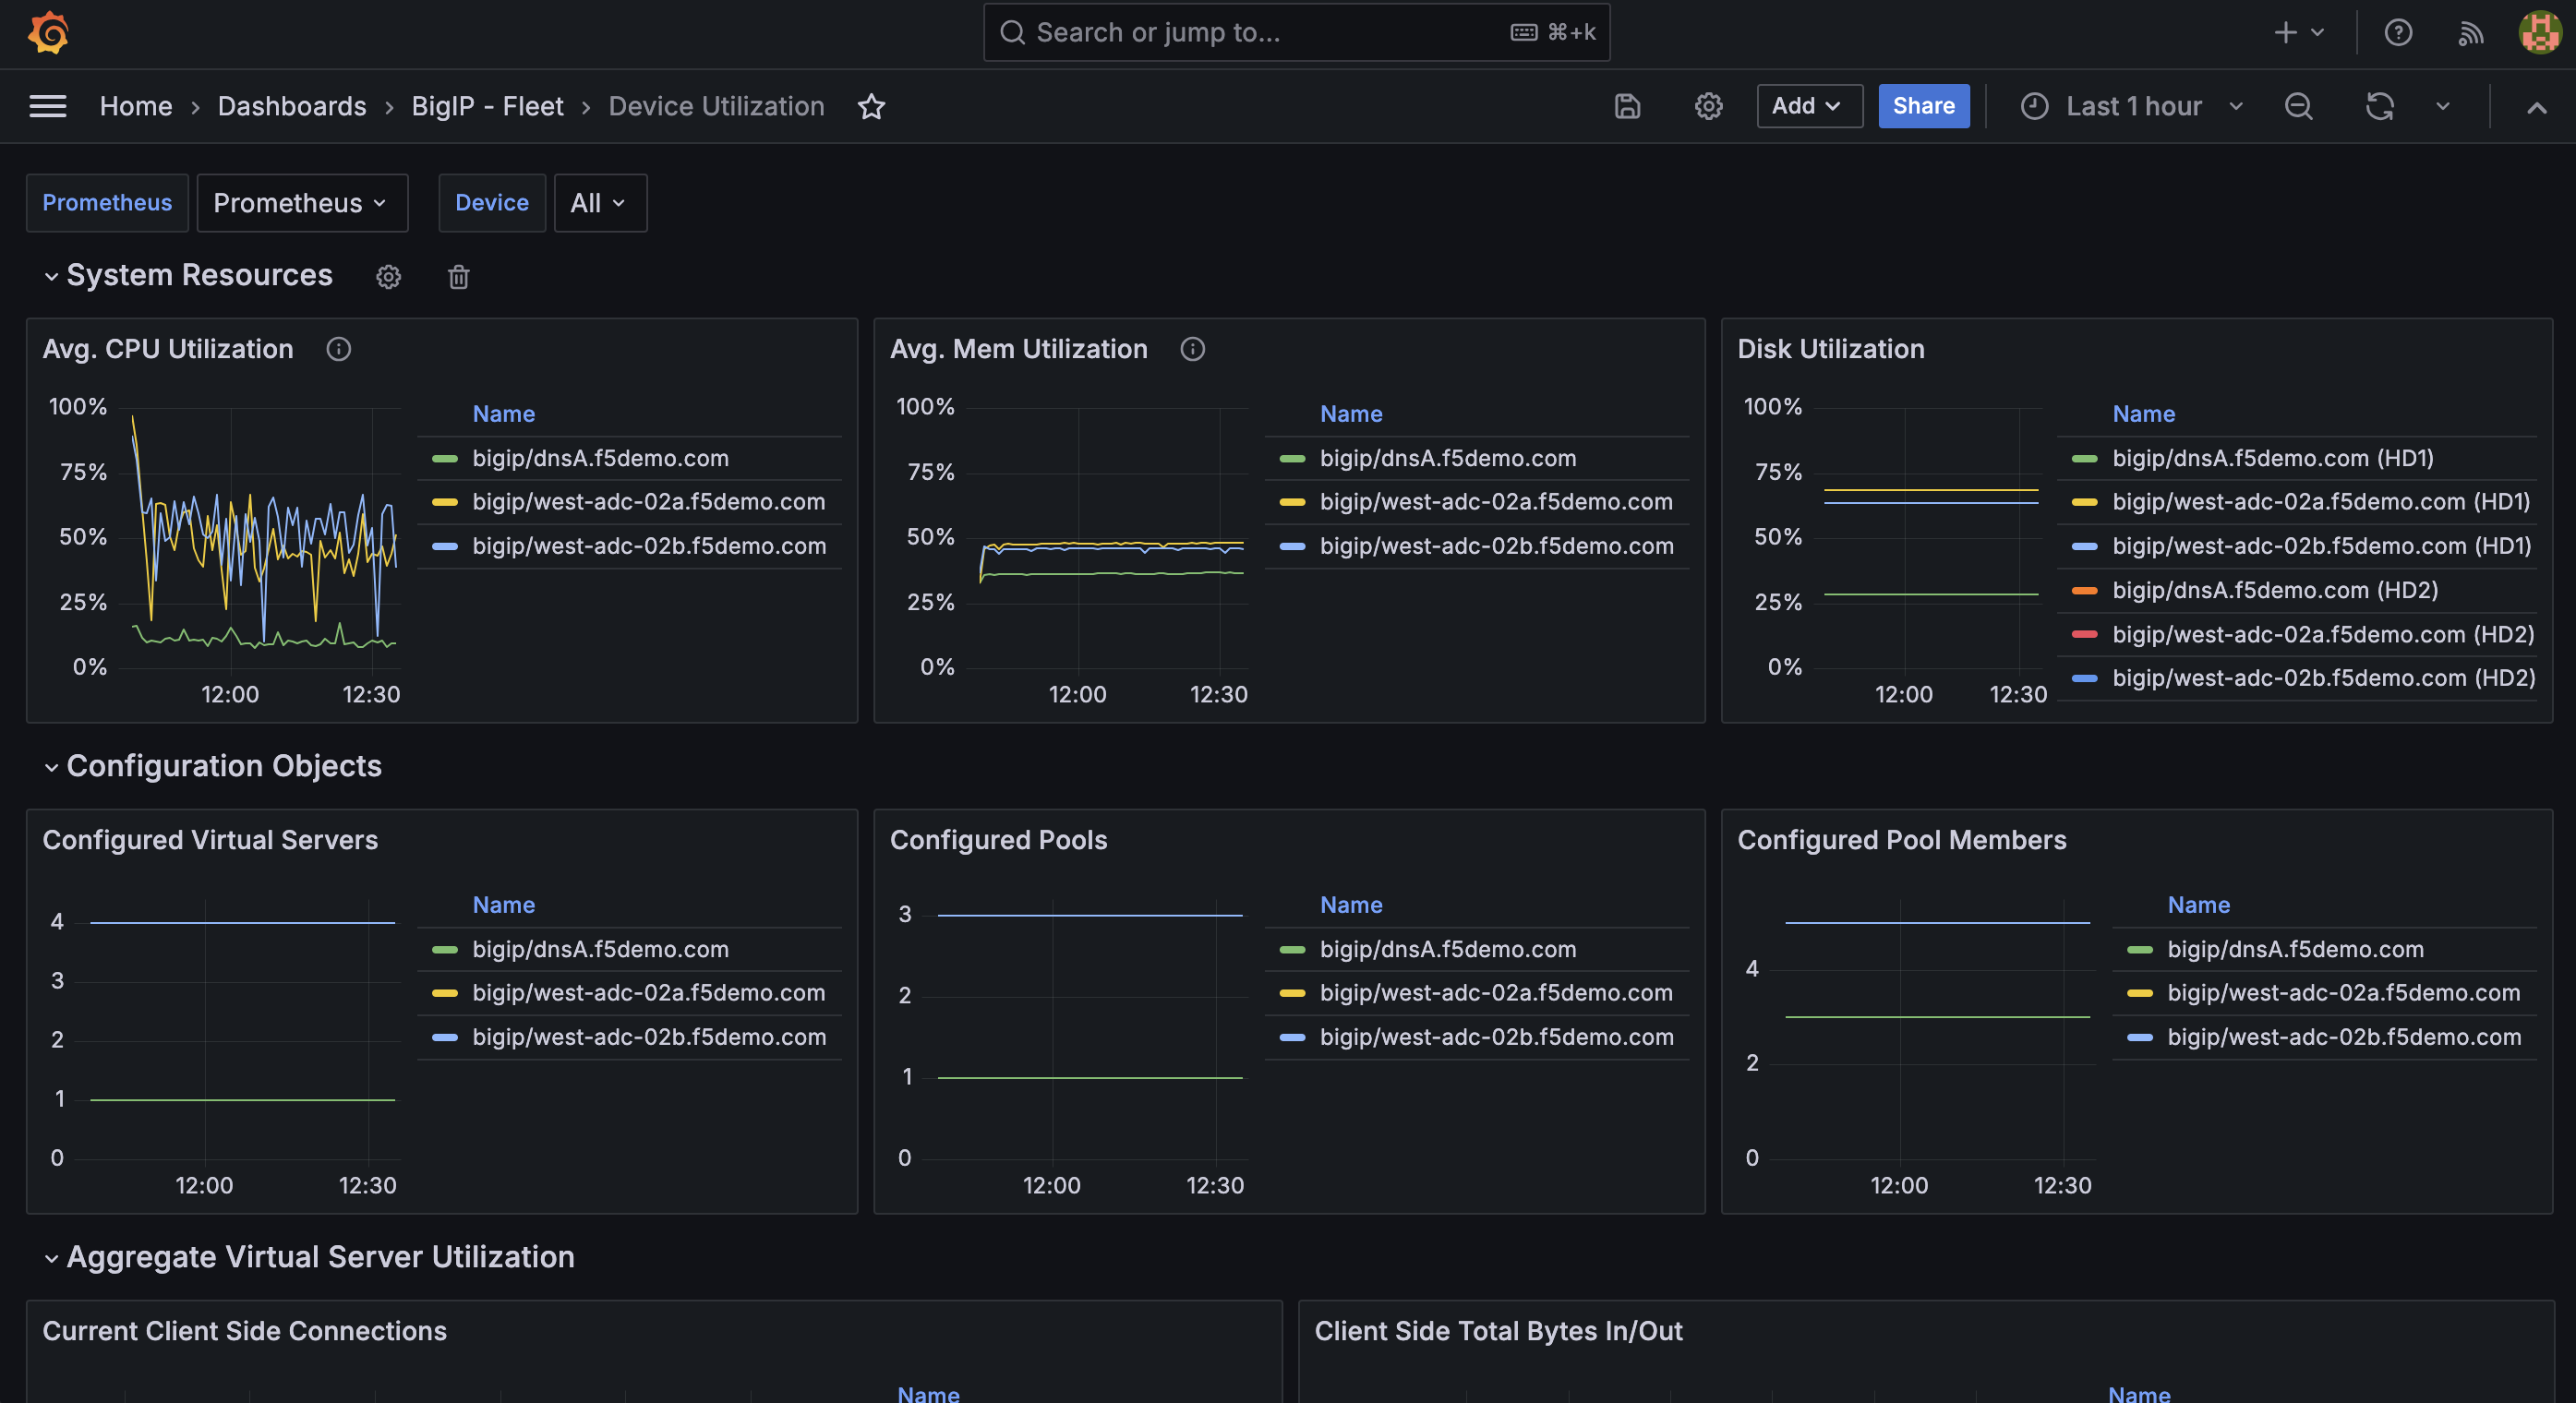
Device Utilization
The Device Utilization dashboard contains data pertaining to metrics such as resource utilization and F5 BIG-IP configuration objects.
Available Metrics include:
System Resources
Average CPU Utilization
Average Memory Utilization
Disk Utilization
Configuration Objects
Configured Virtual Servers
Configured Pools
Configured Pool Members
Average Virtual Server Utilization
Current Client Side Connections
Client Side Data Rate In/Out
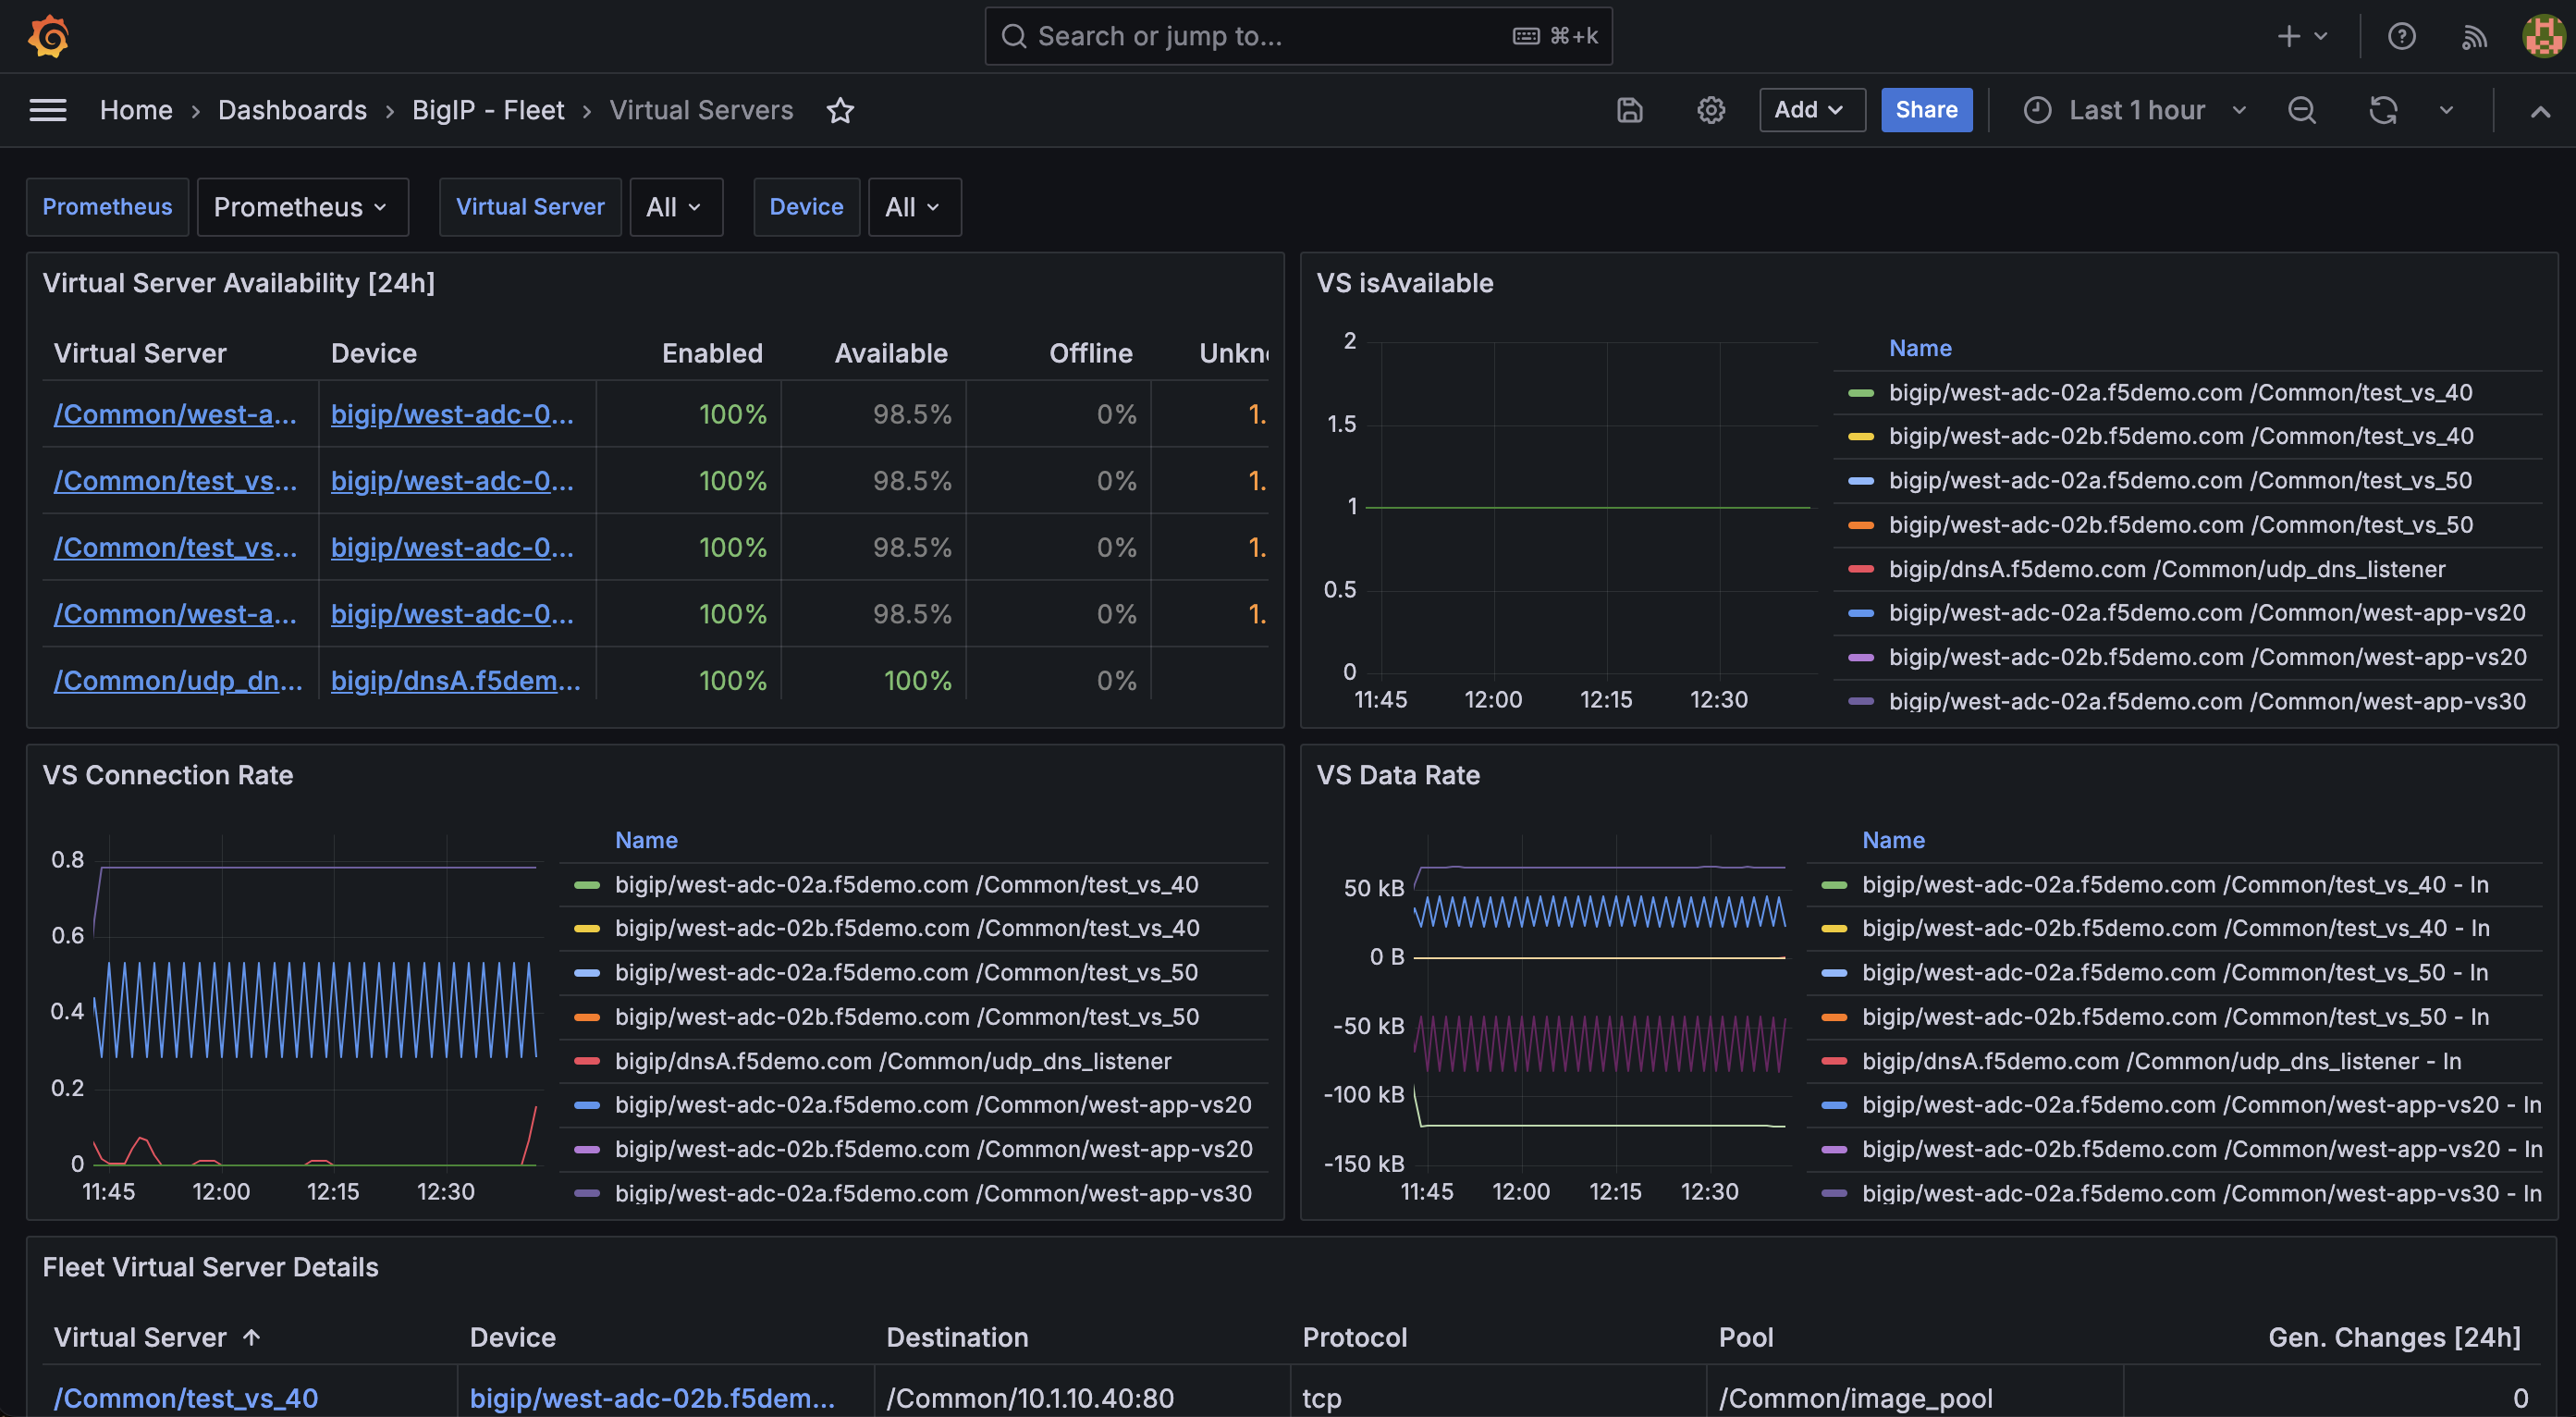
Virtual Servers
The Virtual Servers dashboard give a view into availability and connection/data rate stats.
From here, you can also see if changes have occurred within the past 24 hours via the Gen. Changes [24h] column within the Fleet Virtual Server Details section, which answers one of the very first incident-triage questions… what changed?
Available Metrics include:
Virtual Server Availability (24h)
Is Virtual Server Available?
Virtual Server Connection Rate
Virtual Server Data Rate
Fleet Virtual Server Details
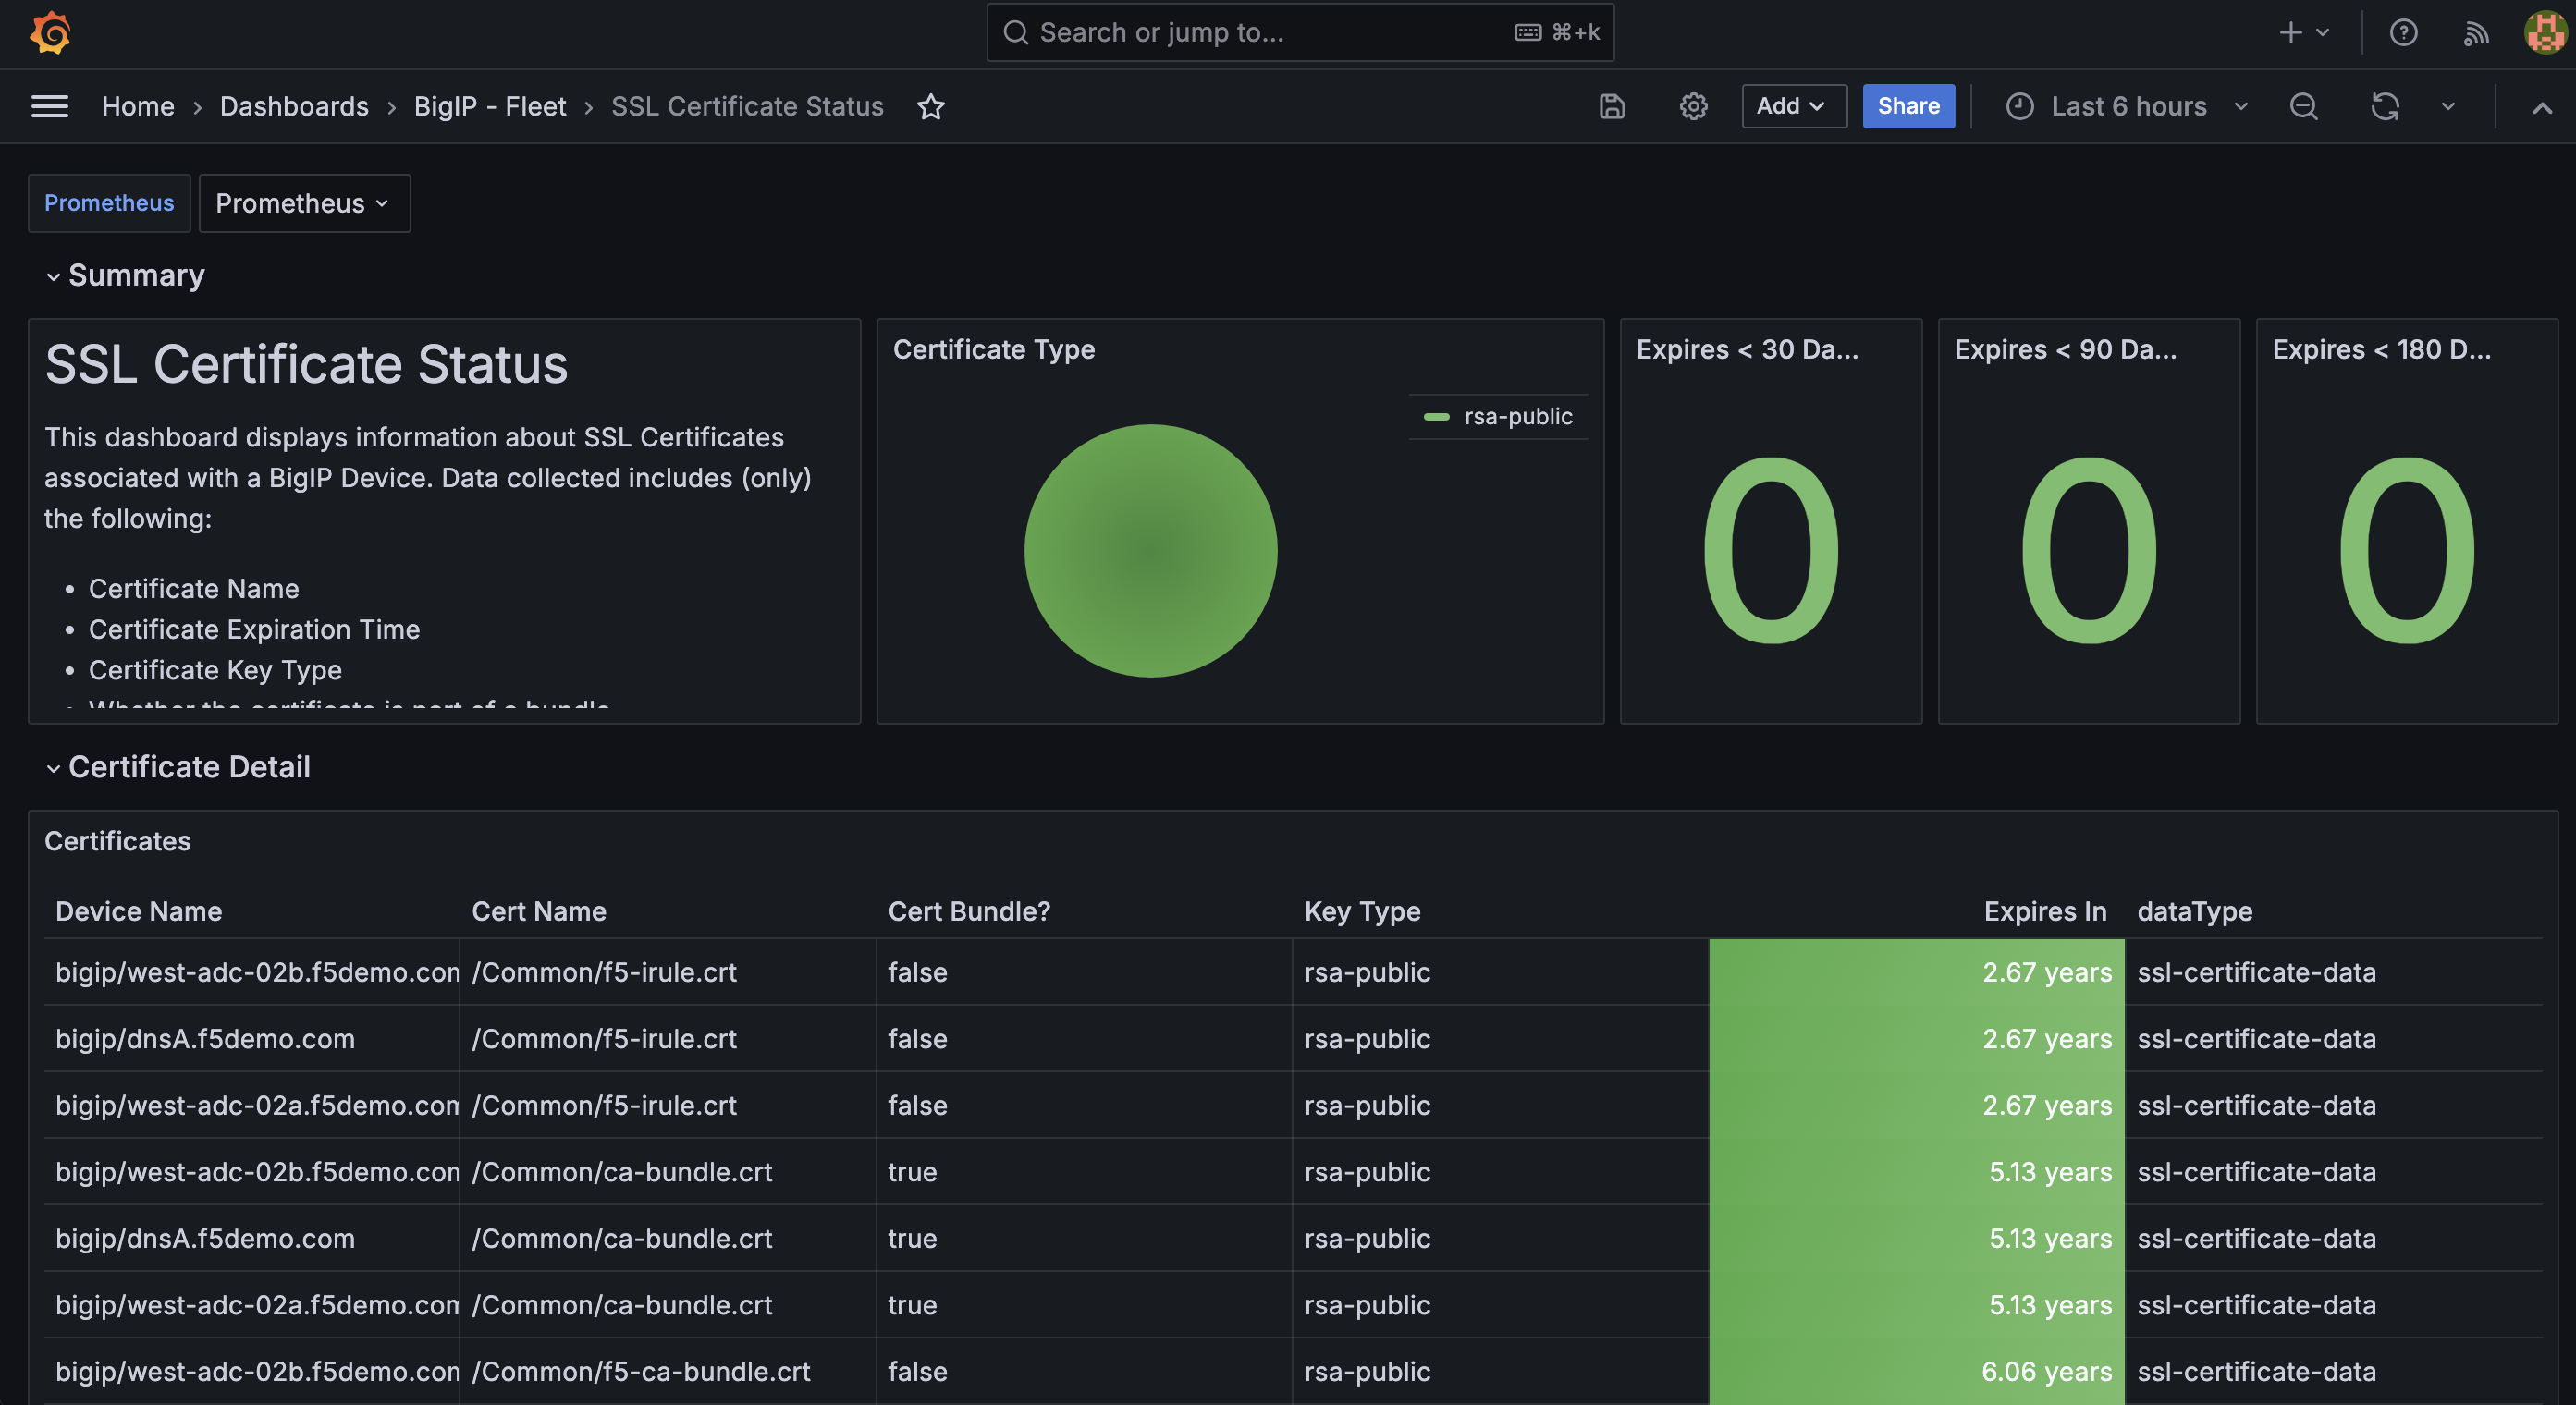
SSL Certificate Status
The SSL Certificate Status dashboard is both self-explanatory and extraordinarily helpful, especially when your F5 BIG-IP estate sprawls datacenters across the globe.
Available Metrics include:
Summary
Certificate Type
Certs Expiring in less than 30 days
Certs Expiring in less than 90 days
Certs Expiring in less than 180 days
Certificate Detail List
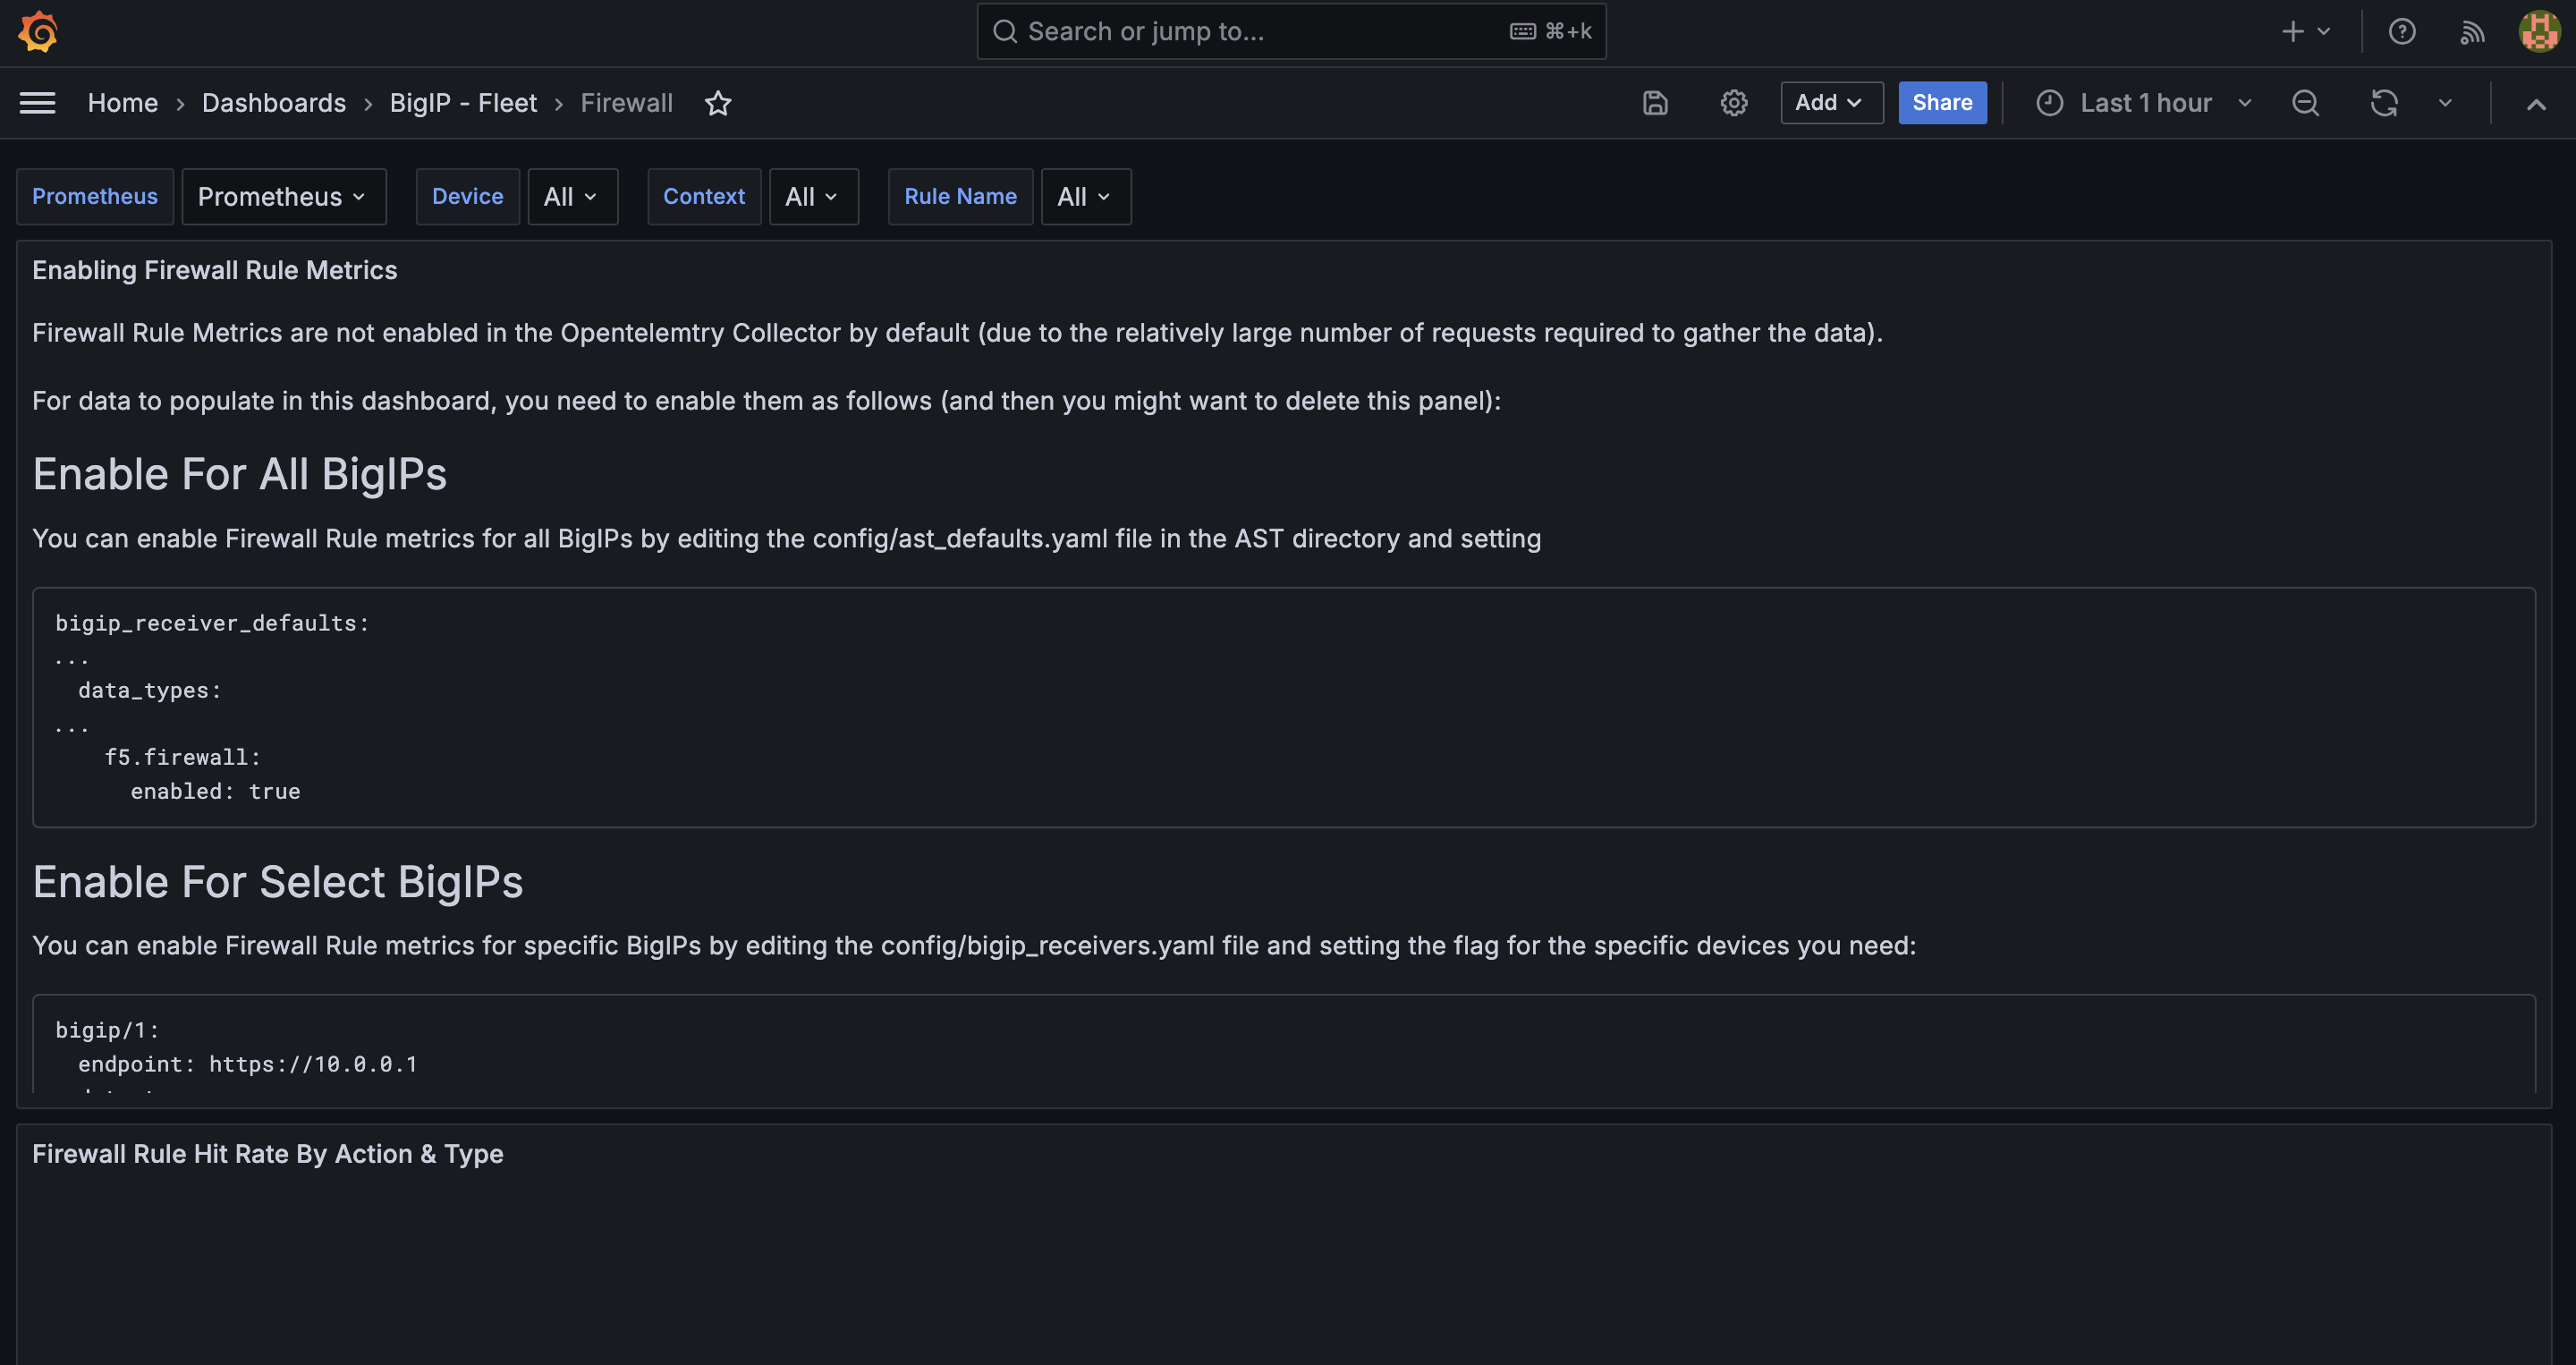
Firewall
The Firewall dashboard is simple, straightforward, and eye-opening for organizations leaning on F5 BIG-IP to provide protection at layers three and four. Visit this dashboard to quickly obtain a view of firewall rule hits and assess trends. Although network and application attacks are becoming increasingly sophisticated, bad actors will almost certainly never stop attempting to exploit layer three/four vulnerabilities.
Note
One of the first things you’ll notice about this dashboard is the presence of configuration instructions. Please take note of these and be sure your ast_defaults.yaml and bigip_receivers.yaml files are properly configured. Otherwise, stats will not be collected and displayed.
Available Metrics include:
Firewall Rule Hit Rate by Action & Type
Firewall Rule Hits (Last 1h)
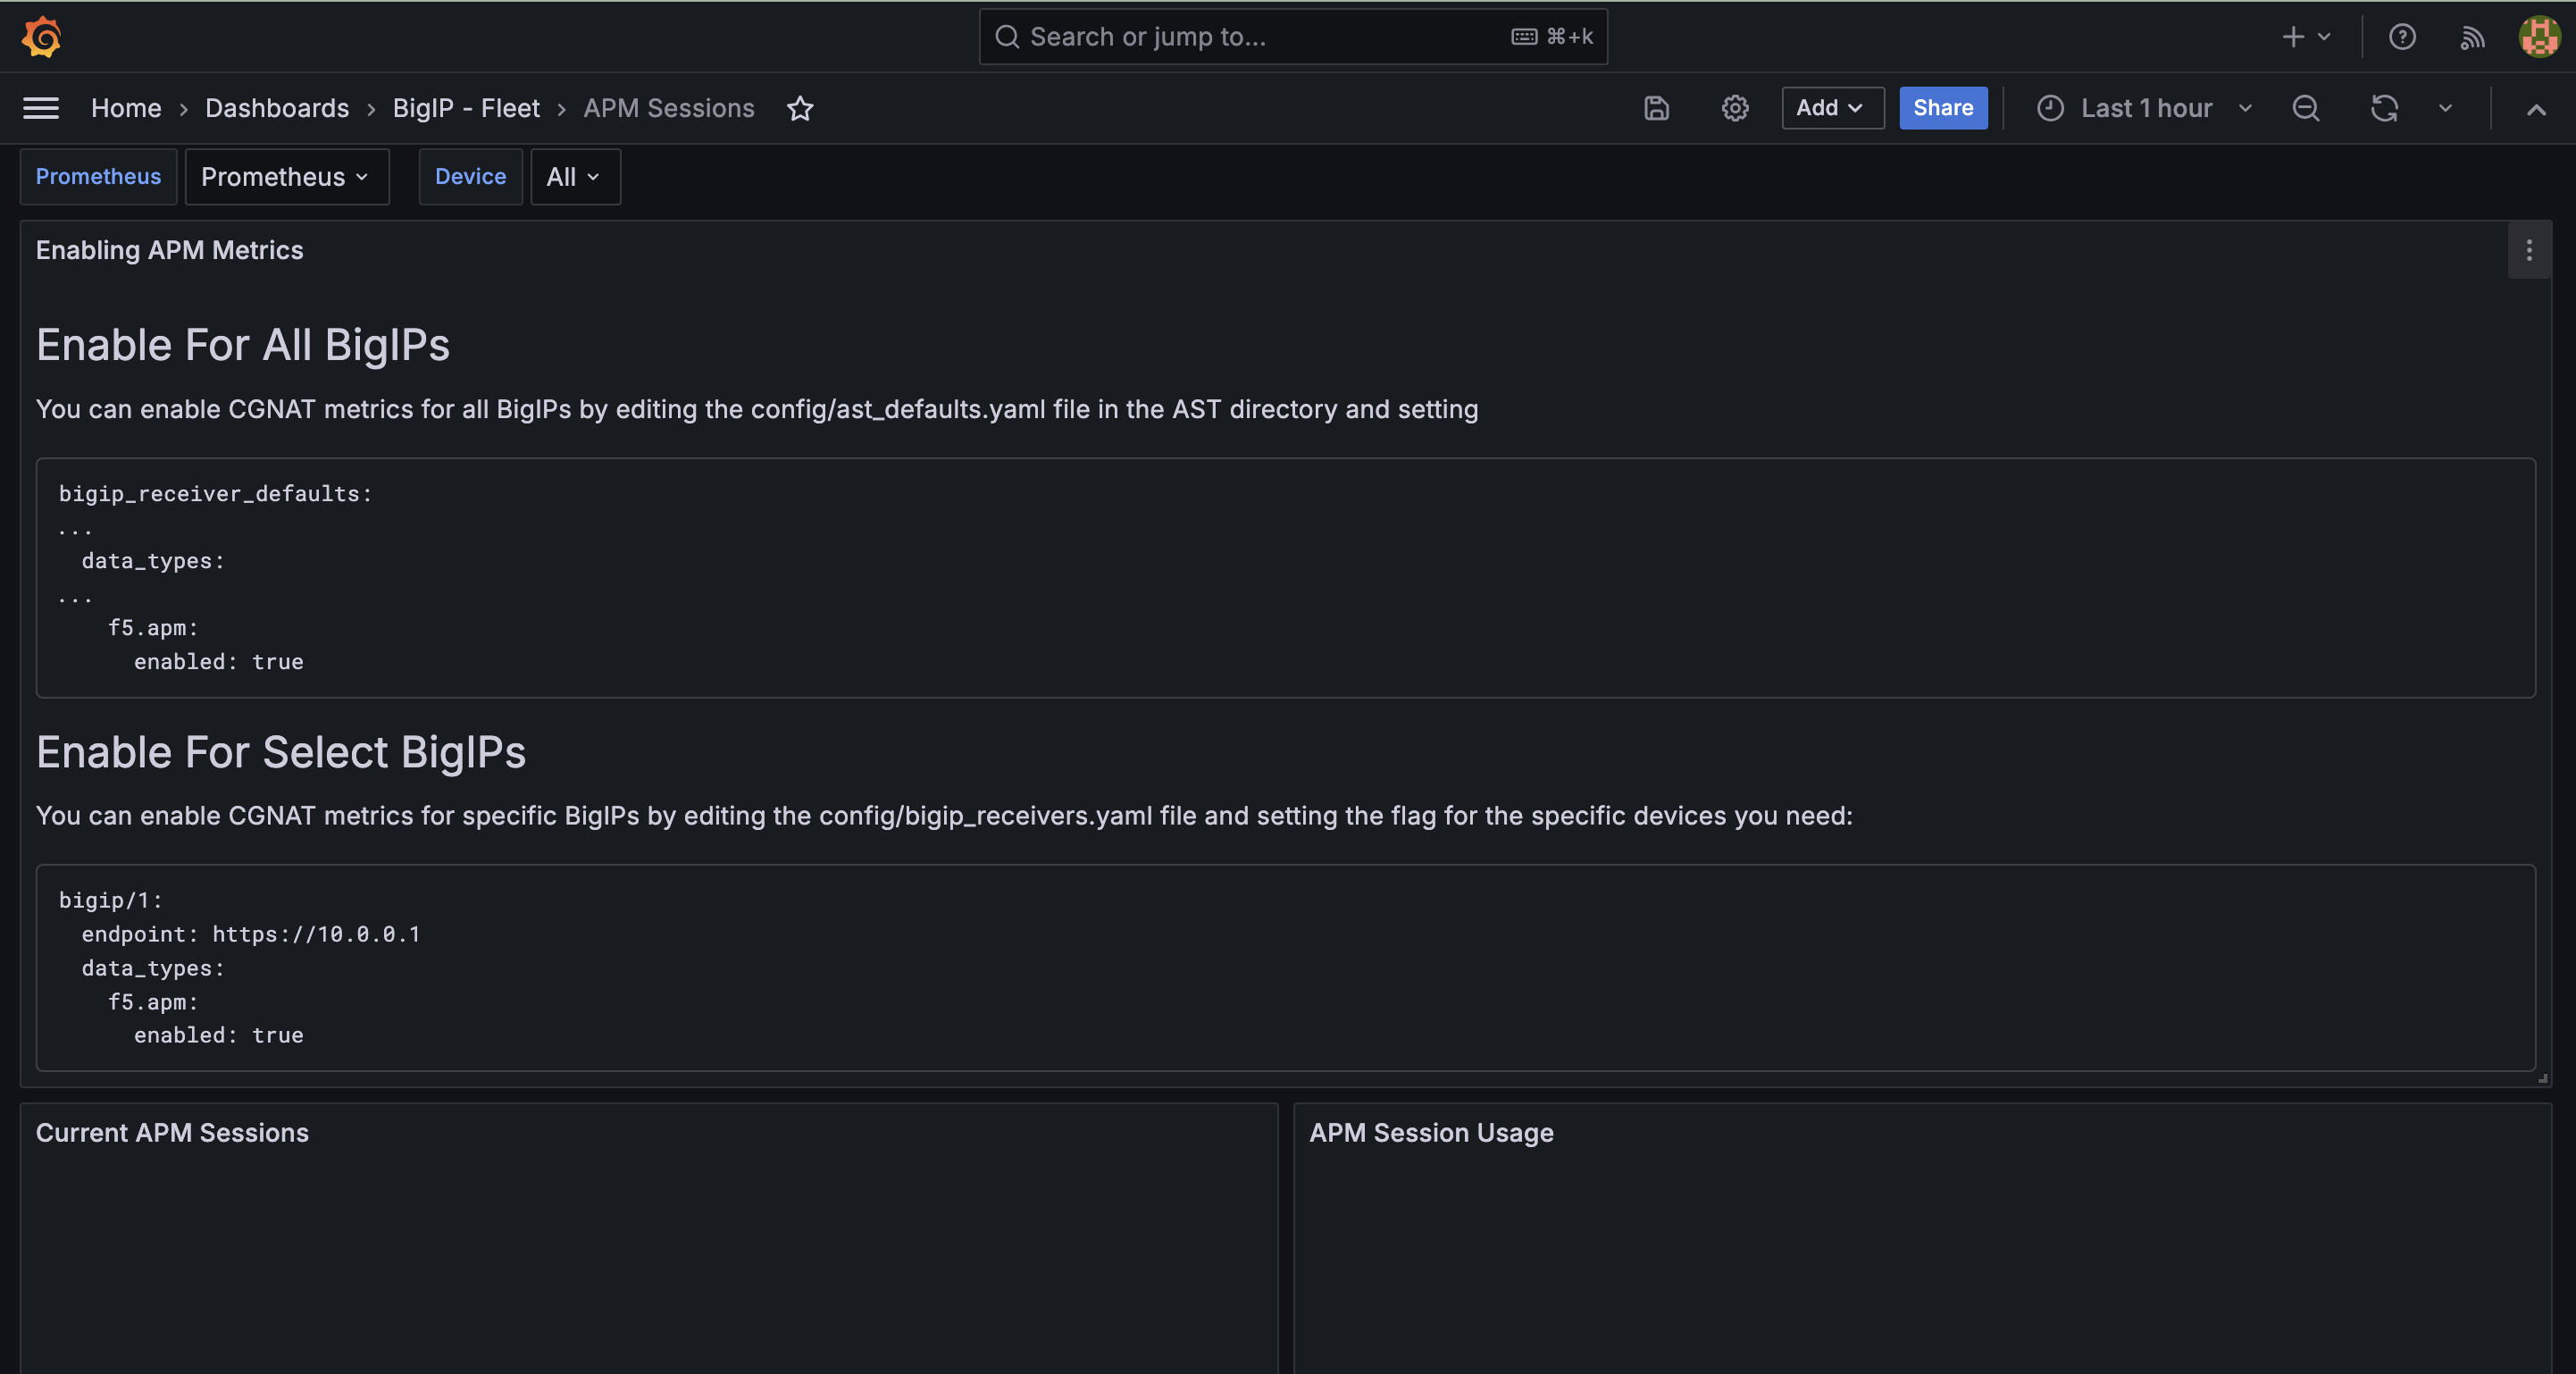
APM Sessions
The APM Sessions dashboard will be an area of focus for teams using their F5 BIG-IPs to wrap access policies and identity access management around applications. Understanding session usage and state enables administrators to analyze access policy trends and ensure proper sizing for concurrent connectivity units (CCUs). This aids in preventing hitting a CCU ceiling, which can result in rejected user connections and poor digital experiences.
Note
One of the first things you’ll notice about this dashboard is the presence of configuration instructions. Please take note of these and be sure your ast_defaults.yaml and bigip_receivers.yaml files are properly configured. Otherwise, stats will not be collected and displayed.
Available Metrics include:
Current APM Sessions
APM Session Usage
Current APM Access Sessions by State
APM Access Sessions Usage
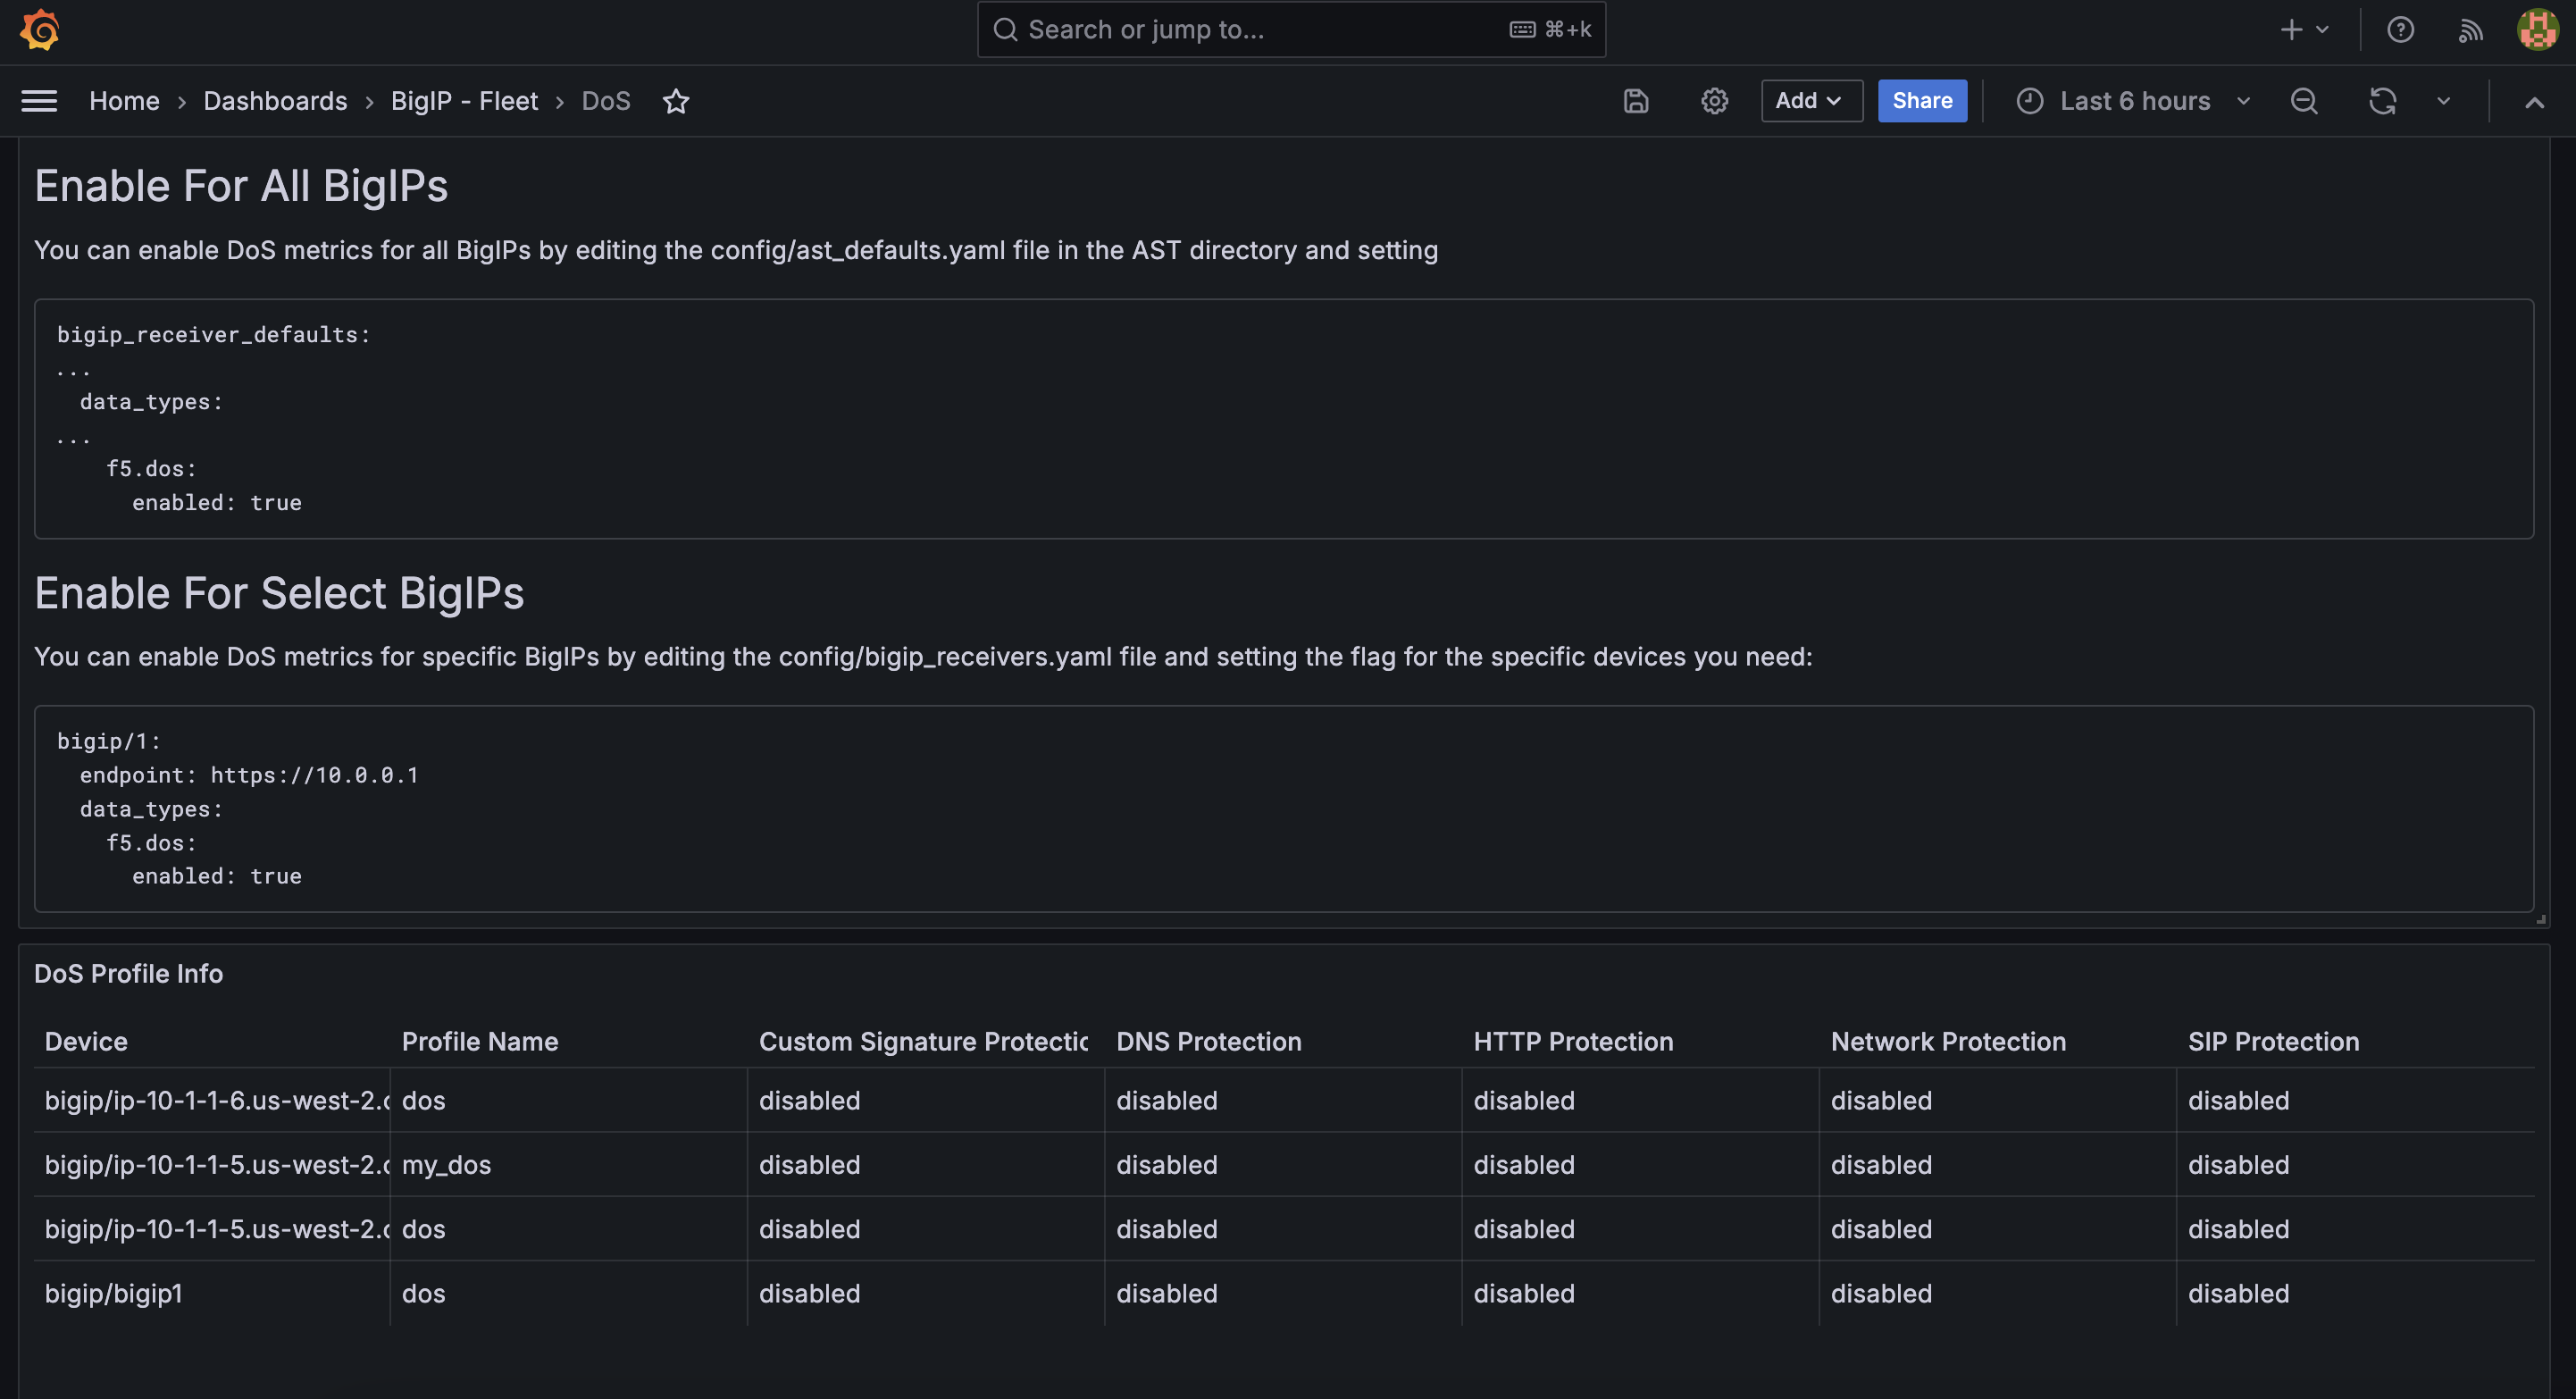
DoS
The DoS dashboard brings Denial of Service metrics to the forefront. This is a major area of focus especially for teams with F5 BIG-IPs deployed at or near the edge. There is great value in understanding the status of DoS mitigation efforts, and this dashboard helps deliver key stats.
Note
One of the first things you’ll notice about this dashboard is the presence of configuration instructions. Please take note of these and be sure your ast_defaults.yaml and bigip_receivers.yaml files are properly configured. Otherwise, stats will not be collected and displayed.
Available Metrics include:
DoS Profile Info
DoS Stats Rate
DoS Attacks Rate
DoS Drops Rate
DoS Stats by Vector
DoS Attacks by Vector
DoS Drops by Vector
DoS BA Stats Rate
DoS BA Detected Rate
DoS BA Drops Rate
DoS BD Stats Rate
DoS BD Detected Rate
DoS BD Drops Rate
DoS Bytes Rate
DoS Byte Drop Rate
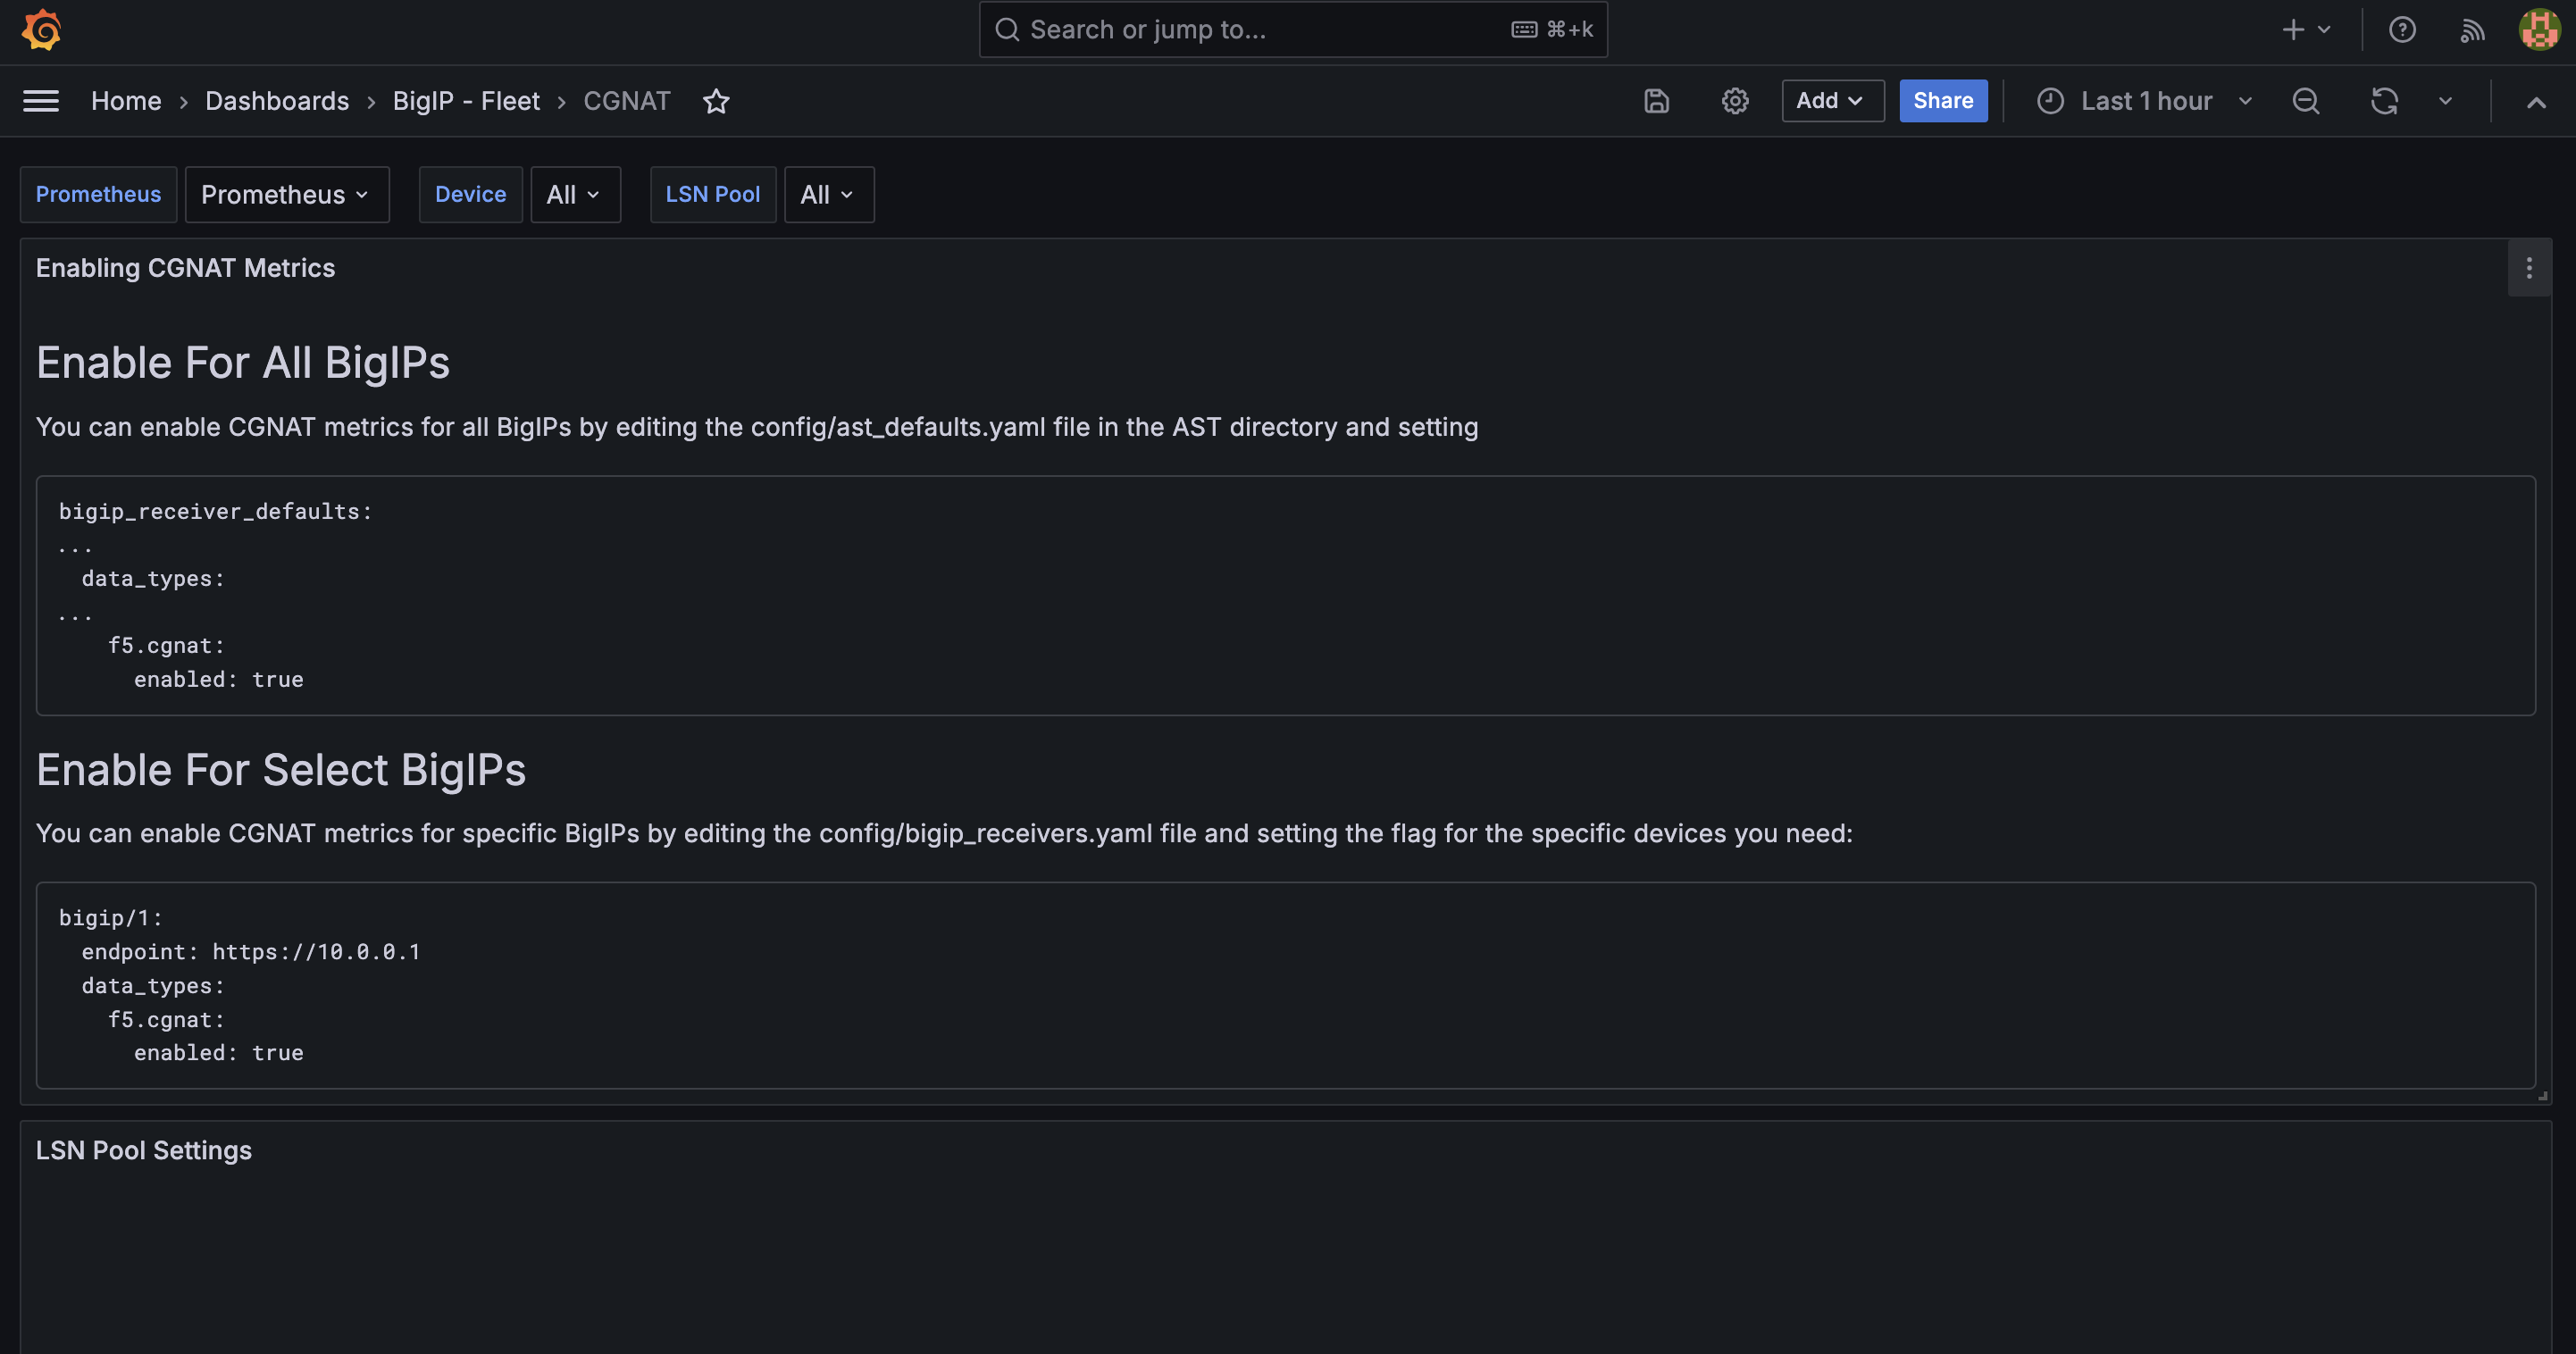
CGNAT
The CGNAT dashboard is geared toward delivery of Carrier-Grade Network Address Translation stats to folks in the service provider realm. Service providers run tight ships with serious SLAs and need the best possible performance for their customers, which is aided by the granular level of visibility found here.
Note
One of the first things you’ll notice about this dashboard is the presence of configuration instructions. Please take note of these and be sure your ast_defaults.yaml and bigip_receivers.yaml files are properly configured. Otherwise, stats will not be collected and displayed.
Available Metrics include:
LSN Pool Settings
Pool Translations (Current)
PBA Active Port Blocks
Pool Translation Request Rate
PBA Port Block Allocation Rate
Port Translation Request Failure Rate
PBA Port Block Allocation Failure Rate
Please select Next below and continue on to BIG-IP - Device Dashboards.