F5 Application Study Tool Labs > Class 1: Introduction to F5 Application Study Tool > Module 3: Exploring the F5 AST Dashboards Source | Edit on
BIG-IP - Device Dashboards
In this lab, we’ll explore the Application Study Tool’s BIG-IP Device dashboards:
Top N
Device Overview
Device WAF Overview
Device Pools
Device Virtual Servers
Device iRules
Device GTM
Device SSL
Note
There is an exhaustive list of metrics collected, some of which have been exposed through the pre-built dashboards you are about to explore.
These dashboards provide views into fundamental metrics we have observed have value in real-world scenarios, based upon field experience. We have designed this tool in a way that facilitates and enables users to customize it to meet their unique needs. Grafana provides just that, and we encourage you to add it into your toolbelt.
From the Grafana Dashboards landing page, select BIG-IP - Device
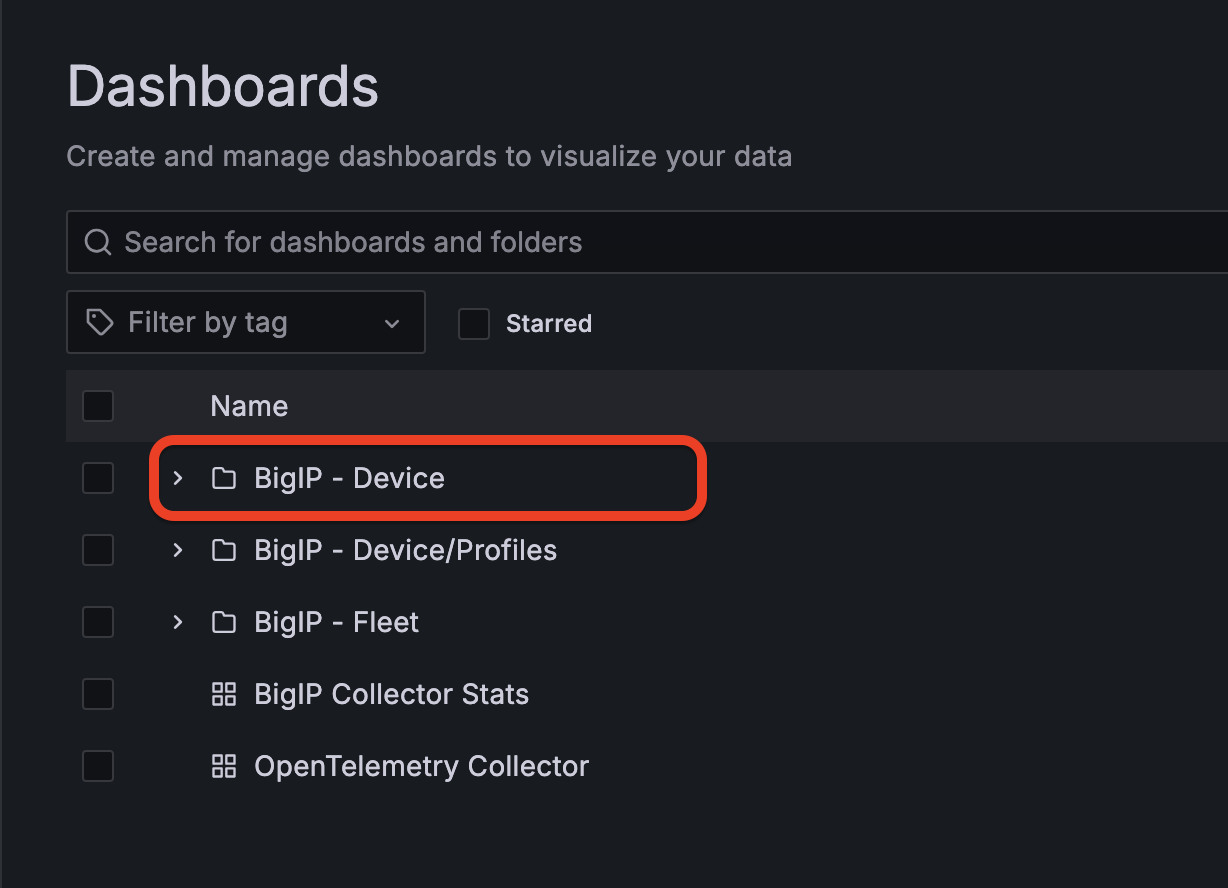
You’ll be presented with a list of available dashboards:
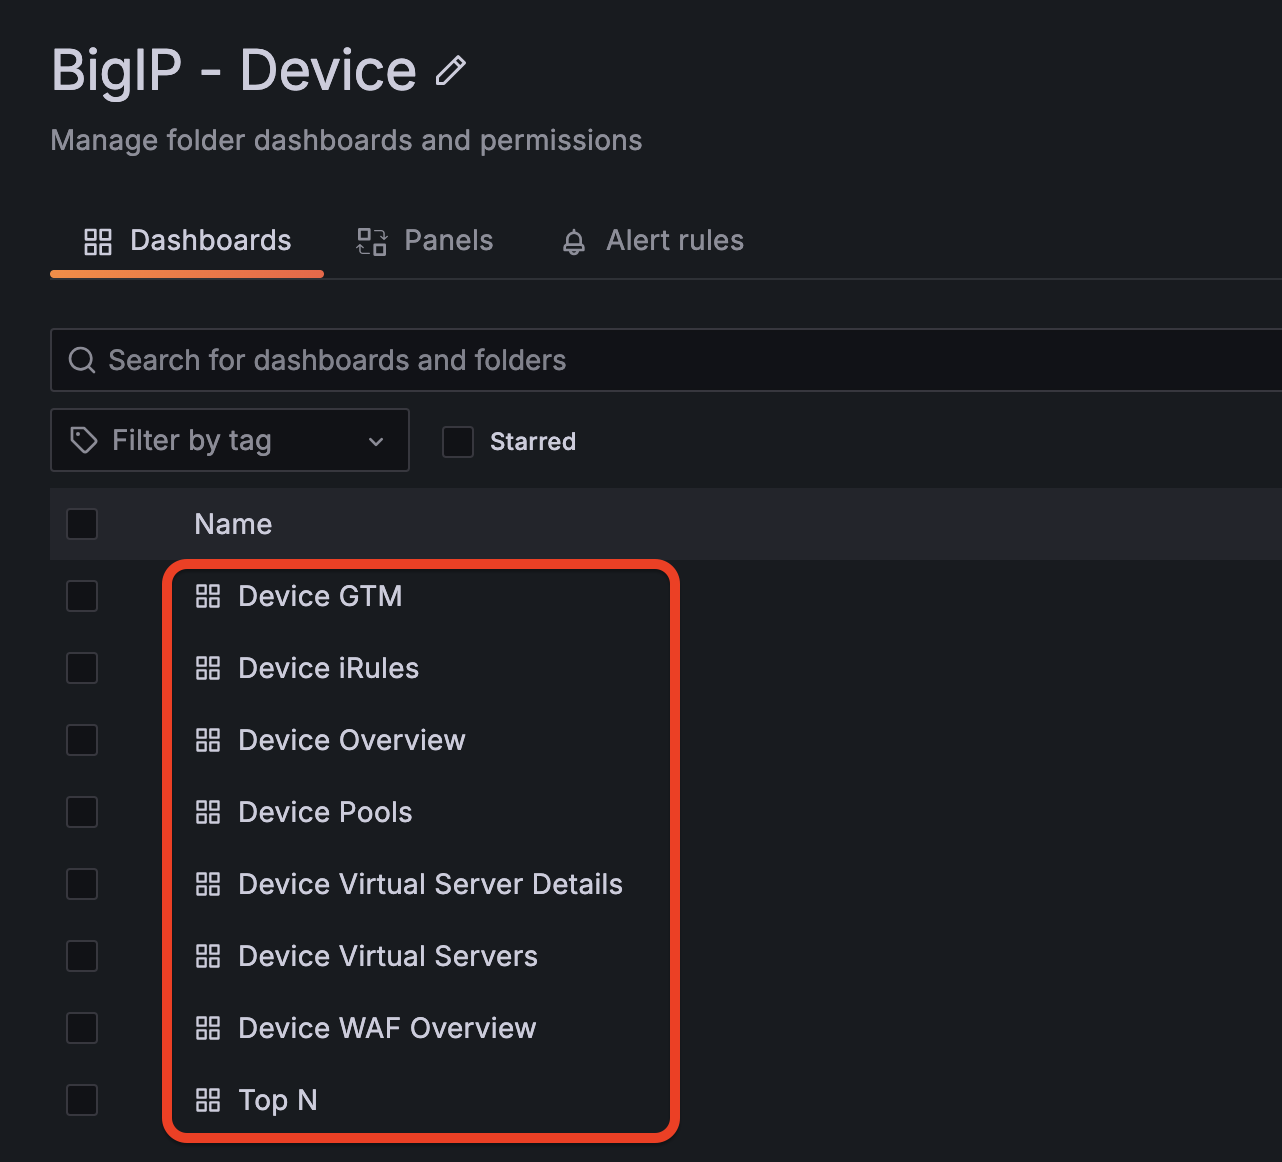
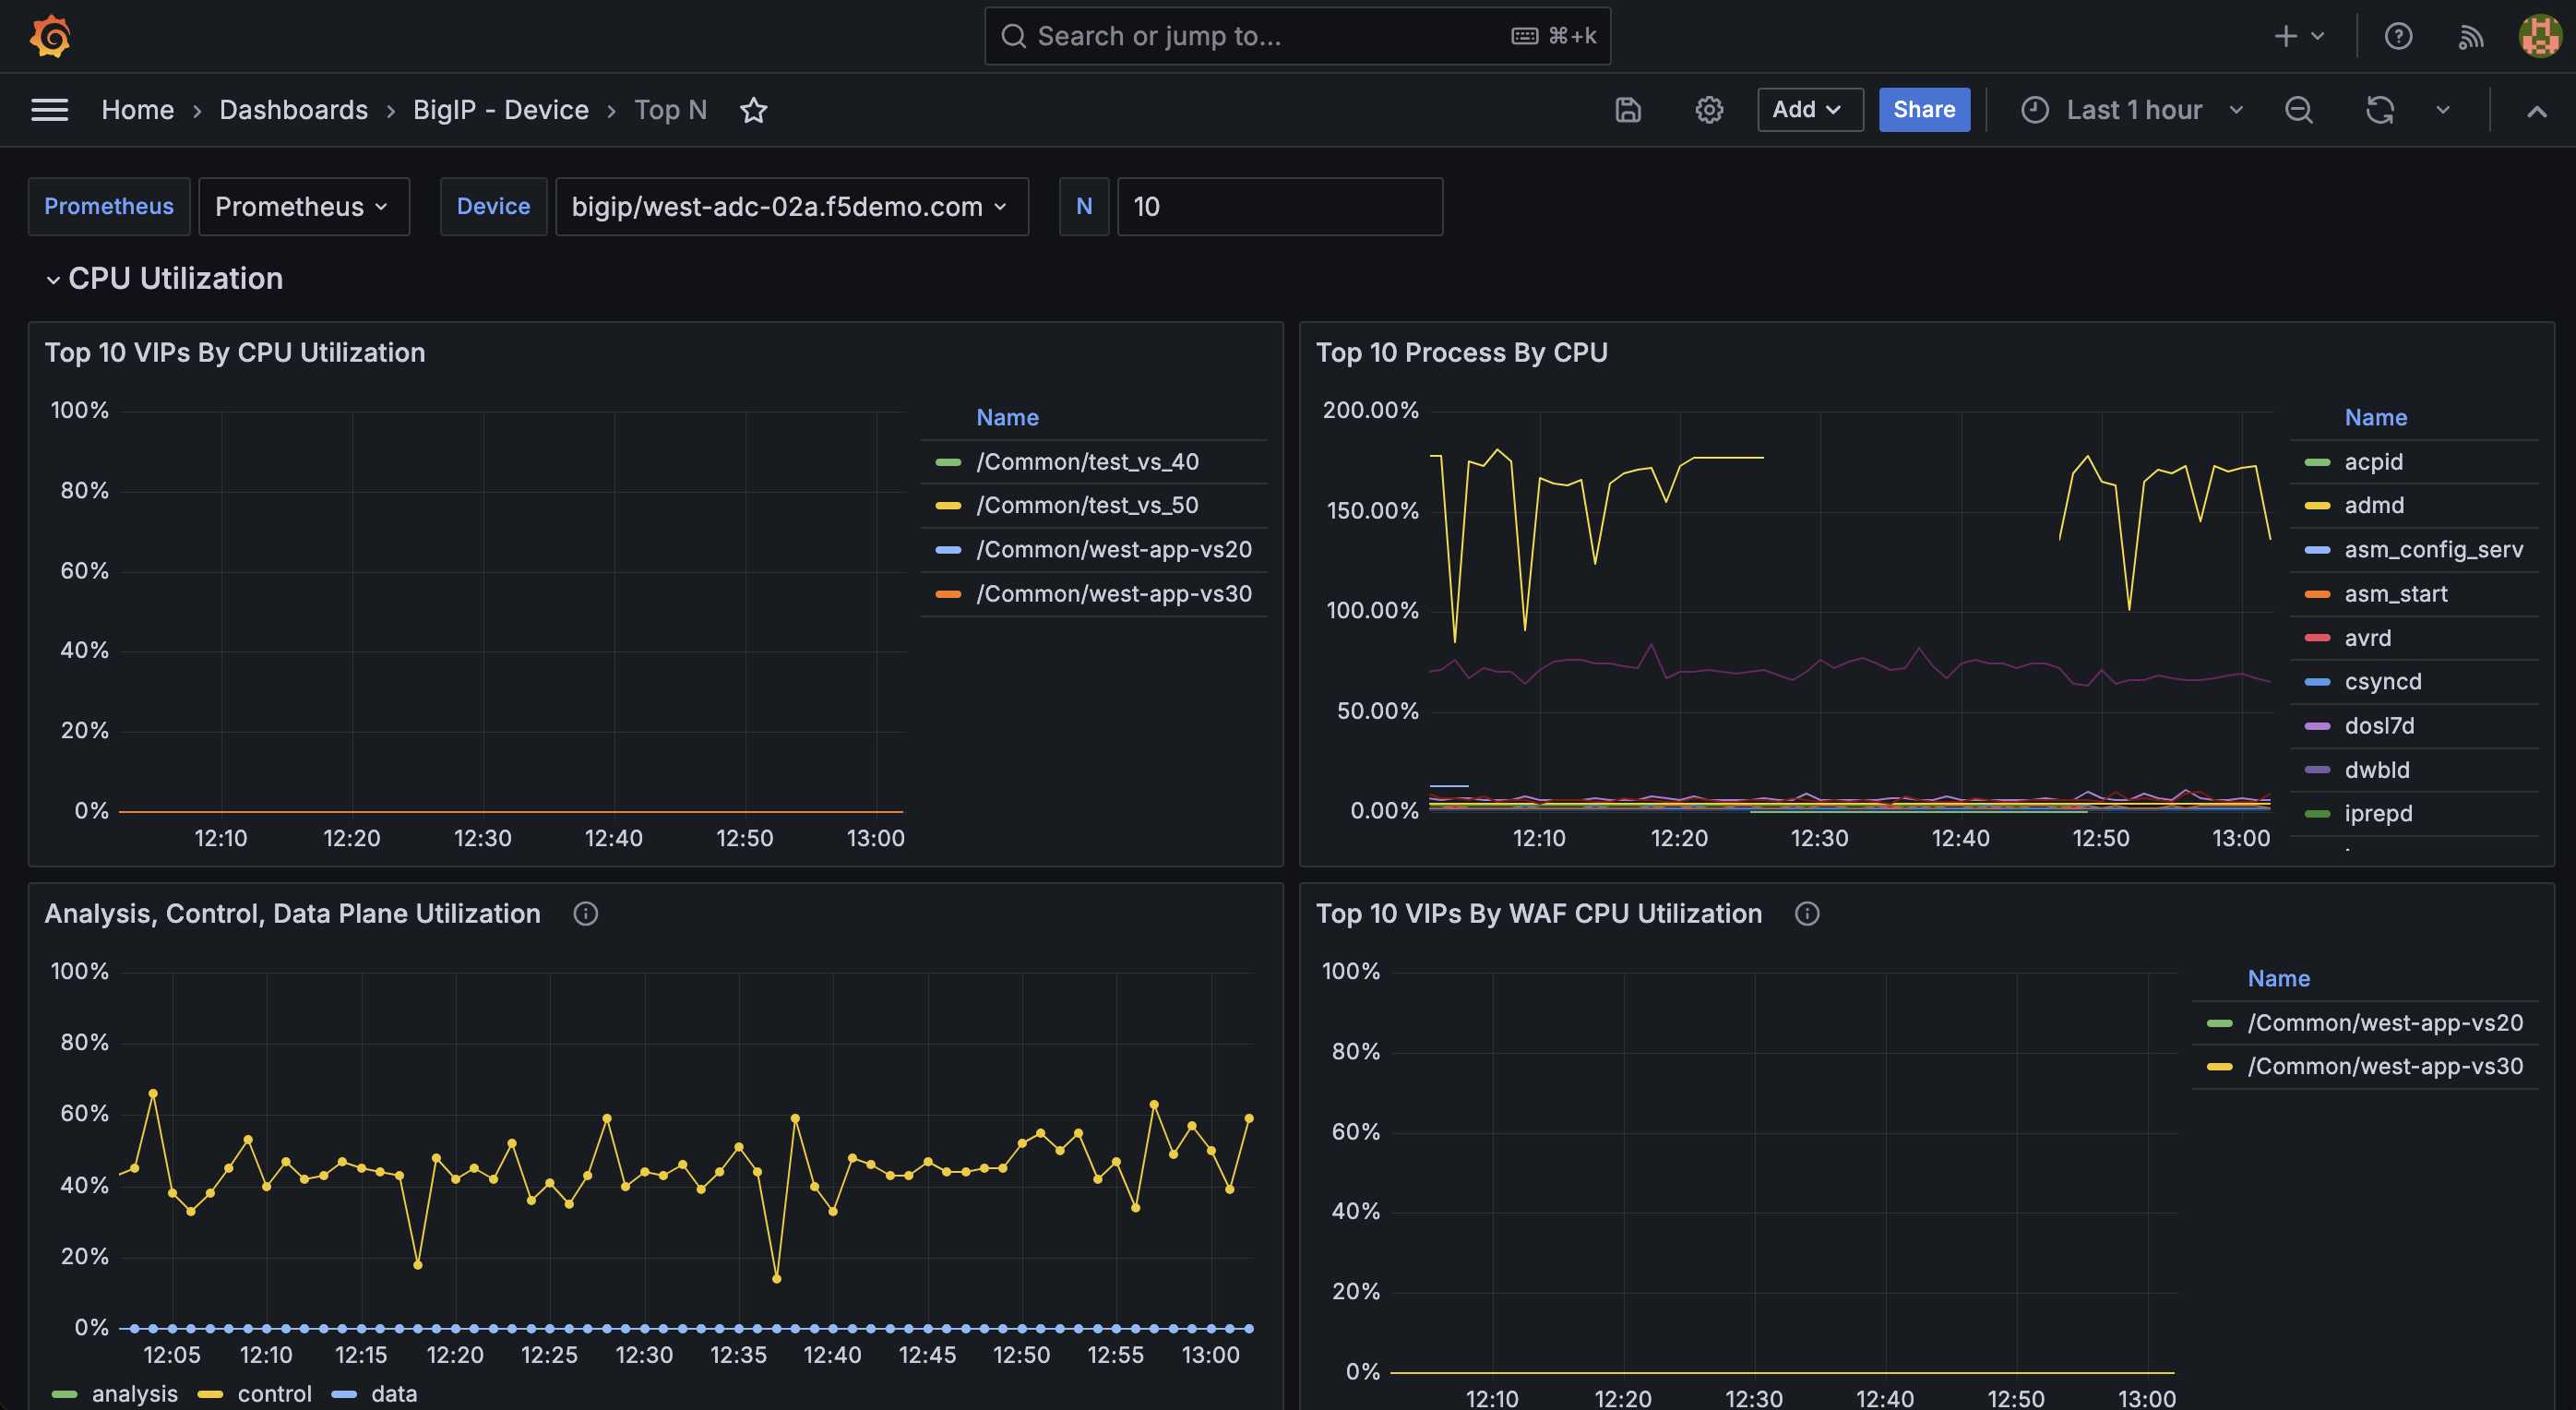
Top N
The Top N dashboard aggregates a number of Top 10 impactful metrics, such as Top 10 VIPs by CPU Utilization and Top 10 Virtual Servers By Low Availability.
Available Metrics include:
CPU Utilization
Top 10 VIPs by CPU Utilization
Top 10 Processes by CPU
Analysis, Control, and Data Plane Utilization
Top 10 VIPs by WAF CPU Utilization
Top Pools / Members
Top 10 Pools by Active Connections
Top 10 Pool Members by Active Connections
Availability
Top 10 Virtual Servers By Low Availability (last 24 hours)
Top 10 Virtual Servers By Low Availability (last 14 days)
Top 10 Pools By Low Availability (last 24 hours)
Top 10 Pools By Low Availability (last 14 days)
Top 10 Pool Members By Low Availability (last 24 hours)
Top 10 Pool Members By Low Availability (last 14 days)
Top VIPs
Top 10 VIPs by SSL TPS Utilization
Top 10 VIPs by Bandwidth
Top 10 VIPs by Object Count
Top 10 VIP-Applied Profile Types
iRule Utilization
Top 10 iRules by Cycles Per Execution
Top 10 iRules by Execution Count
Top 10 iRules by Approximate Cycles Used (last 24 hours)
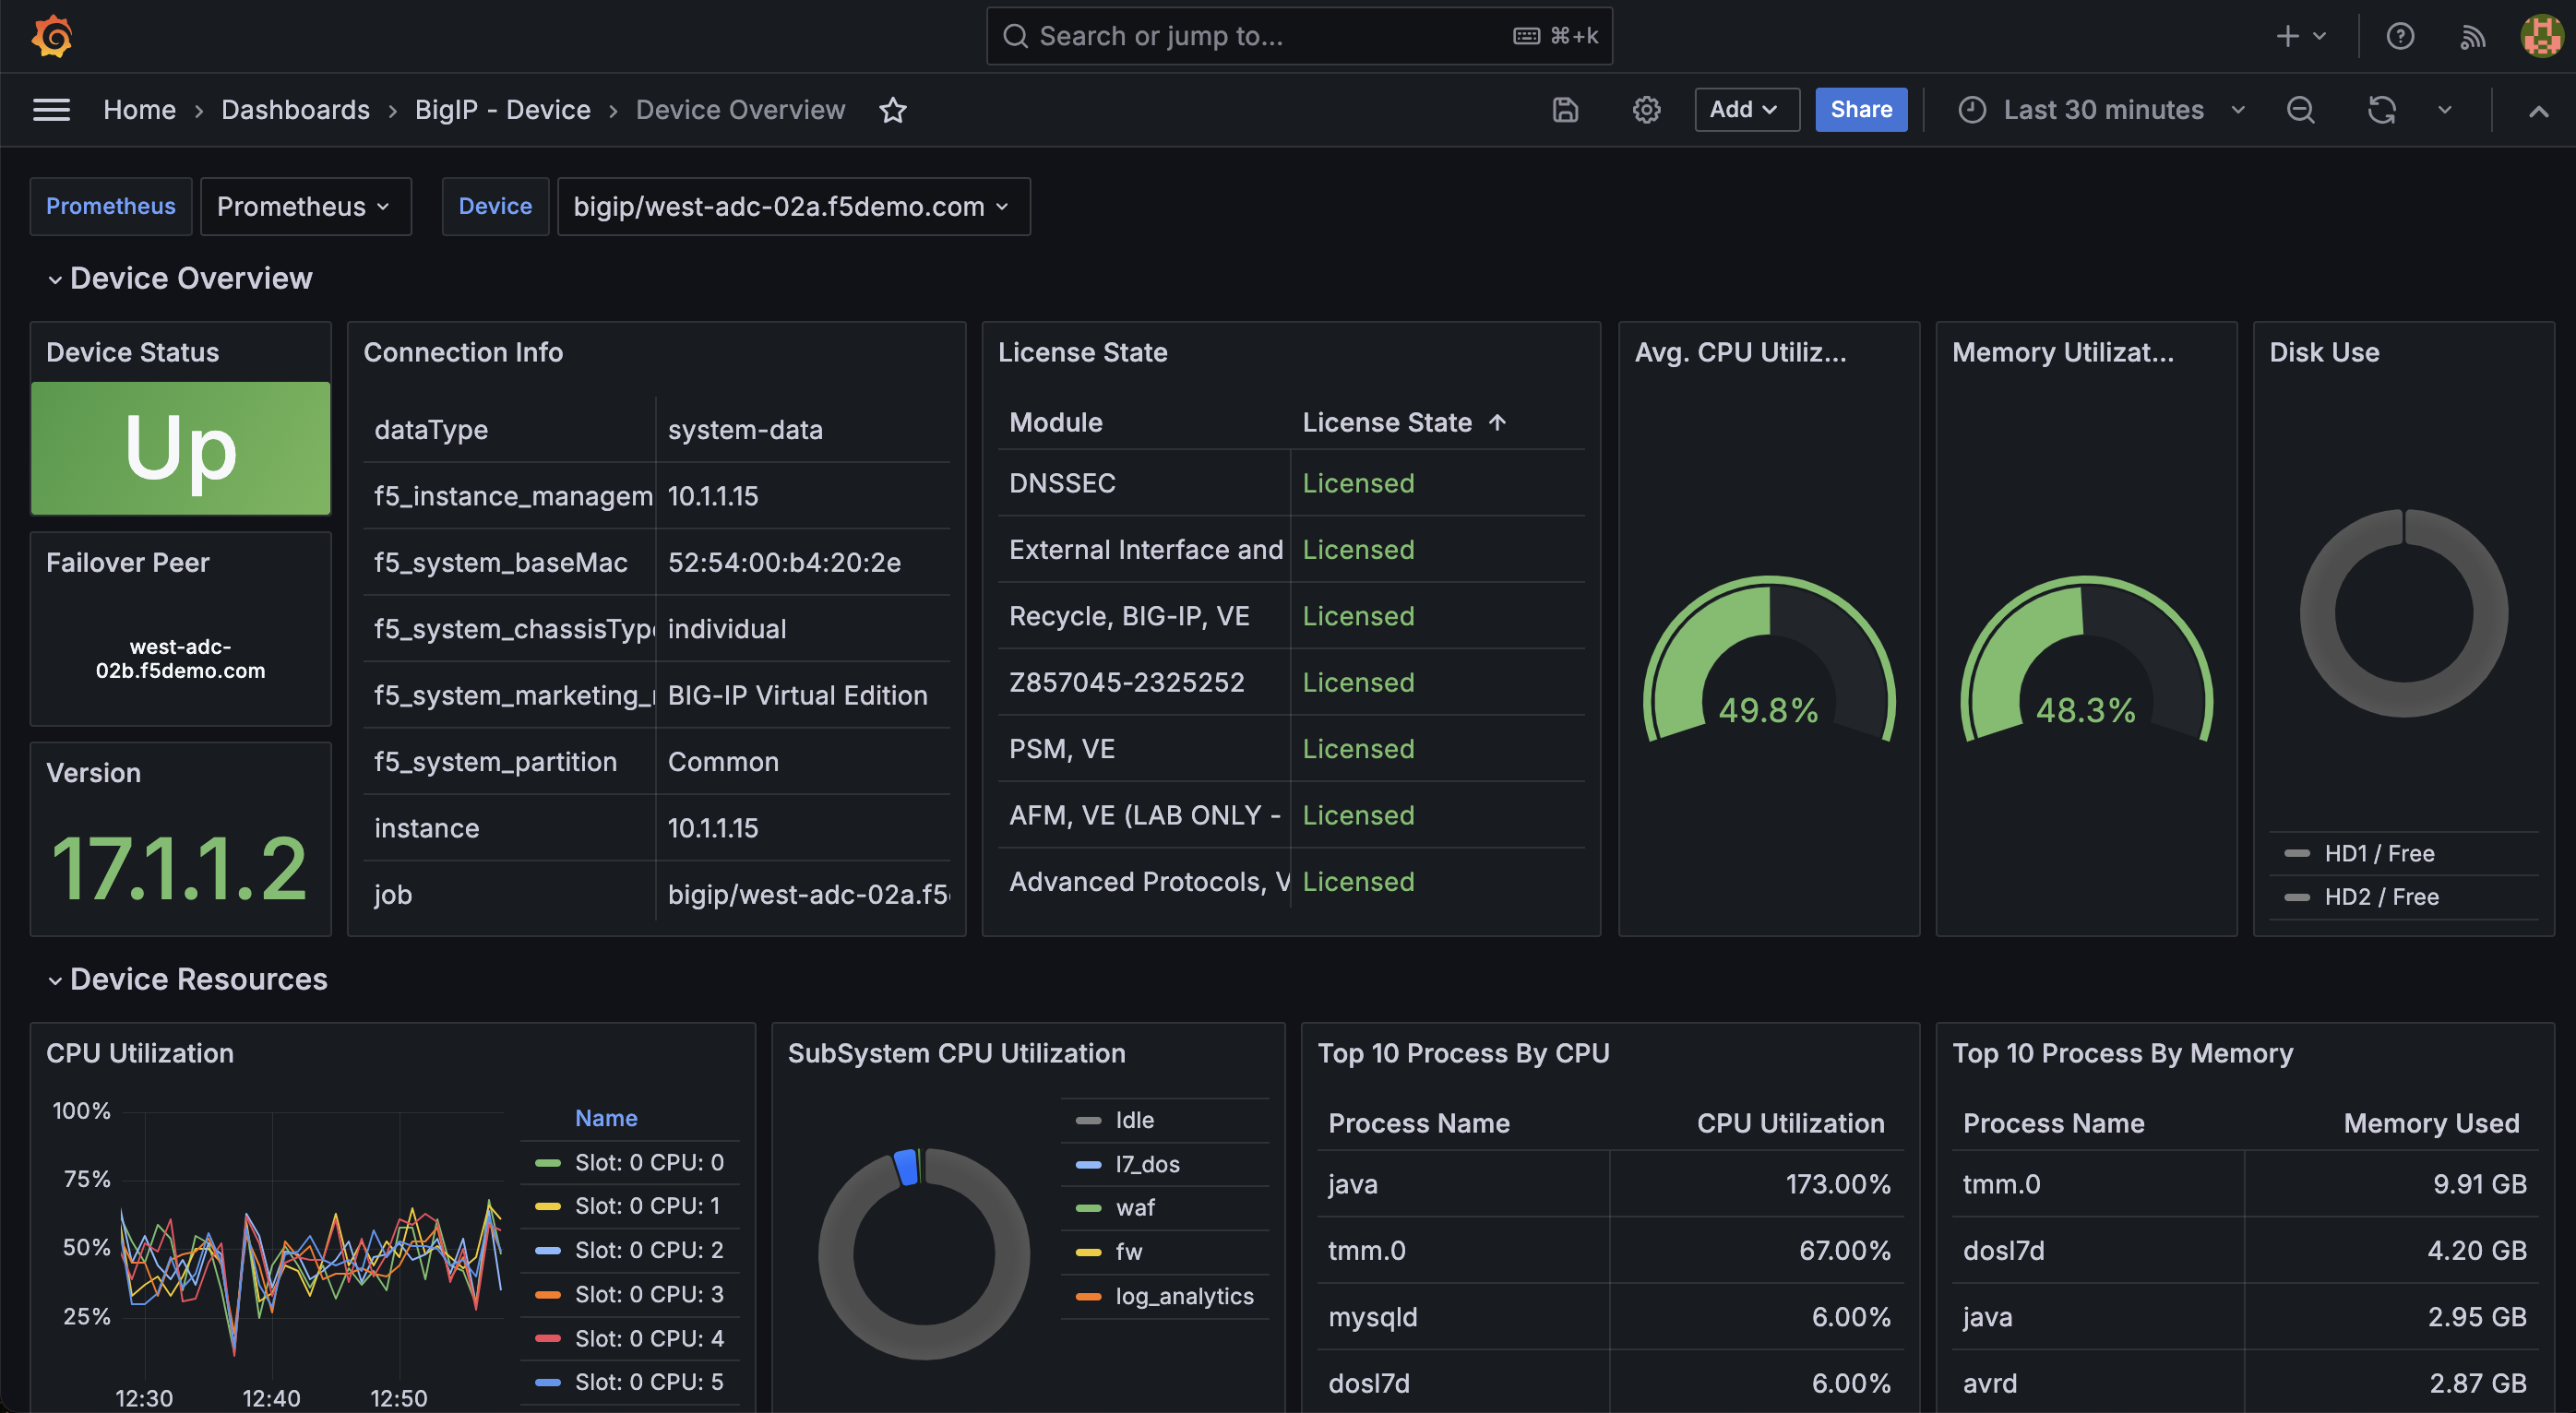
Device Overview
The Device Overview dashboard is where the nitty-gritty of each individual F5 BIG-IP is exposed.
Available Metrics include:
Device Overview
Device Status
Connection Info
License State
Average CPU Utilization
Memory Utilization
Disk Usage
Failover Peer
Version
Device Resources
CPU Utilization
SubSystem CPU Utilization
SubSystem Memory Utilization
Top 10 Processes by CPU
Top 10 Processes by Memory
Memory Utilization
Average CPU Utilization
Disk Usage
Device Virtual Servers
VS Overview
VS Data Rate
VS Concurrent Connections
Device Network
Network Addresses
Network Interface Data Rate
VLAN Info
Network Interface Error Rate
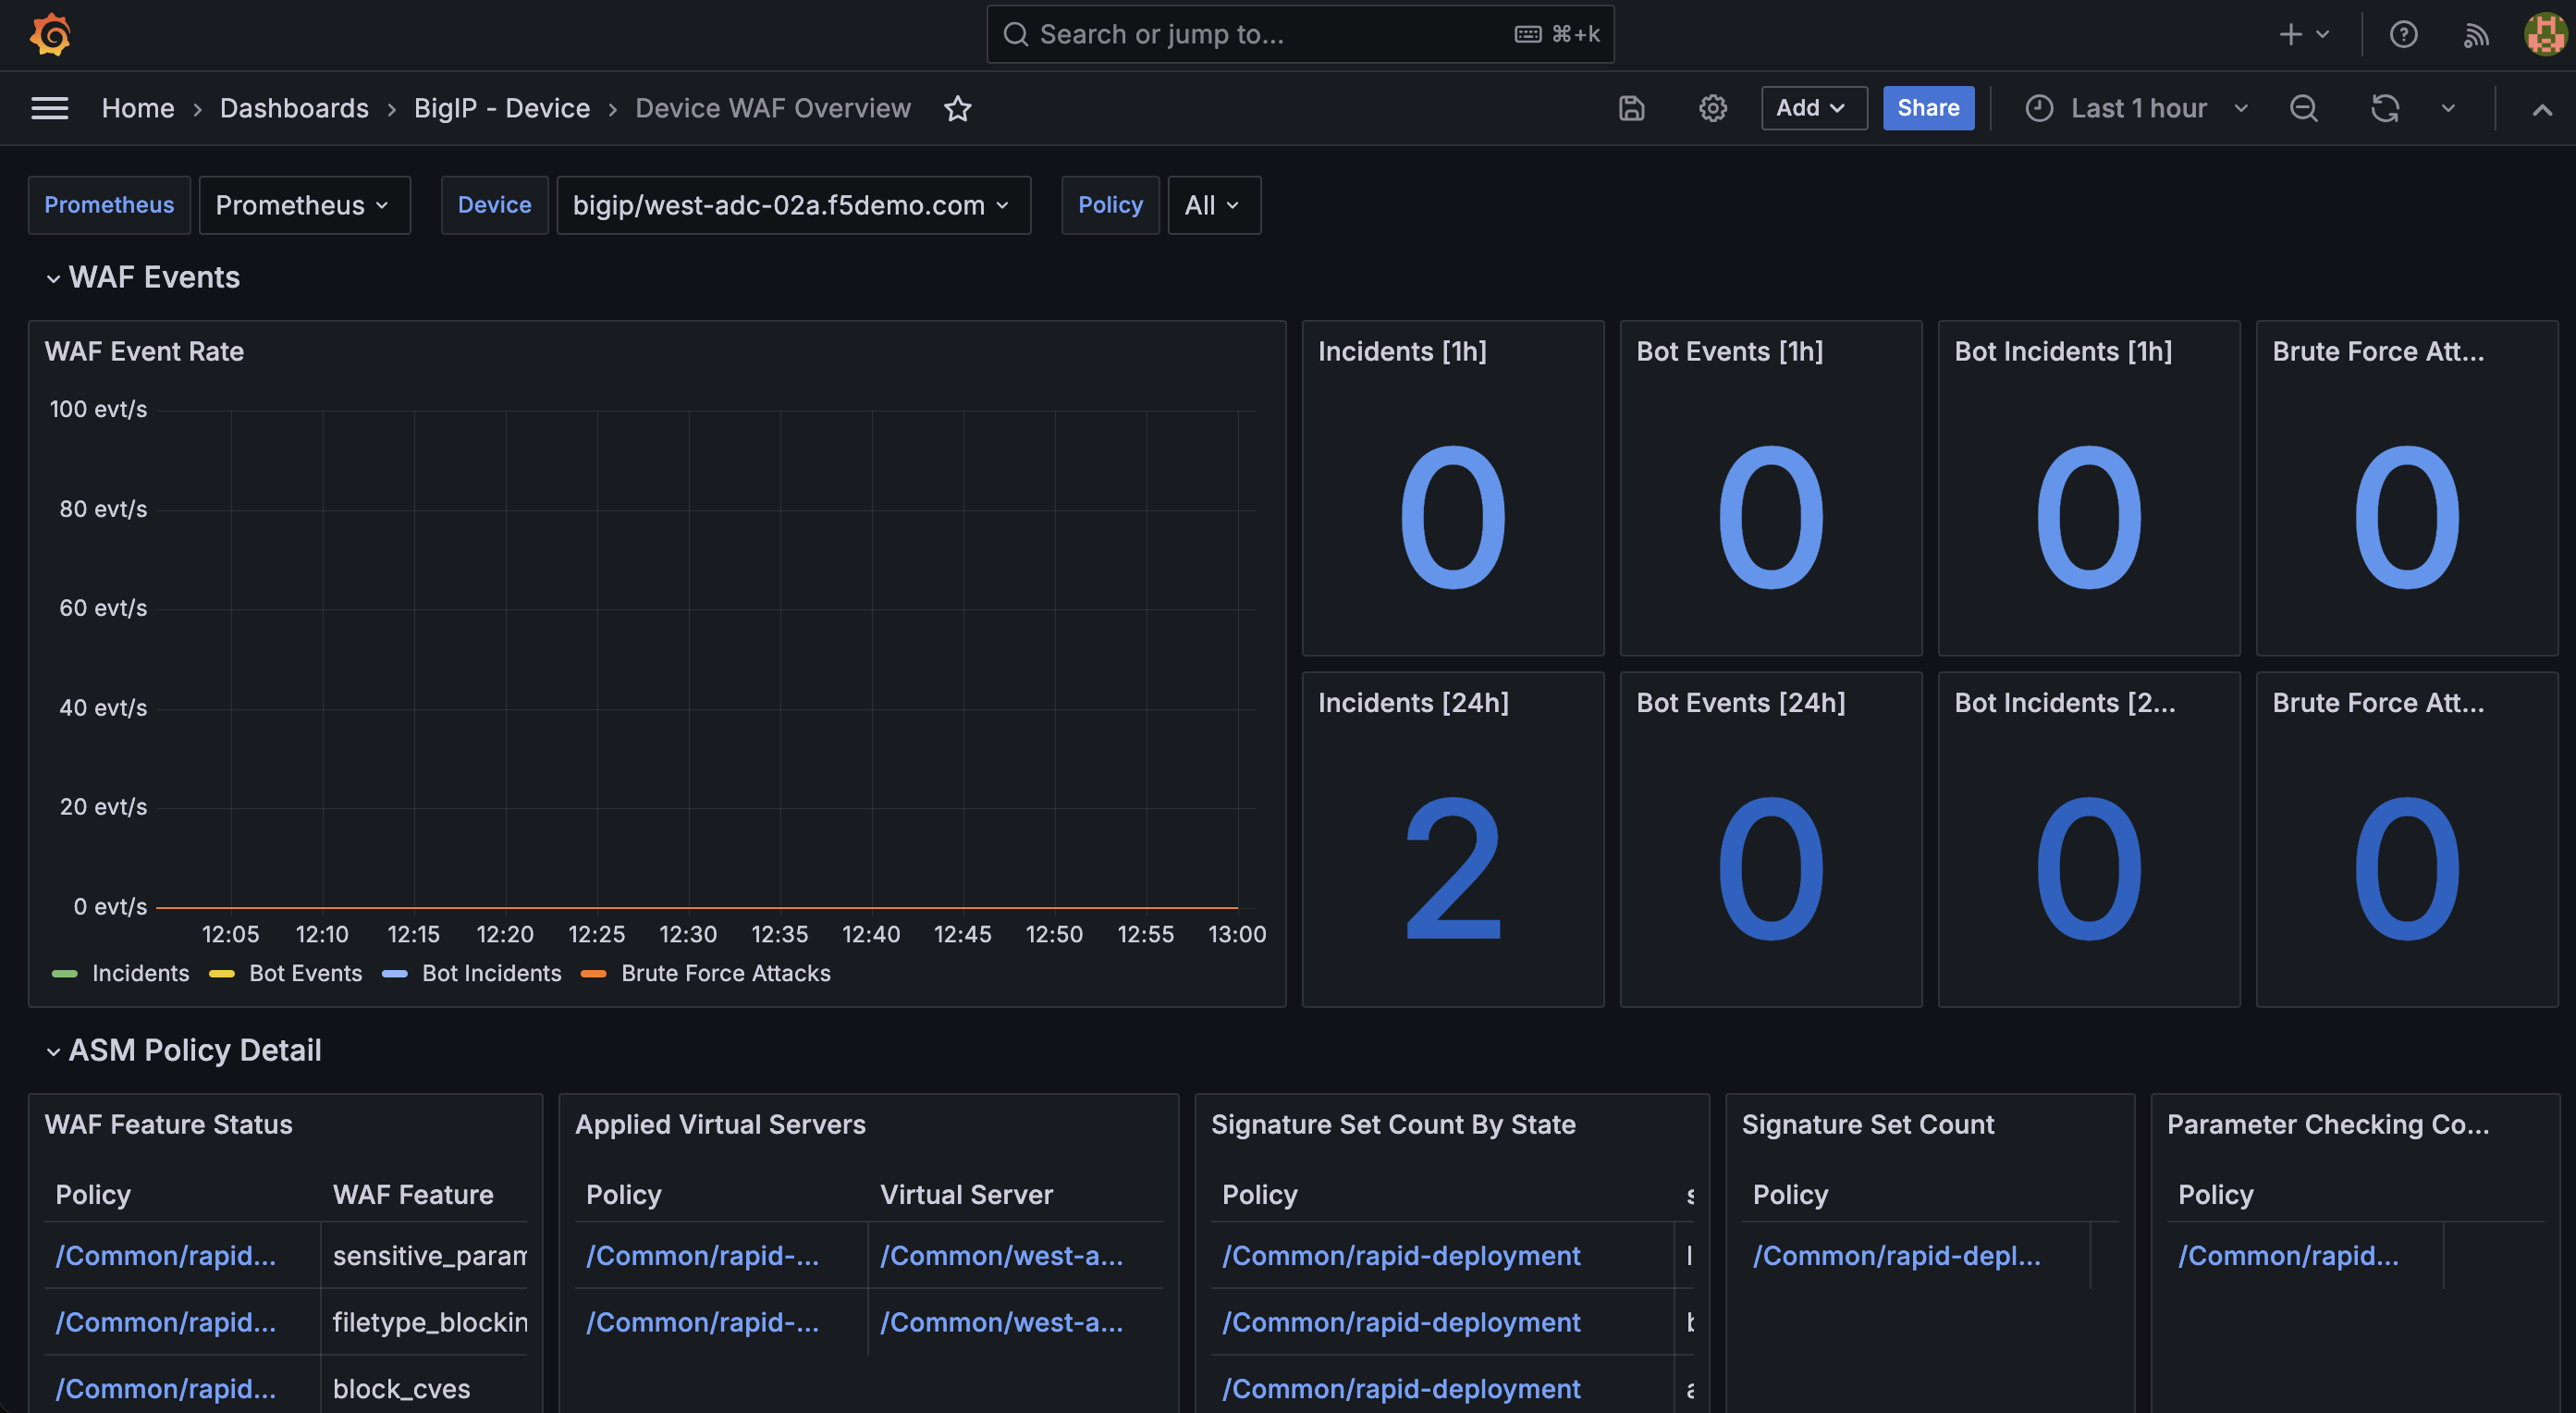
Device WAF Overview
Security-minded folks in the room will thoroughly enjoy F5 AST’s Device WAF Overview dashboard.
Available Metrics include:
WAF Events
WAF Event Rate
Incident Count (last hour)
Bot Event Count (last hour)
Bot Incident Count (last hour)
Brute Force Attack Count (last hour)
Incident Count (last 24 hours)
Bot Event Count (last 24 hours)
Bot Incident Count (last 24 hours)
Brute Force Attack Count (last 24 hours)
ASM Policy Detail
WAF Feature Status
Applied Virtual Servers
Signature Set Count by State
Signature Set Count
Parameter Checking Count
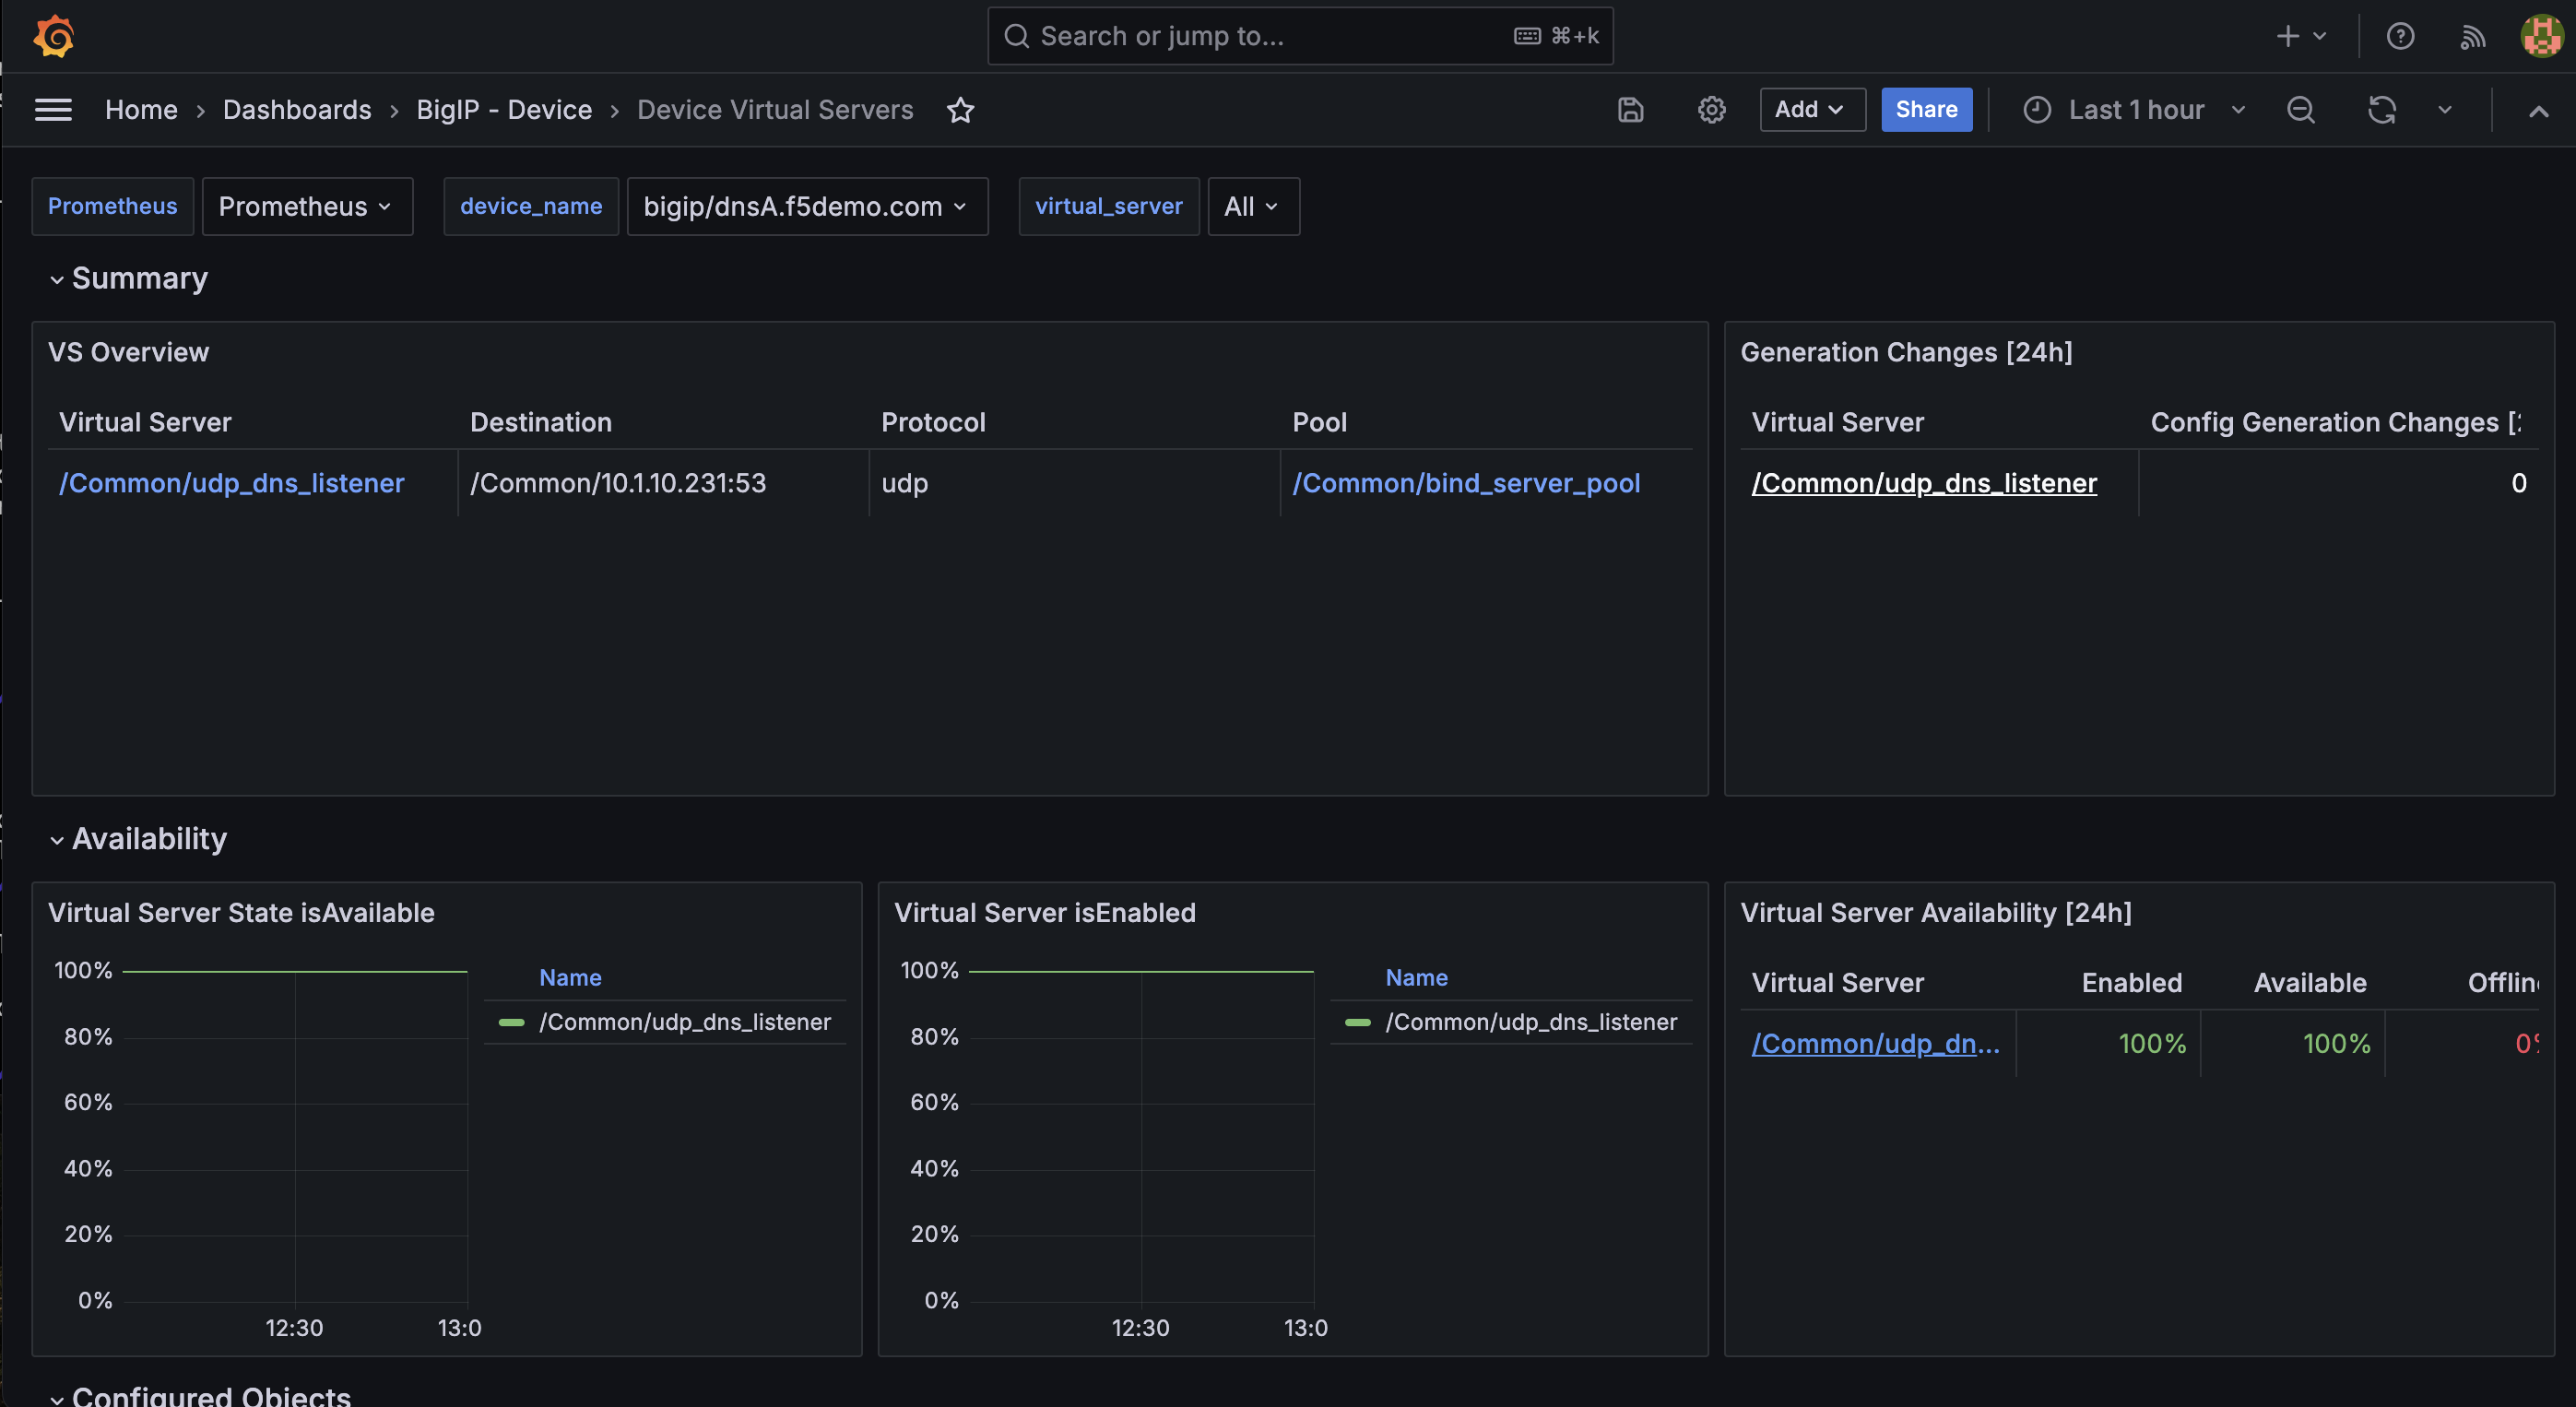
Device Virtual Servers
Another incredibly self-evident dashboard, Device Virtual Servers is a looking glass to the front-end ingress point for your F5 BIG-IP. Here, metrics such as Configuration Changes (last 24 hours) and Applied iRules can be found.
Available Metrics include:
Summary
Virtual Server Overview
Configuration Changes (last 24 hours)
Availability
Is Virtual Server State Available?
Is Virtual Server Enabled?
Virtual Server Availability (last 24 hours)
Configured Objects
Virtual Server Pool State
Applied iRules
Applied Profiles
CPU Utilization
Virtual Server CPU Utilization
Virtual Server ASM CPU Utilization
Traffic
Virtual Server Request Rate
Virtual Server Traffic
Virtual Server Packets Rate
Connections
Virtual Server Concurrent Connections
Virtual Server Connection Rate
Virtual Server Average Connection Duration
HTTP
HTTP Requests & Responses per Second
HTTP Responses per Second
DNS
Profiles
DNS Latencies per millisecond
DNS Queries & Responses per Second
DNS Express Queries & Responses per Second
SSL
SSL Bytes per Second
SSL Handshakes and Renegotiations per Second
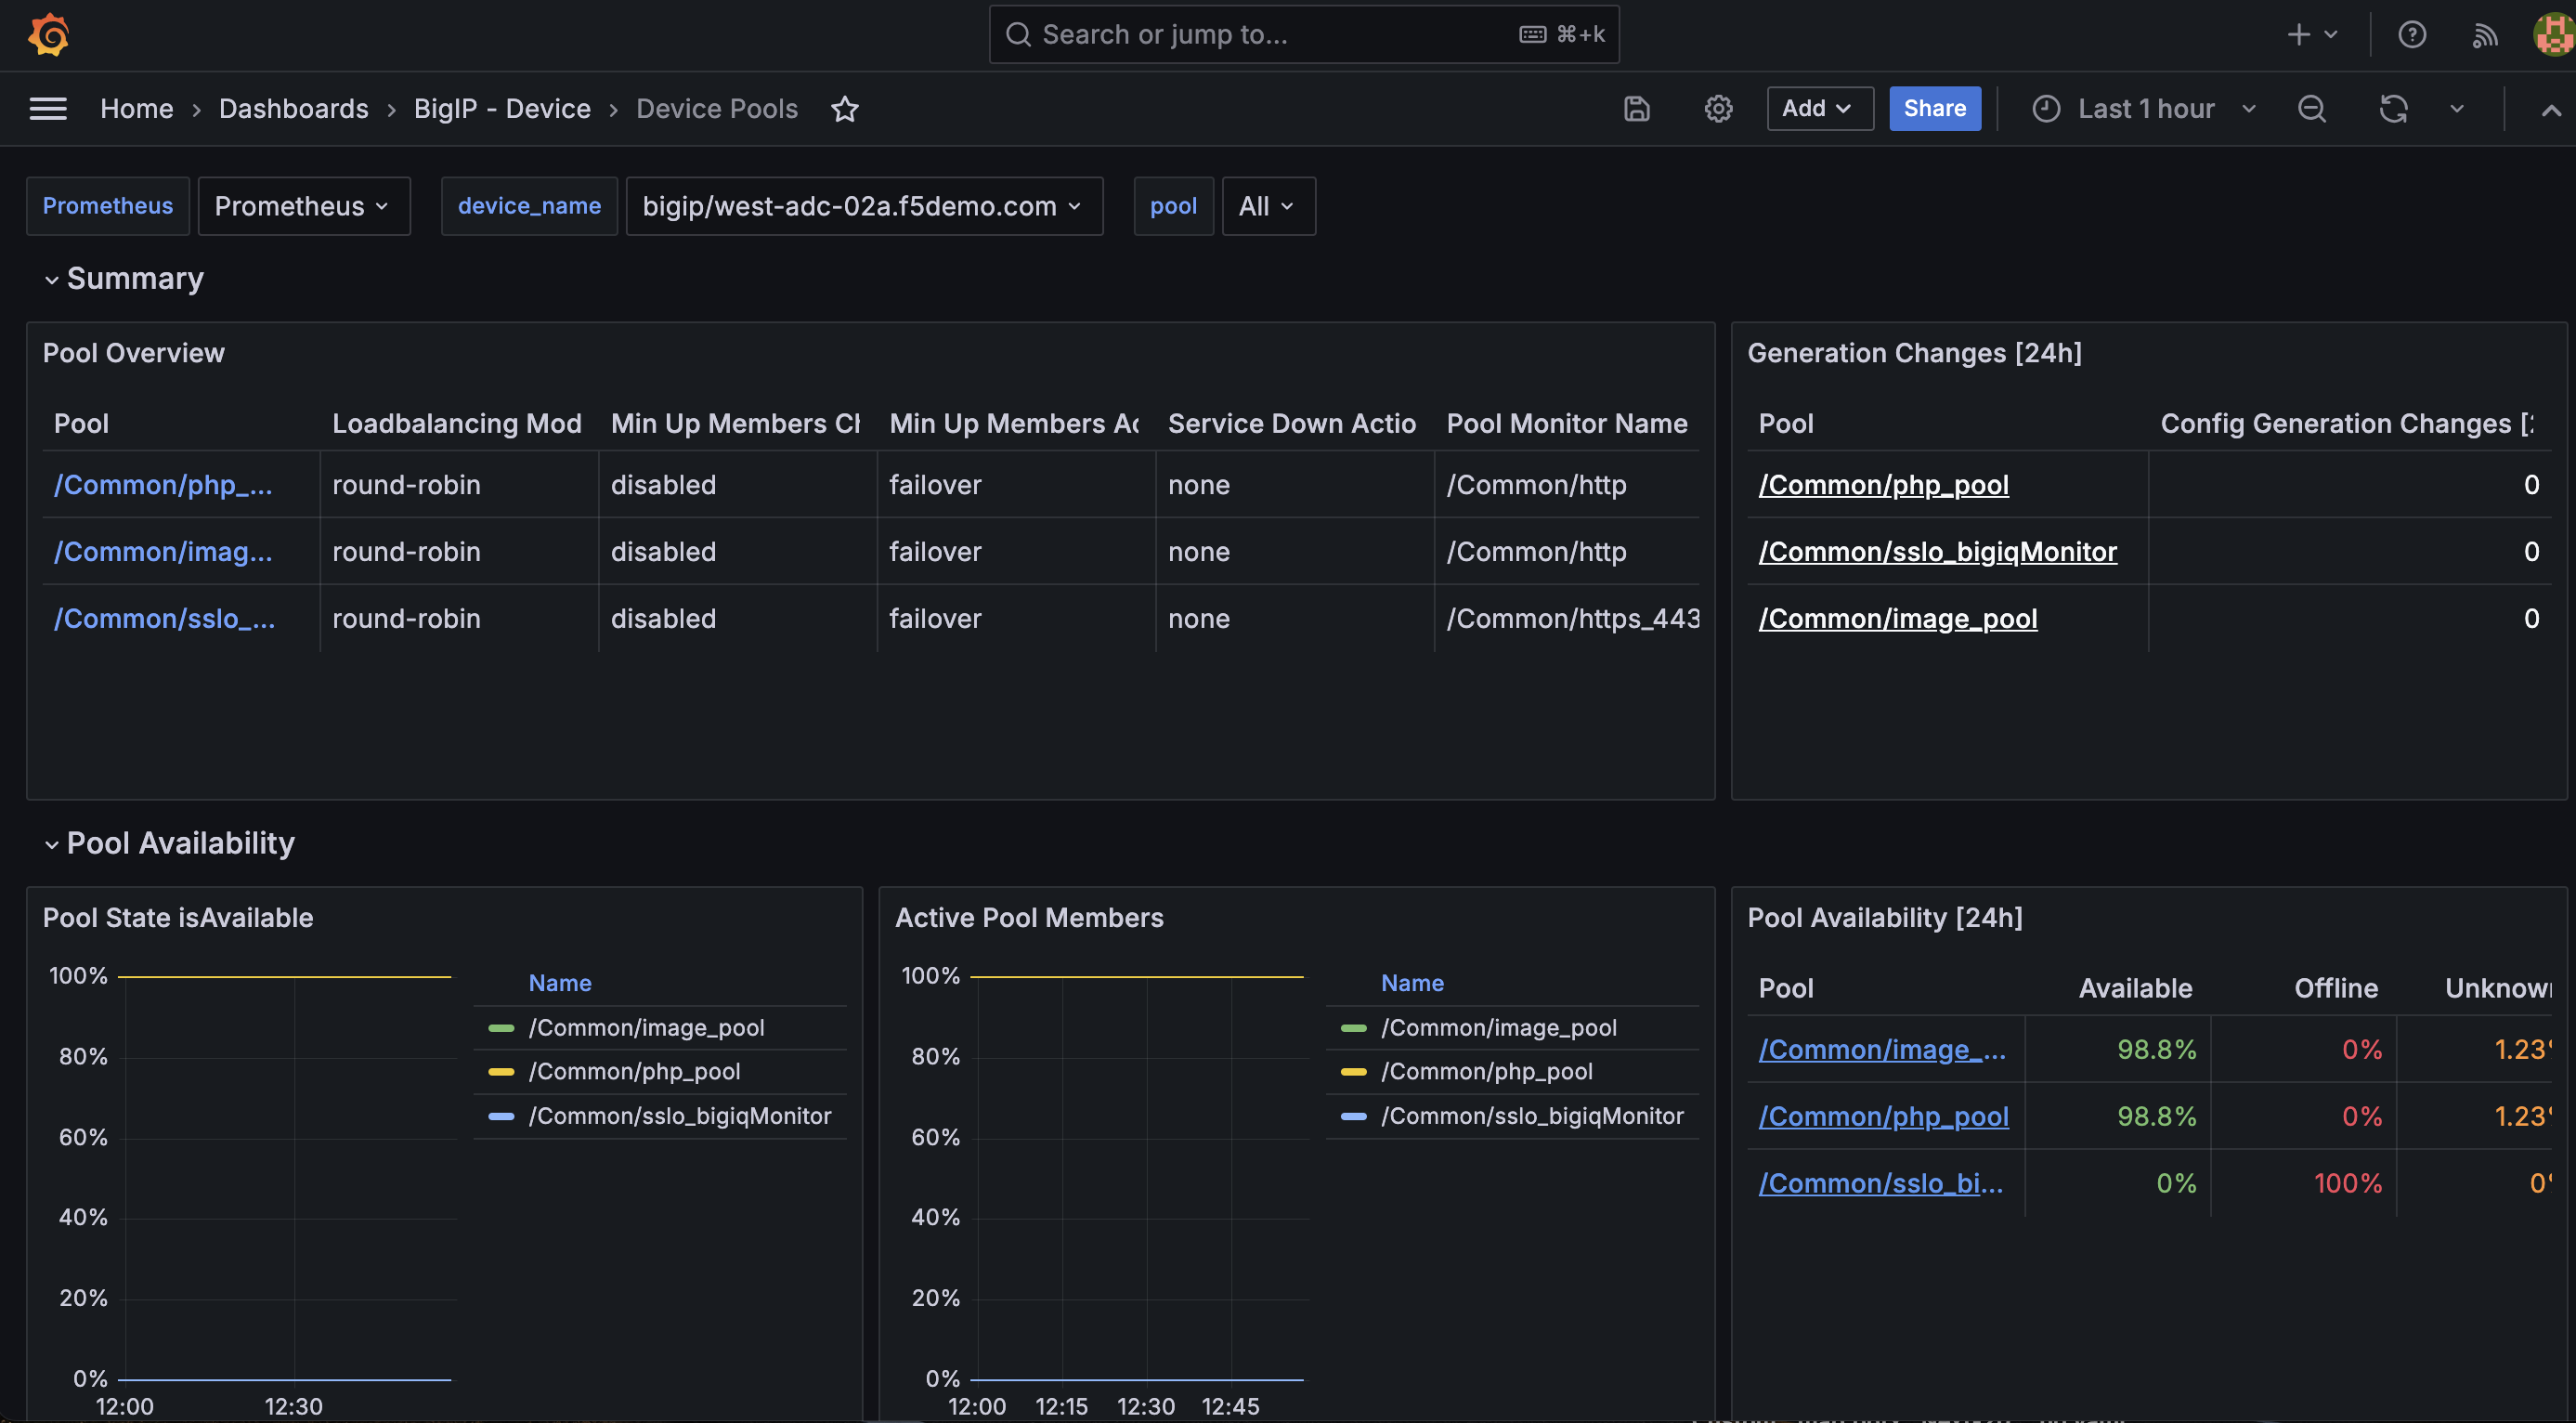
Device Pools
The Device Pools dashboard tunes users directly into the back-end resources your business needs to function.
Available Metrics include:
Summary
Pool Overview
Configuration Changes (last 24 hours)
Pool Availability
Is Pool State Available?
Active Pool Members
Pool Availability (last 24 hours)
Pool Utilization
Pool Data Rate
Active Pool Connection Count
Pool Request Rate
Pool Member Availability
Is Pool Member State Available?
Pool Member Availability (last 24 hours)
Pool Member Utilization
Pool Member Data Rate
Active Pool Member Connections
Pool Member Request Rate
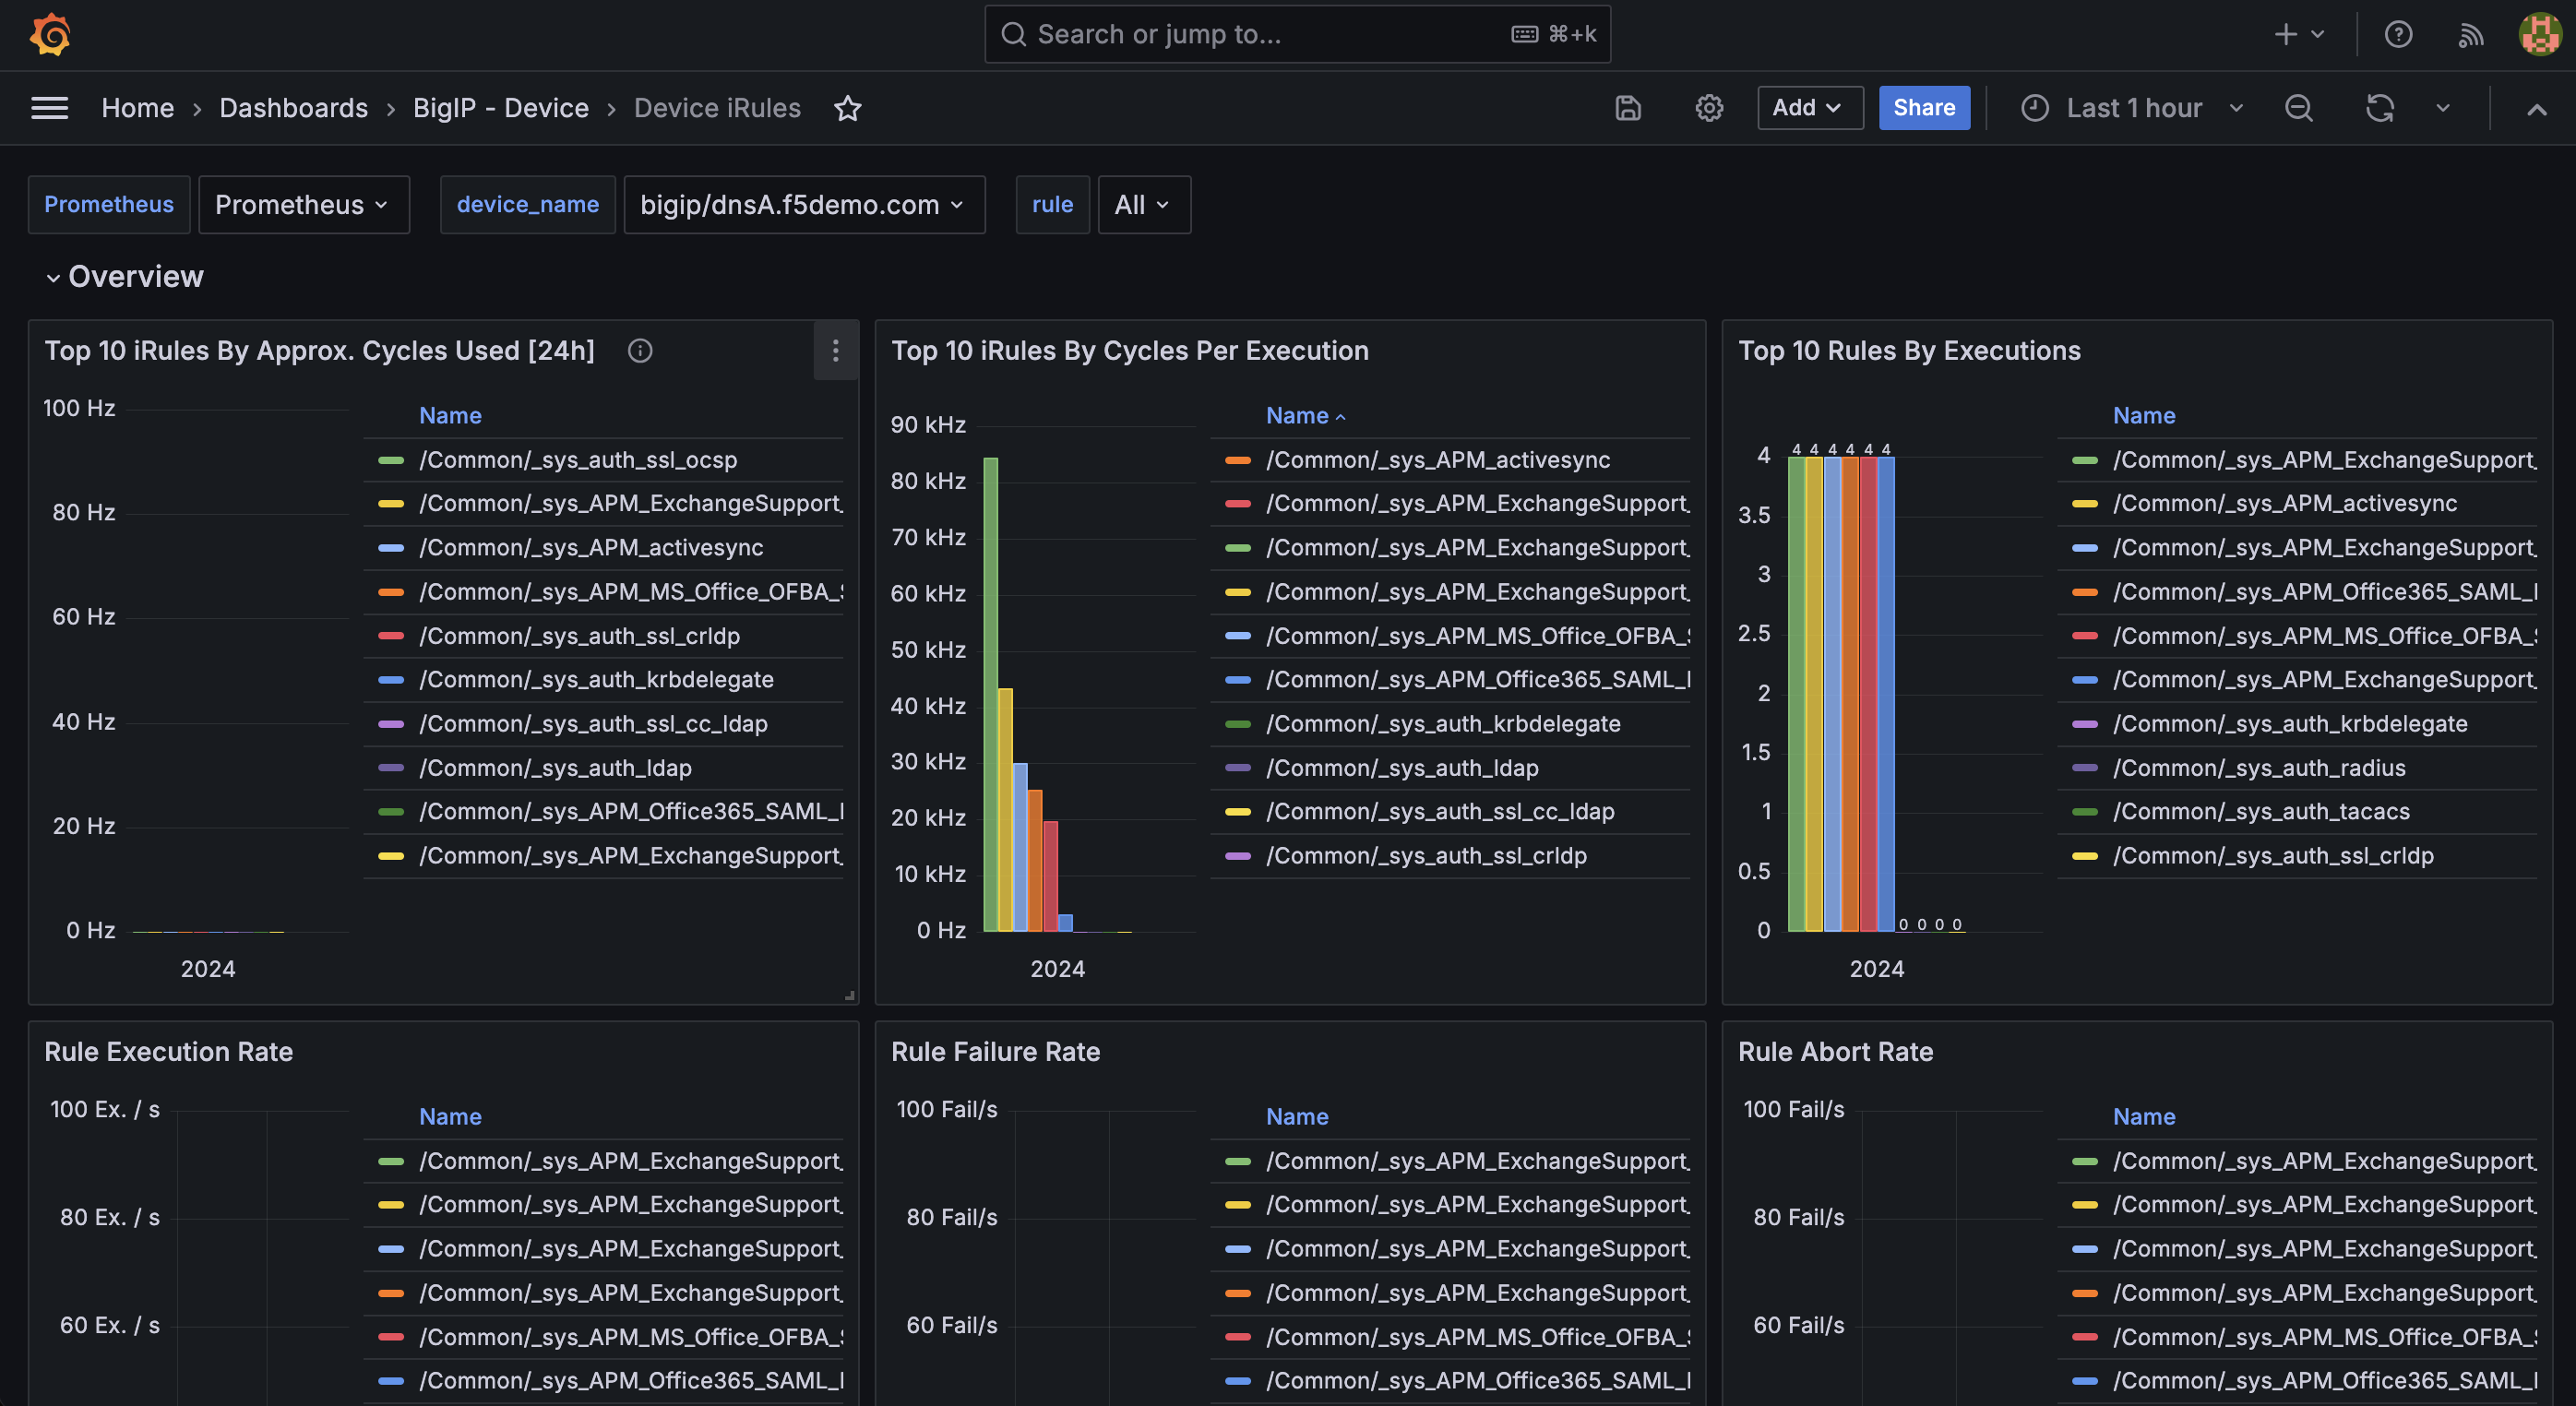
Device iRules
The Device iRules dashboard should come as no surprise to anyone familiar with F5 BIG-IP. iRules are an integral part of powering application delivery, and having operational state data such as iRule Execution Rate and iRule Failure Rate is critical and revealing. You can even dig deeper and learn about Failures by Event Type.
Available Metrics include:
Overview
Top 10 iRules by Approximate Cycles Used (last 24 hours)
Top 10 iRules by Cycles per Execution
Top 10 iRules by Executions
iRule Execution Rate
iRule Failure Rate
iRule Abort Rate
Rule Event Detail
Executions by Event Type
Failures by Event Type
Aborts by Event Type
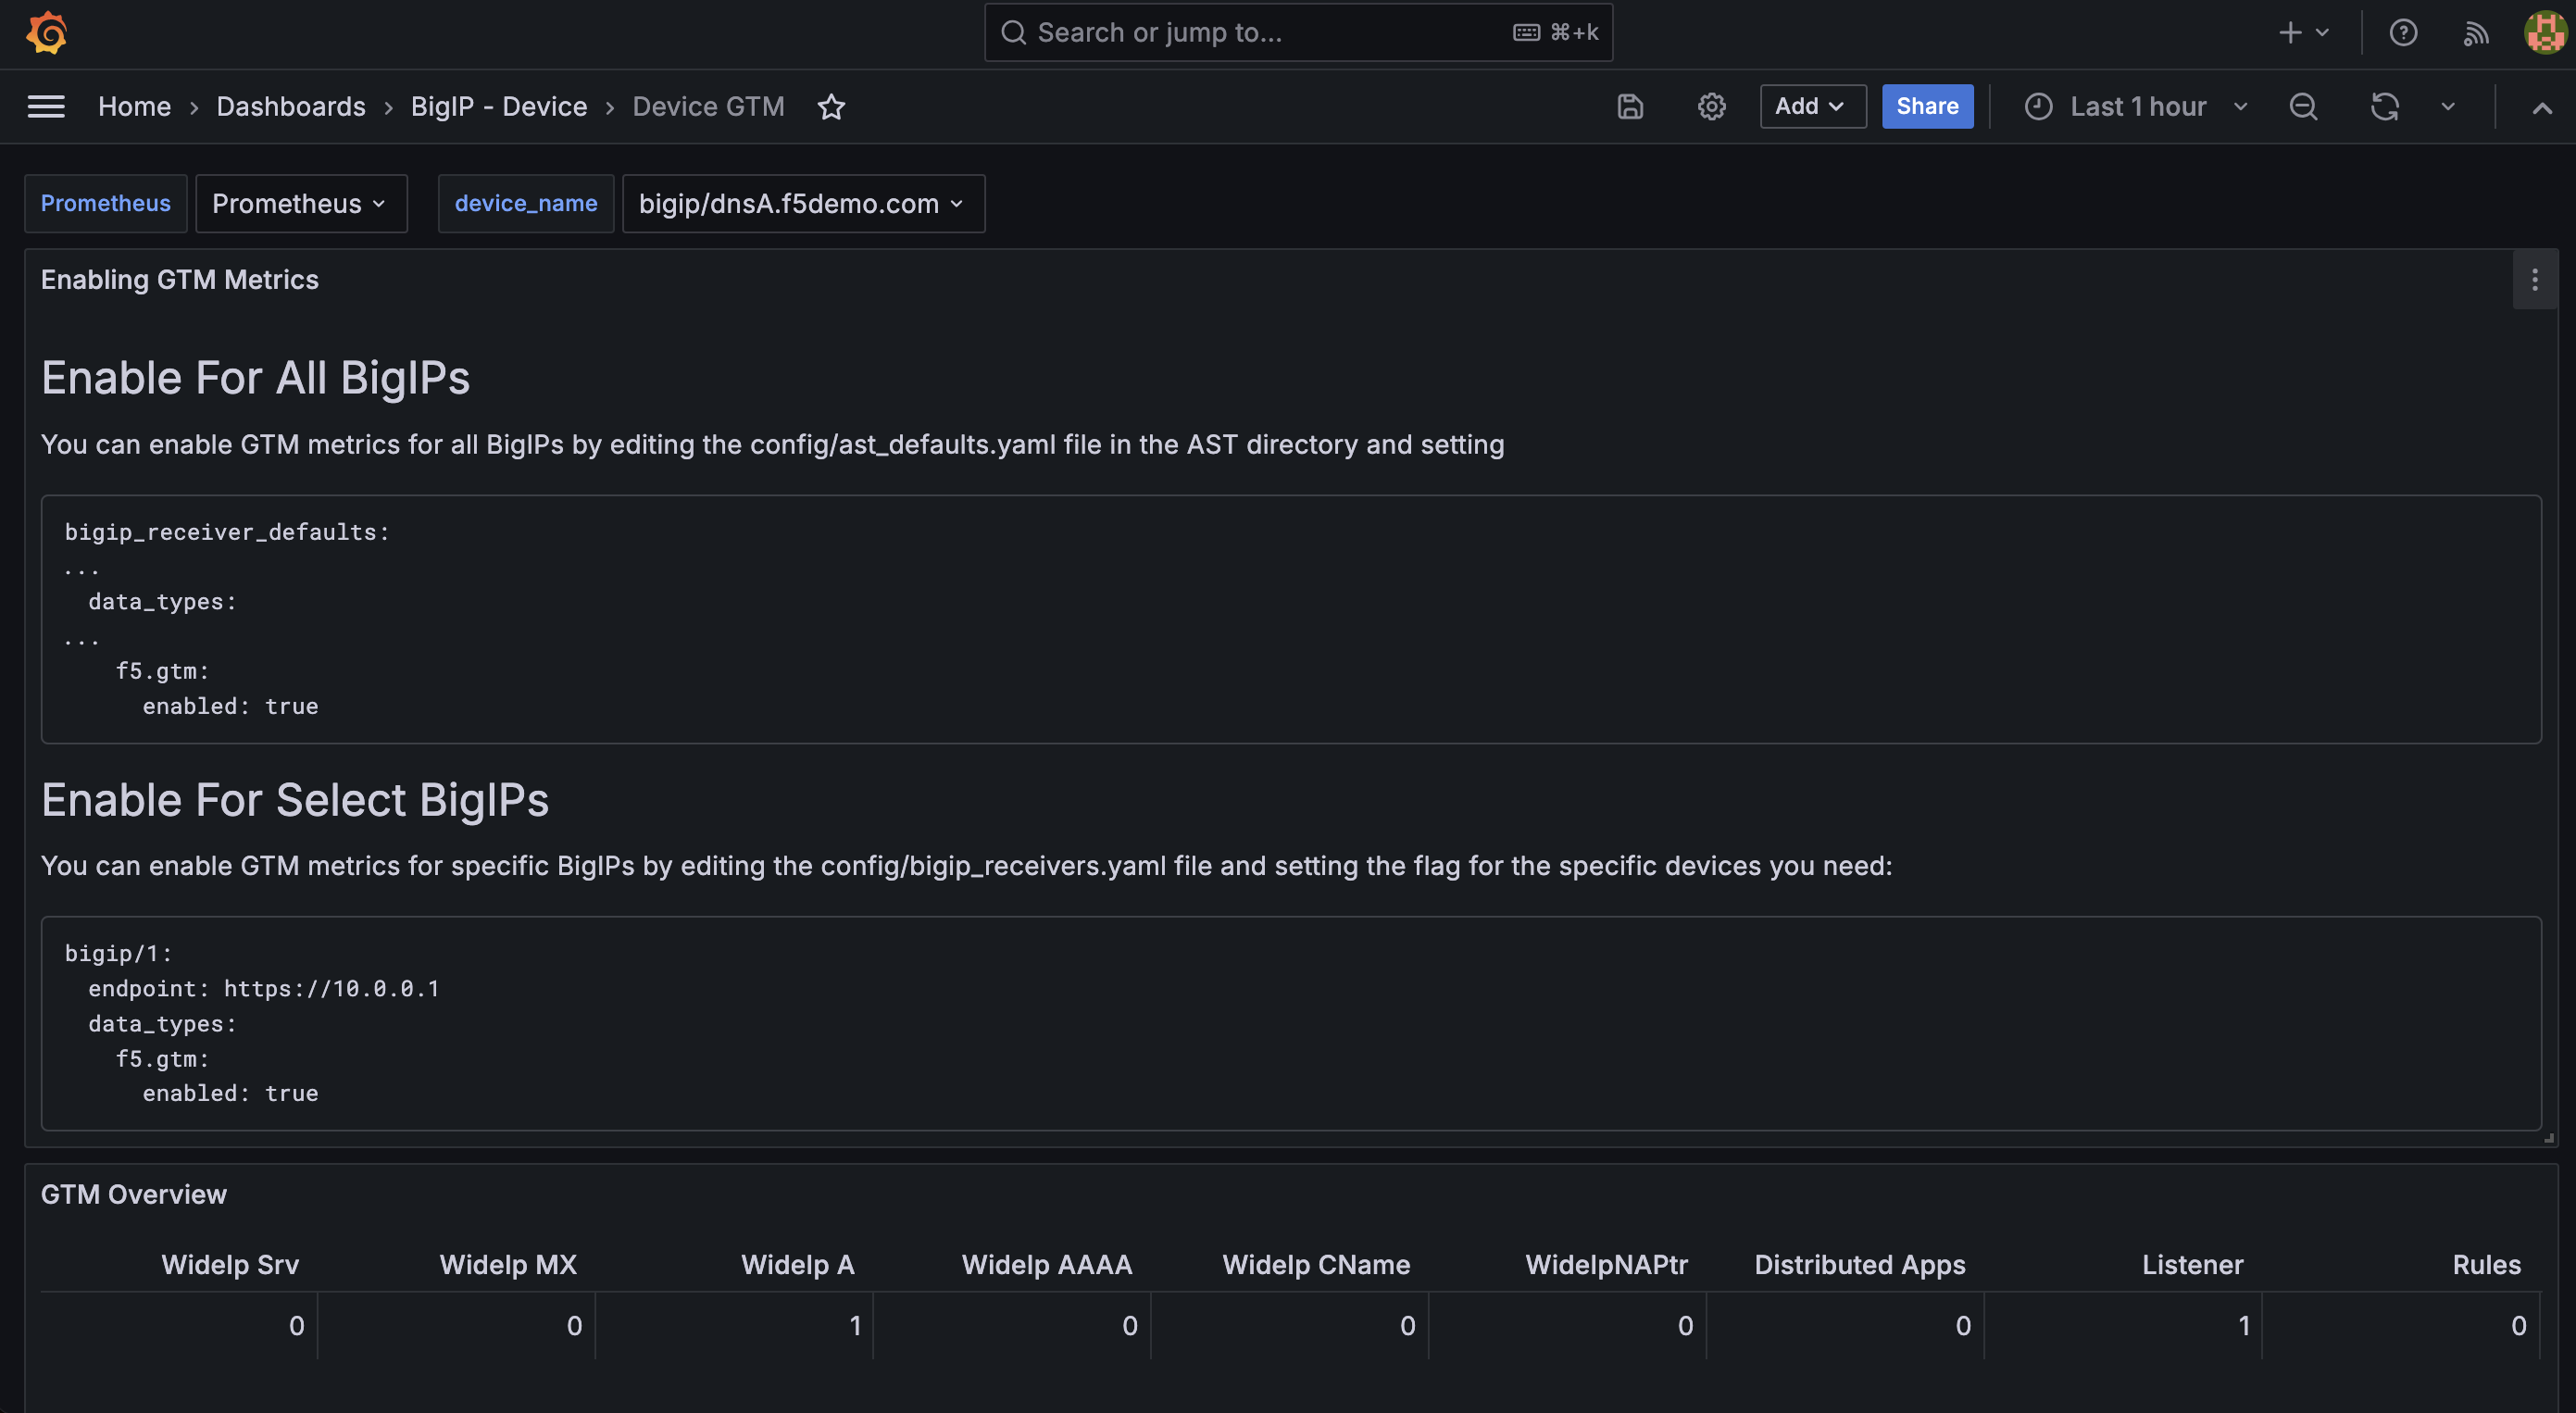
Device GTM
The Device GTM dashboard provides a view of the DNS and global resiliency metrics across your F5 BIG-IP estate.
Note
One of the first things you’ll notice about this dashboard is the presence of configuration instructions. Please take note of these and be sure your ast_defaults.yaml and bigip_receivers.yaml files are properly configured. Otherwise, stats will not be collected and displayed.
Available Metrics include:
GTM Overview
Requests Rate by Type
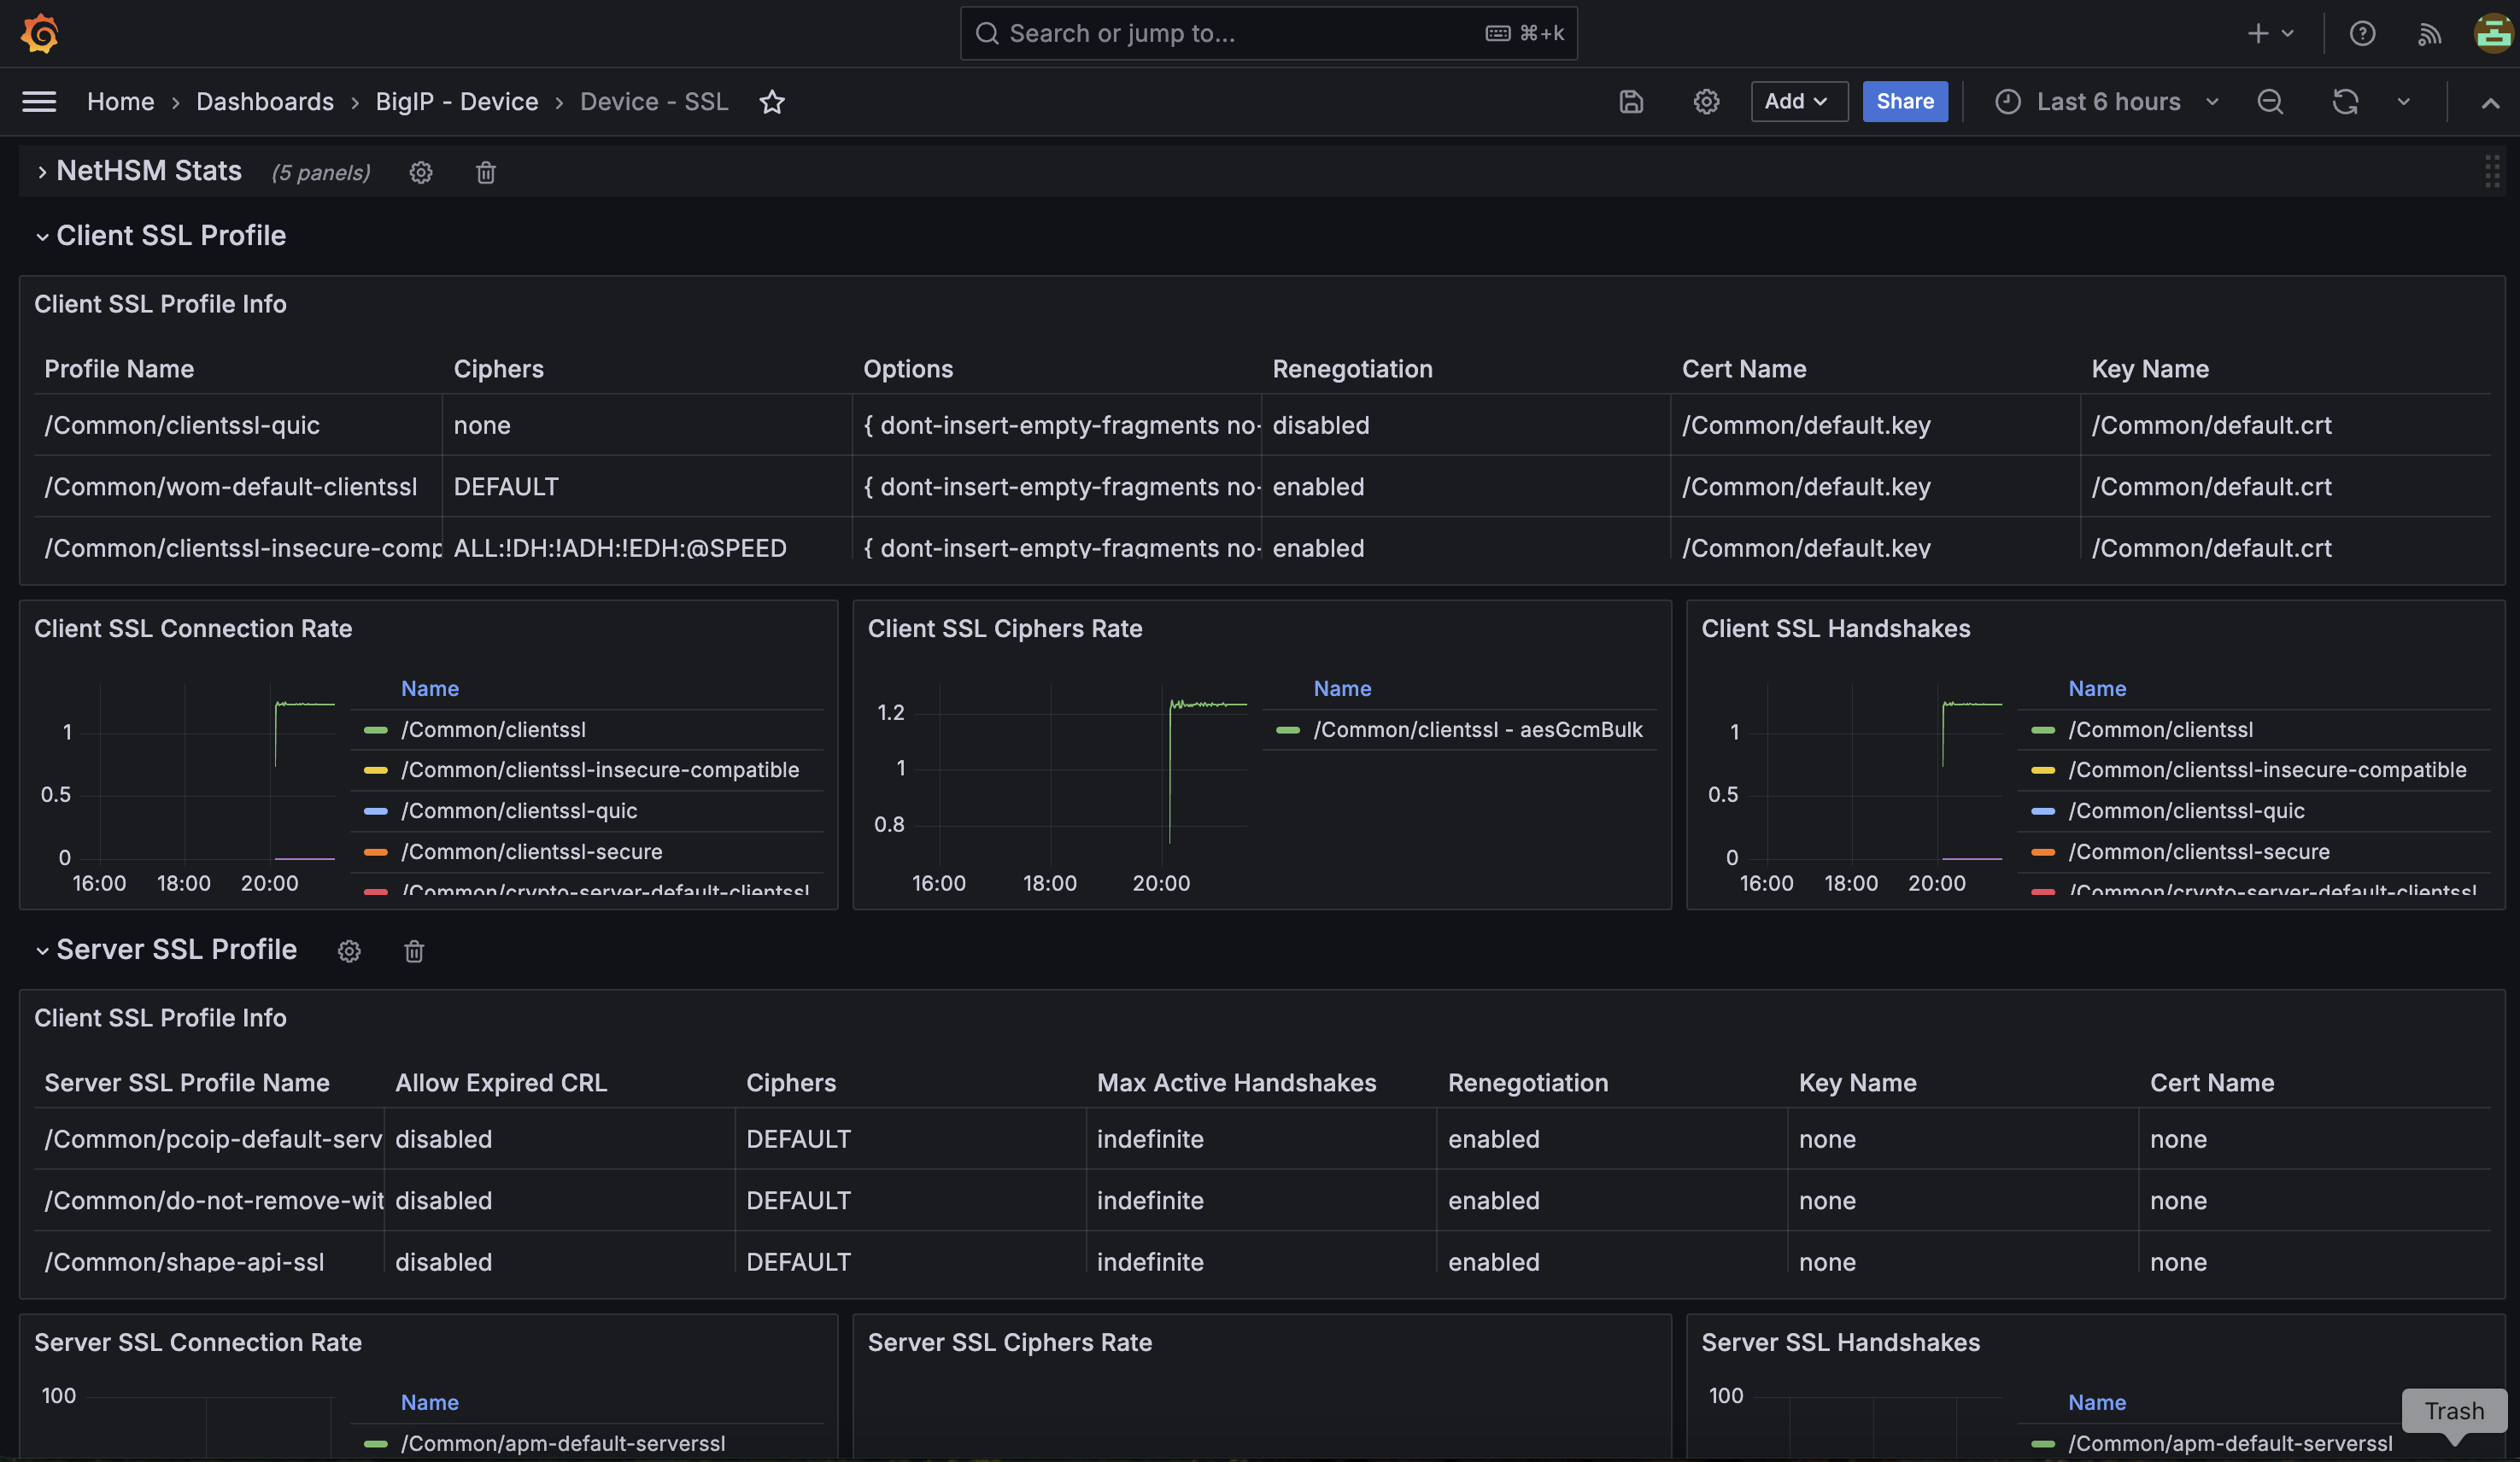
Device SSL
Last, but certainly not least, the Device SSL dashboard gives administrators a view of NetHSM statistics as well as client and server SSL profile data and stats. This is a very important area of focus, as BIG-IP is almost always used as a means by which to offload SSL operations and break/inspect application traffic.
Available Metrics include:
NetHSM Stats
Async Queue Done Rate
Async Queue Current Queued
Async Queue Average Queue Time
PKCS11d Operations Rate
PKCS11d Error Rate
Client SSL Profile
Client SSL Profile Info
Client SSL Connection Rate
Client SSL Ciphers Rate
Client SSL Handshakes
Server SSL Profile
Server SSL Profile Info
Server SSL Connection Rate
Server SSL Ciphers Rate
Server SSL Handshakes Rate
Please select Next below and continue on to BIG-IP - Device/Profiles Dashboards.