F5 Application Study Tool Labs > Class 1: Introduction to F5 Application Study Tool > Module 3: Exploring the F5 AST Dashboards Source | Edit on
BIG-IP - Device/Profiles Dashboards
In this lab, we’ll explore the Application Study Tool’s BIG-IP Device/Profiles dashboards:
LTM - HTTP Profile
LTM - DNS Profile
Note
There is an exhaustive list of metrics collected, some of which have been exposed through the pre-built dashboards you are about to explore.
These dashboards provide views into fundamental metrics we have observed have value in real-world scenarios, based upon field experience. We have designed this tool in a way that facilitates and enables users to customize it to meet their unique needs. Grafana provides just that, and we encourage you to add it into your toolbelt.
From the Grafana Dashboards landing page, select BIG-IP - Device/Profiles
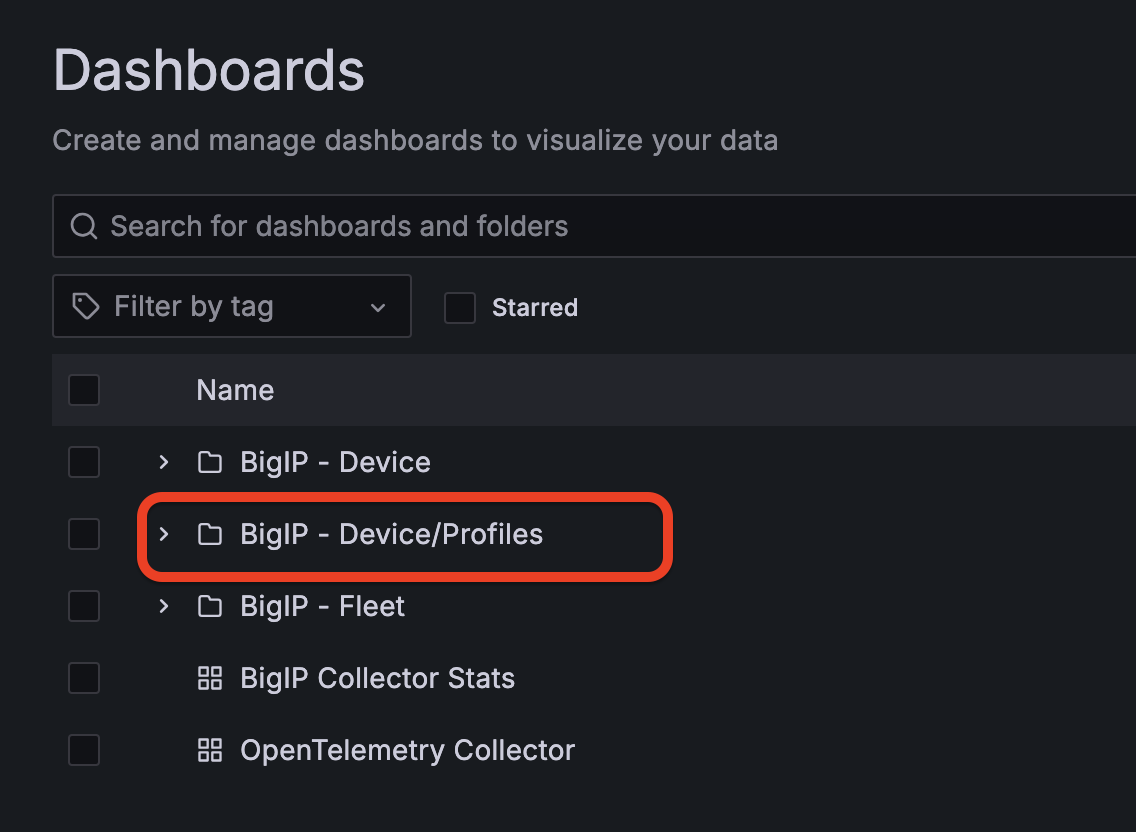
You’ll be presented with a list of available dashboards:
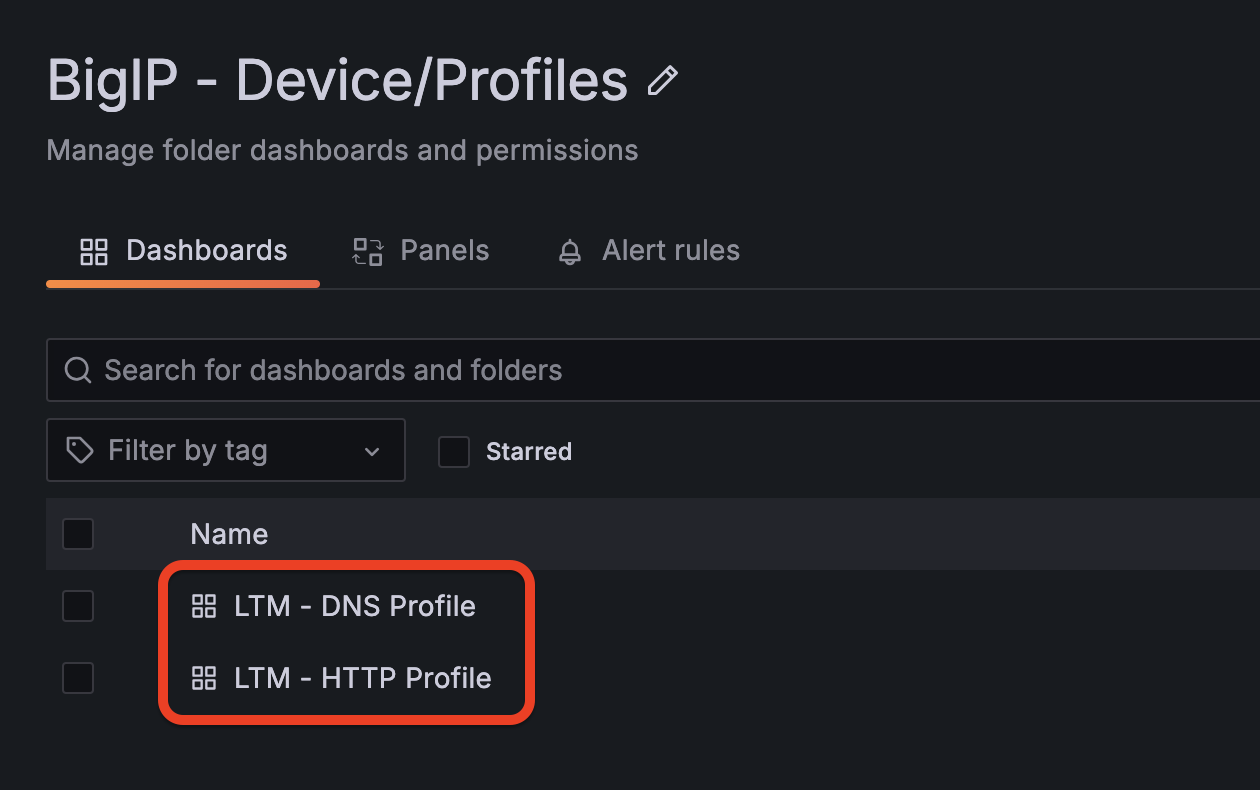
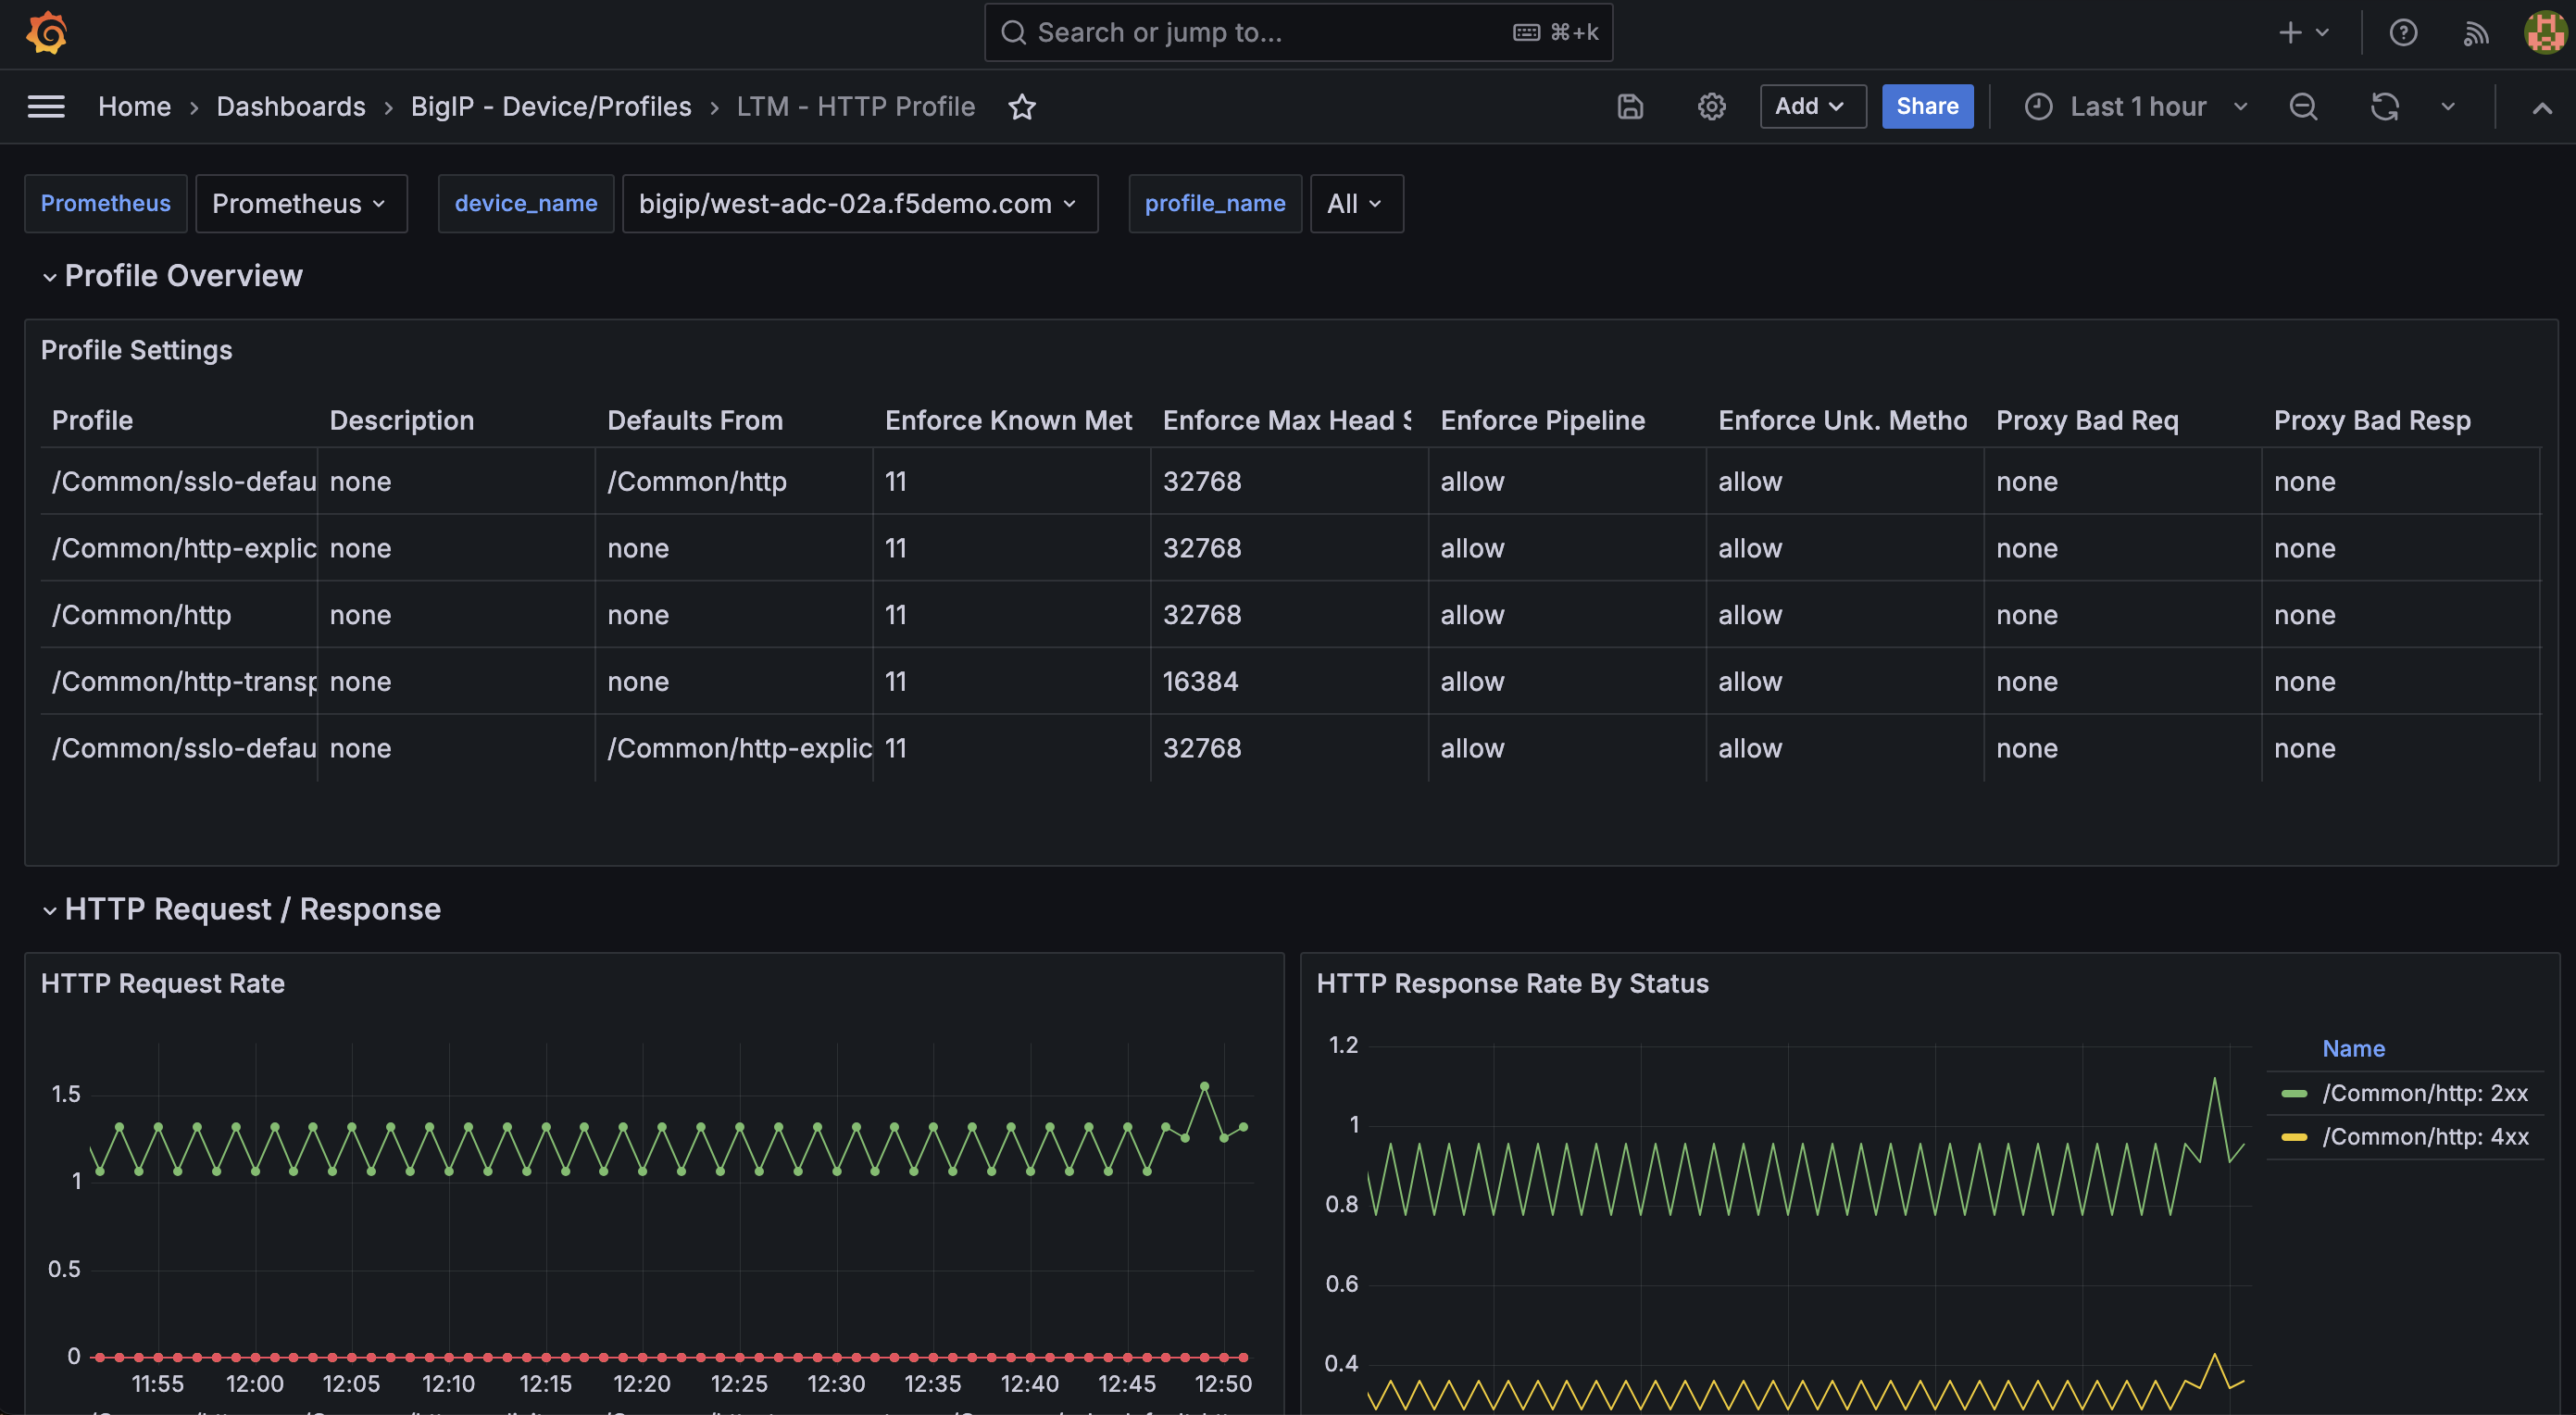
LTM - HTTP Profile
The LTM - HTTP Profile dashboard is where HTTP-specific data can be found on a per-profile basis.
Available Metrics include:
Profile Overview
Profile Settings
HTTP Request / Response
HTTP Request Rate
HTTP Response Rate by Status
HTTP Requests by Version (last hour)
HTTP Requests by Method
HTTP Responses by Version
Virtual Server HTTP Request / Response
Virtual Server HTTP Request Rate by Method
Virtual Server HTTP Response Rate by Status
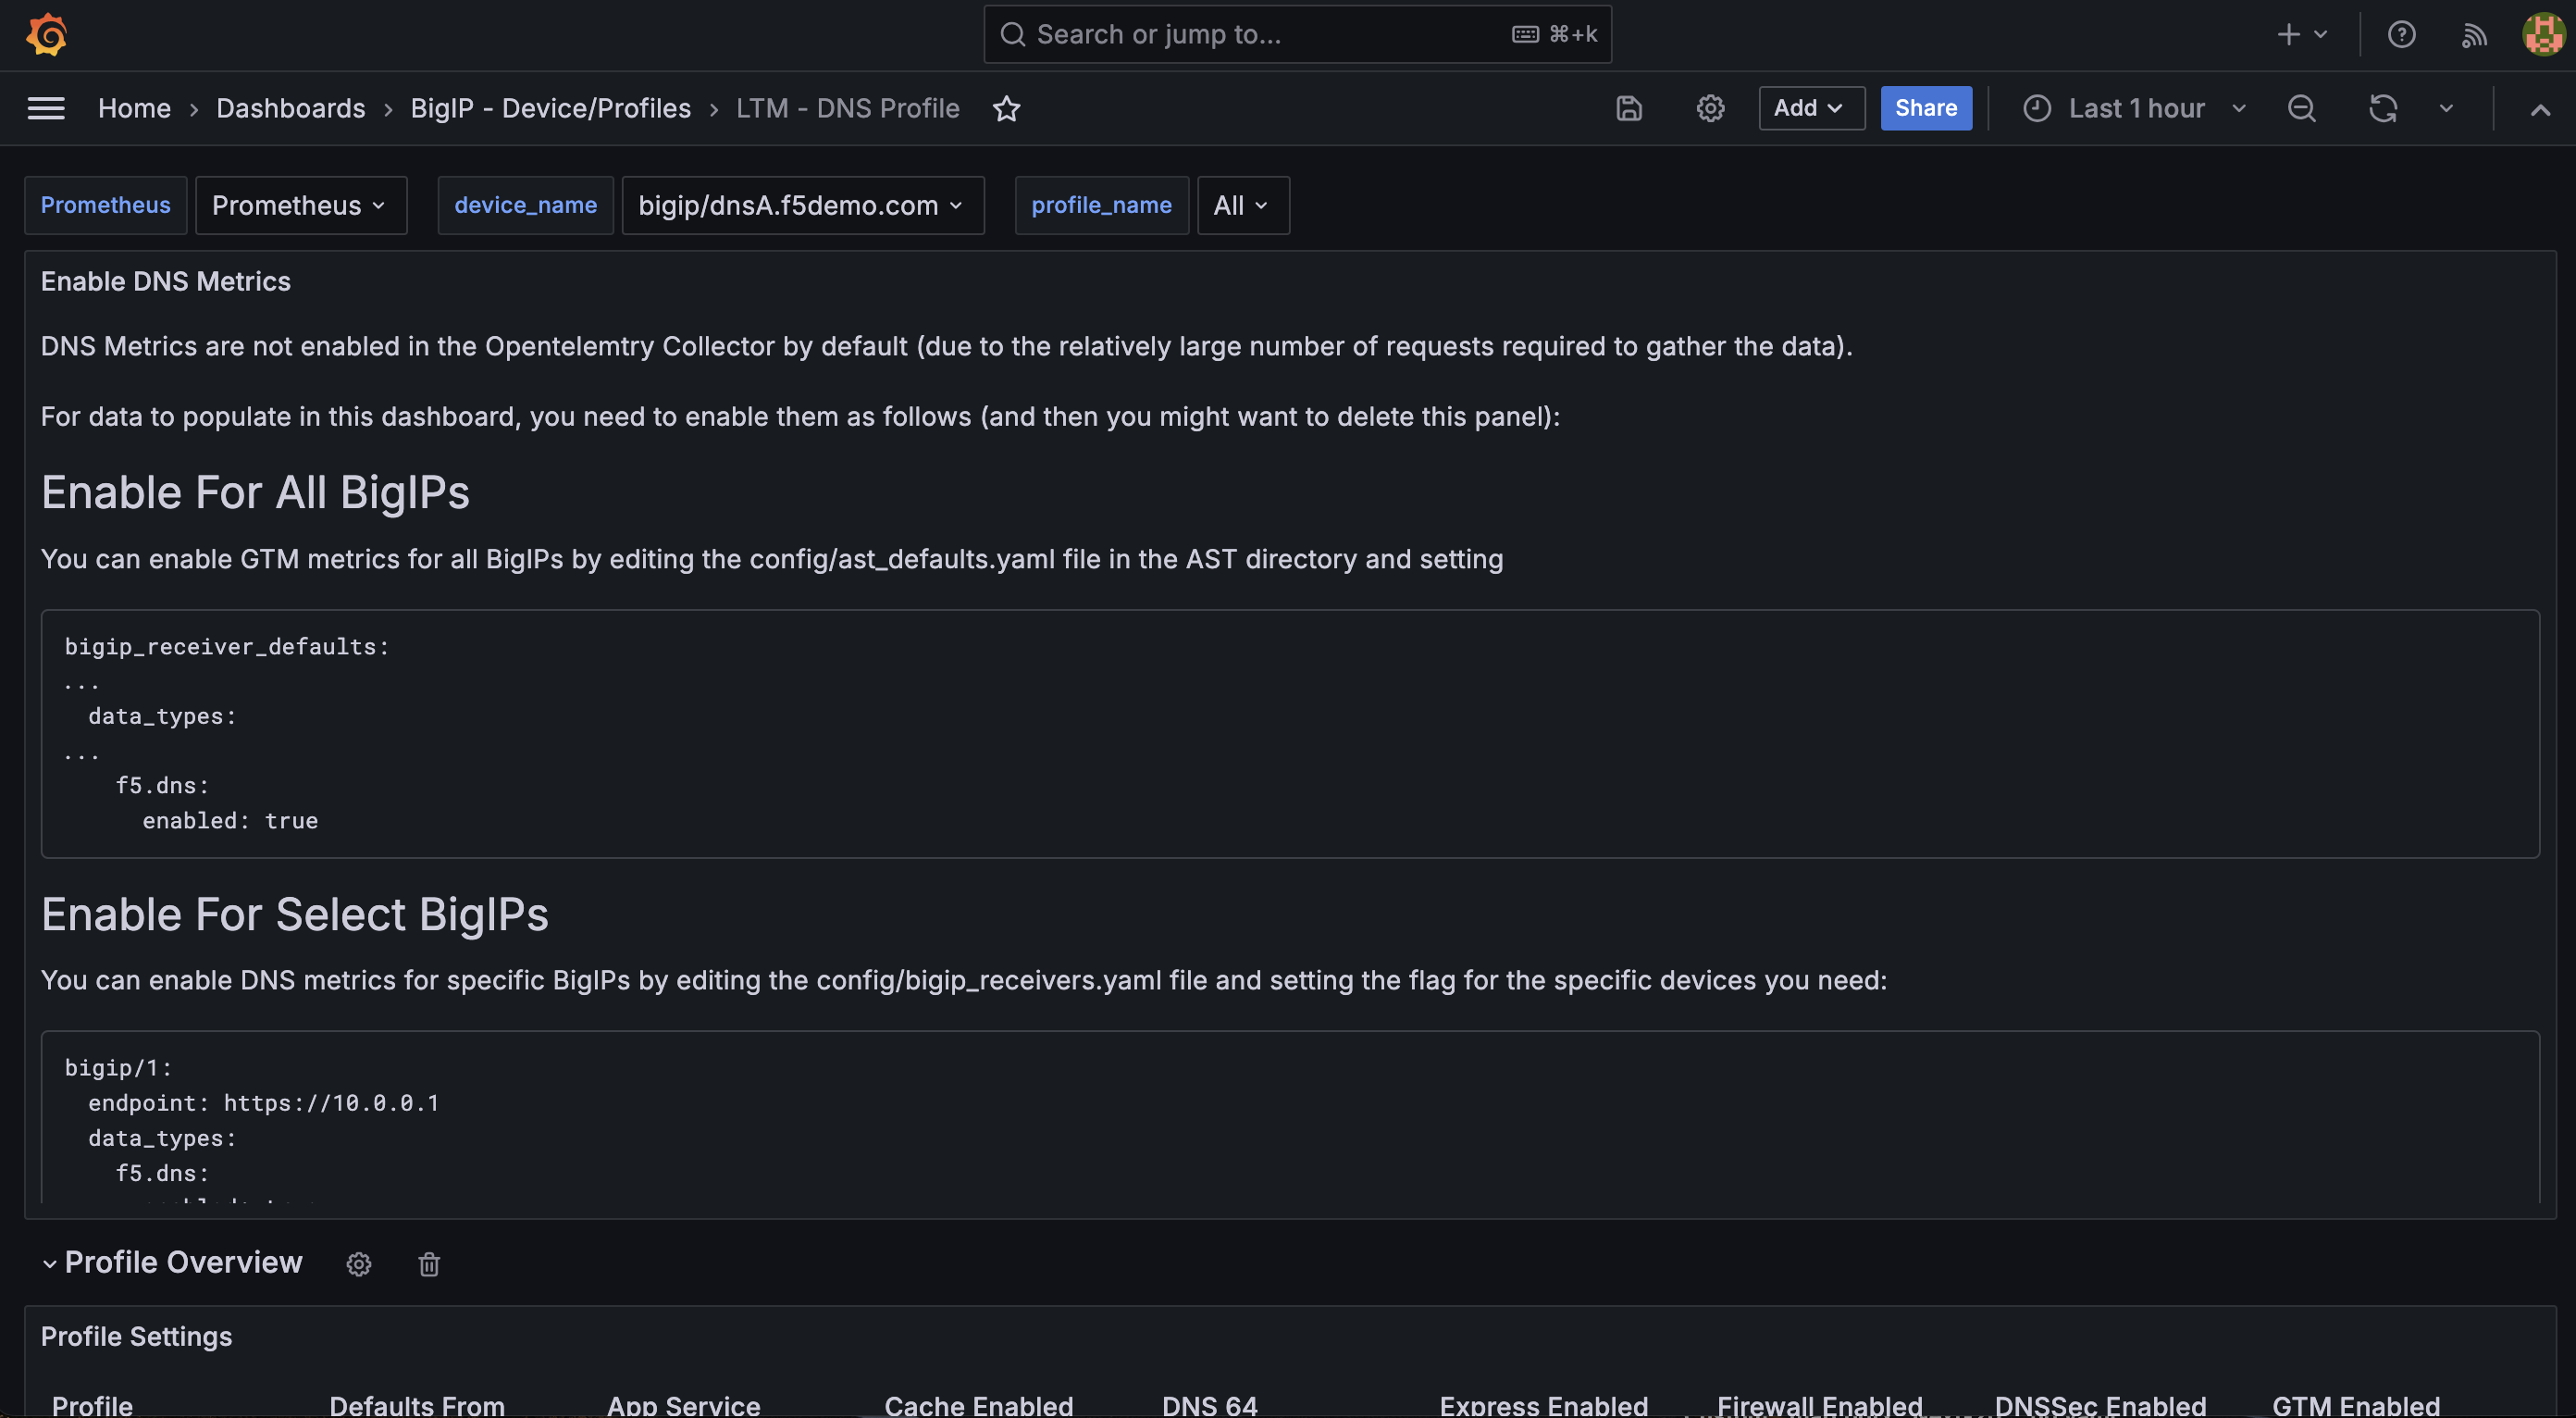
LTM - DNS Profile
As you may have guessed, the LTM - DNS Profile dashboard is where DNS-specific data can be found, per-profile.
Note
One of the first things you’ll notice about this dashboard is the presence of configuration instructions. Please take note of these and be sure your ast_defaults.yaml and bigip_receivers.yaml files are properly configured. Otherwise, stats will not be collected and displayed.
Available Metrics include:
Profile Overview
Profile Settings
DNS Profile Request Rate
DNS Profile Response Rate
DNS Request / Response Detail
DNS EDNS Request Rate
DNS EDNS Response Rate
DNS Request by Type
DNS Response by Type
DNS Response by Return Type
DNS Zone NS Detail
Queries by Type
XFR Notify Rates
DNSX Query Rates
DNS Resolver Cache Hit / Miss Rates
Client Cache Hits
Client Cache Misses
Client Hits Response Time
Client Misses Response Time
DNS Resolver Cache Traffic Rates
DNS Profile Bit Rate
TCP Bit Rate
Packet Rate
DNS Resolver Cache Message Rates
Message Hit Rate
Message Miss Rate
Message Eviction Rate
Message Modification Rate
DNS Resolver Serer Query Rate
Server Query Rate
Server Response Rate
Server Queries
Attention
This concludes Class 1: Introduction to F5 Application Study Tool! We truly hope you’ve enjoyed the content and trust you’ll check back soon to find additional exciting features and functionality!
Then again, if you’re reading this alongside a UDF Course, why leave so soon? There’s plenty of stuff to check out in Grafana and this is an opportunity to explore!
Also, don’t forget about Docker for Beginners. A Docker lab environment is at your fingertips; might as well check it out as well if time permits.
Note
One of the best ways to ensure you’re in the know as it relates to the F5 AST is by having a conversation with your F5 account team and voicing your interest, thoughts, and opinions.
Unsure who’s on your account team? No problem. Head over to Get F5 and submit an inquiry mentioning the F5 Application Study Tool.
But wait, THERE’S MORE! We’ve added a bonus section to the UDF lab environment and this guide: the F5 Local API Discovery Tool.
Select Next below for a preview of this extension to the F5 AST!