F5 Solutions for DDoS > Class2: Intermediate DDoS Protection > DDoS Hybrid Defender Setup Source | Edit on
Lab 3 – Configuring Network Attack Protection
Task 1 – Disable Device-Level DHD DoS Protection
Disable device-level DoS flood protection, and then issue an ICMPv4 flood and review the results.
Ssh (putty) into the BIG-IP DHD using the shortcut provided. Resize the BIG-IP putty ssh window by making it wider.
At the config prompt, type (or copy and paste) the following command:
tcpdump -i 0.0 host 10.1.20.12Open a second putty window and ssh to the Attacker (use shortcut on the desktop) and log in as ubuntu. It will authenticate using the ssh key provided automatically.
At the attacker config prompt, type (or copy and paste) the following command:
ping 10.1.20.12
The attacker can successfully communicate with a back-end resource behind the BIG-IP DHD
Examine the tcpdump window and verify ICMP packets are flowing through the BIG-IP DHD.
Cancel the ping command (Ctrl+C), then verify the tcpdump stops receiving ICMP packets, and then press Enter several times to clear the recent log entries.
In the Configuration Utility, in the Device Protection section click Device Configuration.
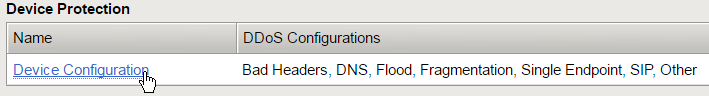
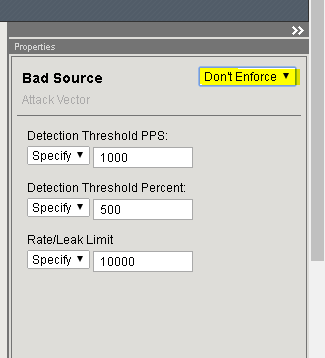
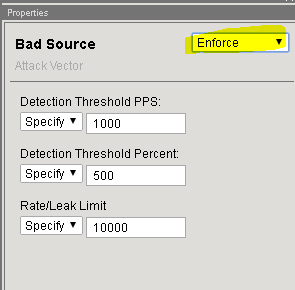
In the Bad Headers row click the + icon, and then click Bad Source.
On the right-side of the page select the drop-down to “Don’t Enforce”
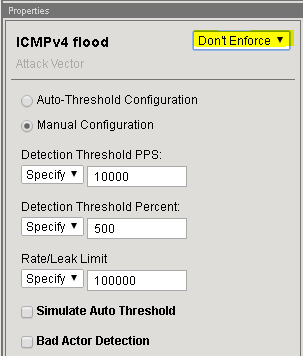
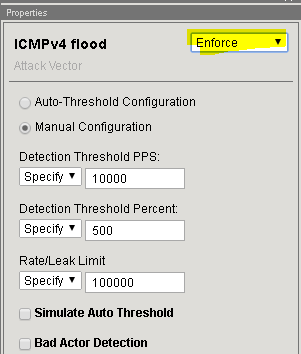
In the Flood row click the + icon, and then click ICMPv4 flood.
On the right-side of the page select the drop-down to “Don’t Enforce”
Click Update.
In the Attacker putty window type (or copy and paste) the following:
# sudo bash
# cd ~/scripts
# for i in {1..10}; do ./icmpflood.sh; done
This script launches 1,000,000 ICMP requests and then repeats for a total of ten occurrences.
View the tcpdump window and verify that ICMP attack traffic is reaching the back-end server.
Let the attack run for about 15 seconds before moving on.
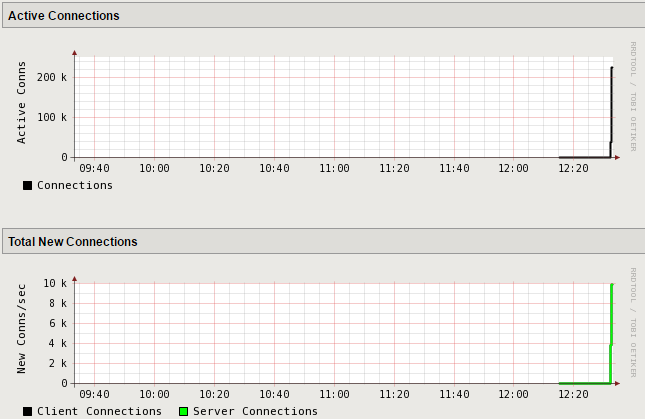
In the Configuration Utility, open the Statistics >> Performance >> Performance page.
View the Active Connections and Total New Connections charts.
There is a drastic spike in active connections.
View the Throughput (bits) and Throughput (packets) charts.
There is also a drastic spike in both bits per second and packets per second.
Open the Security >> Event Logs >> DoS >> Network >> Events page.
The log file is empty as we disabled device-level flood protection vector on BIG-IP DHD.
In the Attacker putty ssh shell slowly hit Ctrl + C several times until the prompt is back at the /scripts.
Task 2 – Re-enable Device-Level DHD DoS Protection
In the Configuration Utility, in the Device Protection section click Device Configuration.
In the Bad Headers row click the + icon, and then click Bad Source.
On the right-side of the page select the drop-down to “Enforce”
In the Flood row click the + icon, and then click ICMPv4 flood.
On the right-side of the page select the drop-down to “Enforce”
Click Update.
This returns the configuration back to factory supplied device level enforcement.
Task 3 – Configure Protected Object-Level Network DoS Protection
With the DHD device wide protection provides a line of defense and is enforced for all traffic flowing through the device. For more granular control, we use protected objects and configure mitigation settings for those objects to be enforced. In this task we will configure object-level DoS network multi-vector protection, and then issue an attack and review the results in the next task.
Go to Dos Protection>>Quick Configuration
On the Protect Objects page, in the Protected Objects section click Create.
Configure a protected object using the following information, and then click Create.
Name ServerNet IP Address 10.1.20.0/24 Port * Protocol All Protocols Protection Settings: Action Log and Mitigate Protection Settings: DDoS Settings IPv4,TCP,UDP,
Sweep
Maximum Bandwidth: Specify 200 Enable External Redirection Checked Scrubbing Threshold: Percentage 90% Scrubbing Silverline Silverline Checked 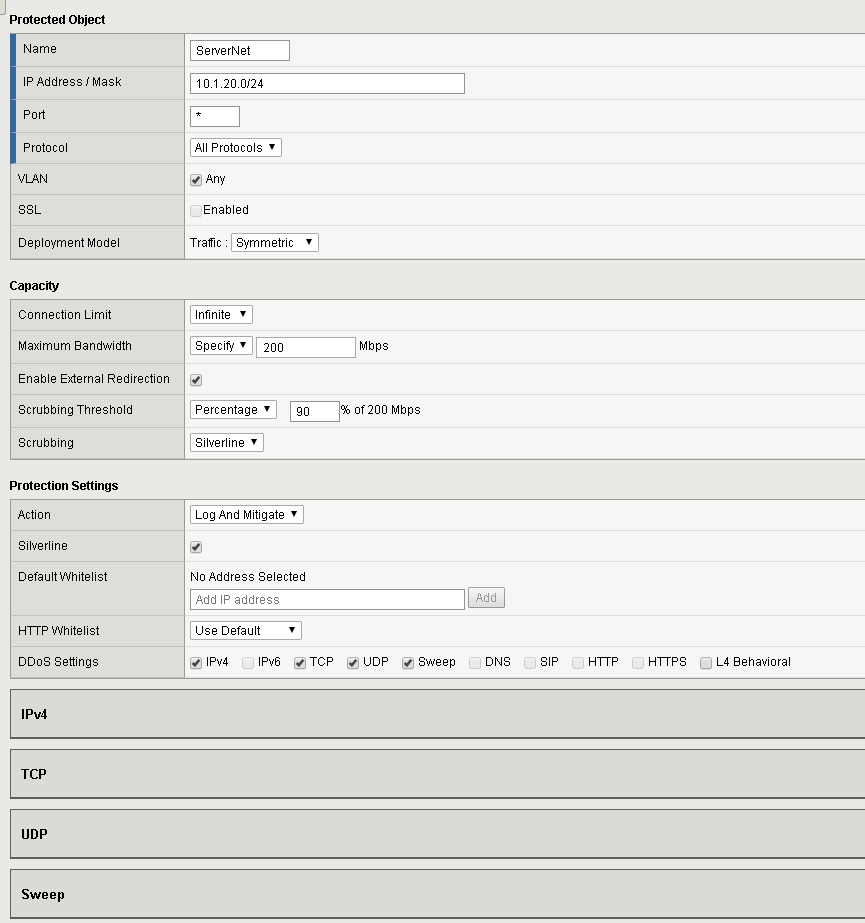
Verify the newly created protected object:

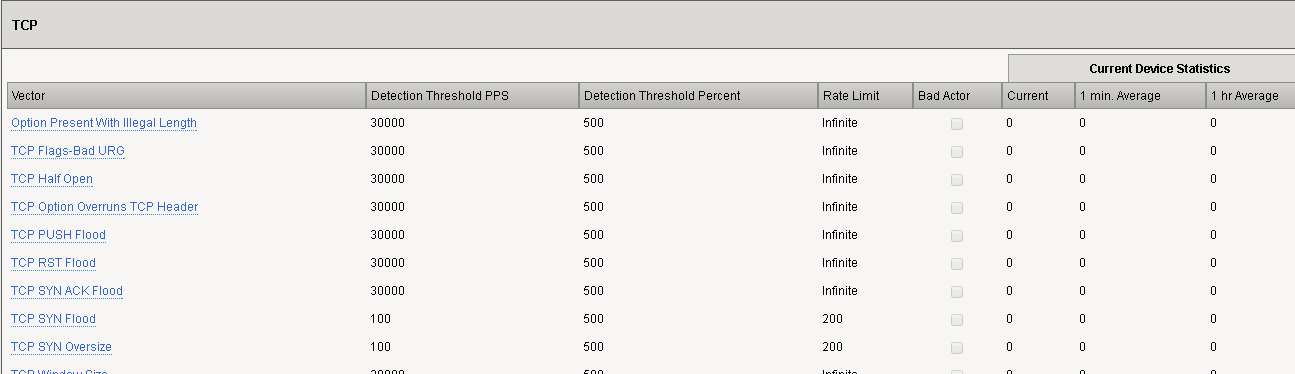
Click on the “ServerNet” object and configure the following vectors and click Update.
Vector Detection Thresh. PPS Detection Thresh % Rate Limit ICMP Fragment 100 500 200 ICMPv4 Flood 100 500 200 IP Fragment Flood 100 500 200 TCP SYN Flood 100 500 200 TCP SYN Oversize 100 500 200 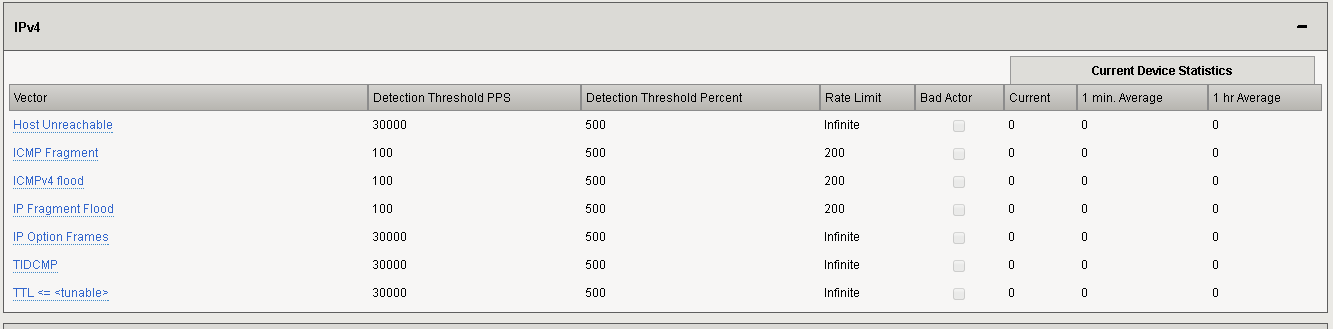
Task 4 – Launch the attack and view the results
Click DoS Protection>>Quick Configuration->ServerNet
Open the following as new tabs (right click and select open link in a new tab) in the DHD UI (Google Chrome Window):
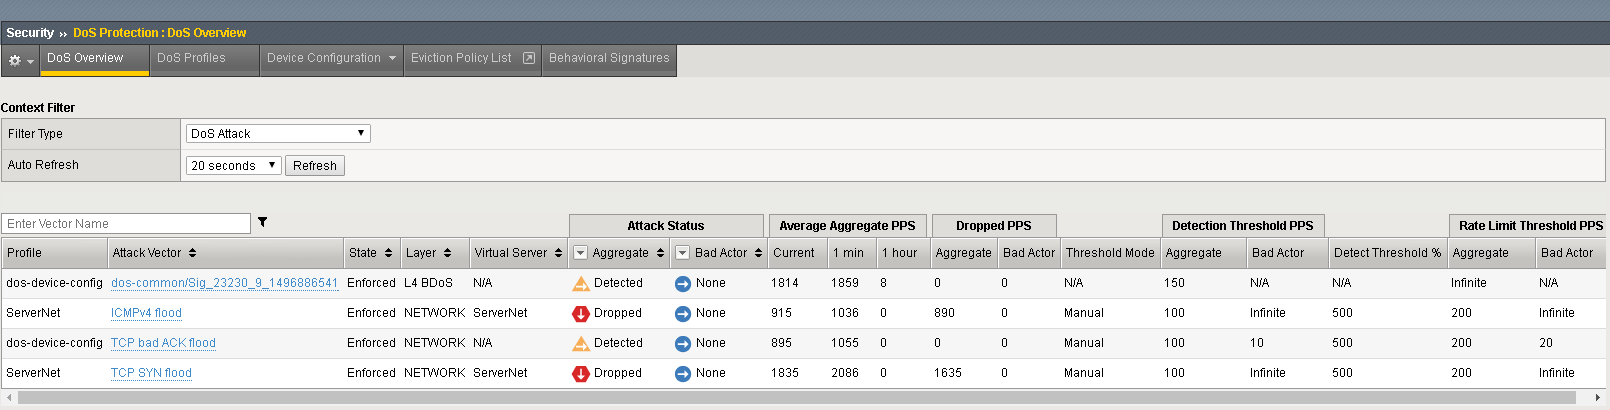
Security>>DoS Protection>>DoS Overview (leave the filter at default: ‘DoS Attack’ and change auto refresh to 20 seconds)
Statistics>>DoS Visibility
Access the Attacker System CLI/shell and launch the attack:
# sudo bash
# cd ~/scripts
# ./multivector.sh
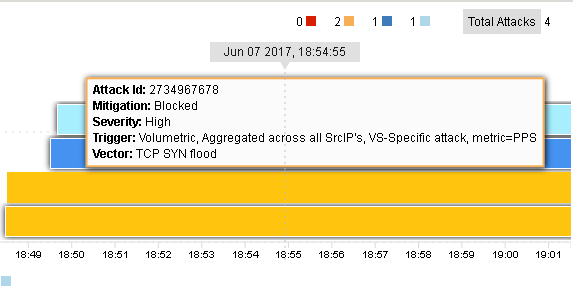
The attacks will be detected immediately. Let the attacks run for a couple of minutes. Click Refresh on the DoS Overview page and it will start to populate. You will see some attacks mitigated by Device Configuration and some mitigated by the more specific settings on the ServerNet Protected Object:
Navigate to Security>>Event Logs>>DoS->Network>>Events.
Click on “custom search…” link.
Drag one of the values from the “Attack Type” column into the custom search builder. From the Action column, drag Drop into the search builder. Click “Search”
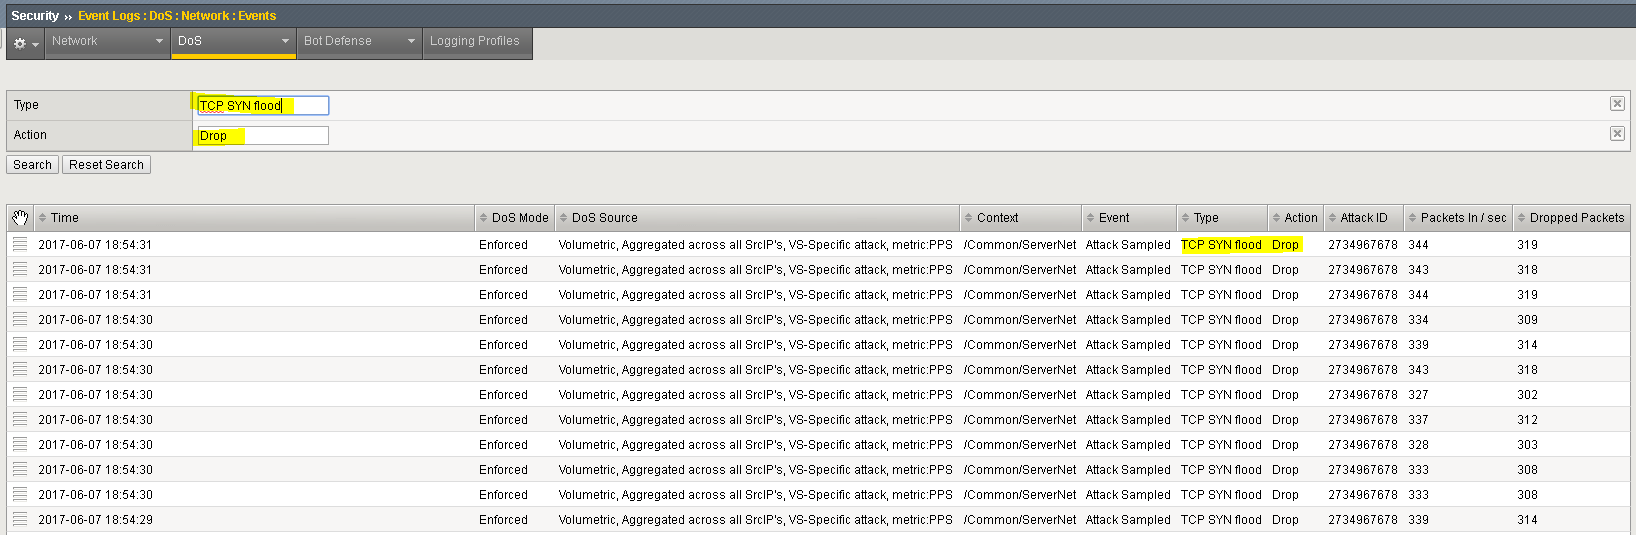
Further explore the DoS Event logs. For example, clear the search and identify the “Stop” and “Start” times for an attack, etc.
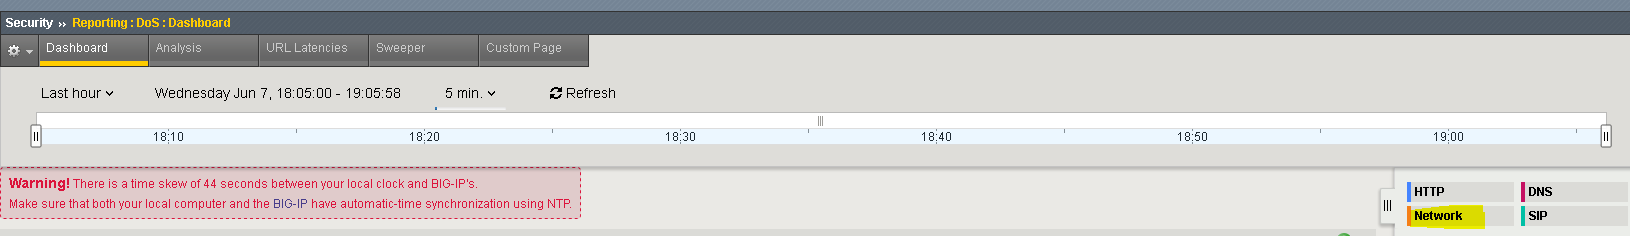
In the Hybrid Defender WebUI, access the DoS Visibility reporting tool at Statistics>>DoS Visibility. If you get a time-skew warning, then please ignore it as it’s the Windows PC that can’t keep the clock right.
Note
The DoS Visibility is a reporting tool, not a real-time monitoring tool. Events are displayed, much like other AVR-based reporting, in 5 minute windows. Do not expect events to be shown here immediately after running an attack. Quicker/real-time monitoring of on-going DoS attacks is best accomplished in the DoS Event Logs and DoS Overview areas of the WebUI.**
You should see the attacks in the timeline and a variety of details in the windows. Use the slider to shorten the timeframe if needed, and click the Network filter, to focus on L4 attacks and mitigation.
Stop the attack (Ctrl+C) in the Attacker CLI (ssh window).
Task 5 – Configure Bad Actor Detection
Add bad actor detection for a for the UDP flood protection.
In the Configuration Utility, open the DoS Protection >> Quick Configuration page and in the Protected Objects section click ServerNet.
In the UDP row click the + icon, and then click UDP Flood.
On the right-side of the page configure using the following information in the table, and then click Update.
Set the UDP Flood vector settings:
Setting Value Enforce selected Manual Configuration selected Detection Threshold PPS 100 Detection Threshold Percent 500 Rate Limit 200 Bad Actor Detection selected Per Source IP Detection 100 PPS Per Source IP Rate Limit 30 PPS Blacklist Attacking Addresses selected Detection Time 15 seconds Duration 120 seconds 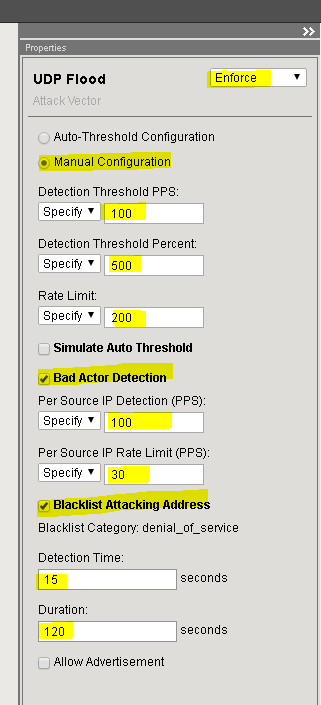
Open the following in new tabs (Google Chrome - right click and select open link in new tab) in the DHD UI:
DoS Protection>>Quick Configuration>>ServerNet
Security>>DoS Protection>>DoS Overview (leave filter at default: “DoS Attack” and set refresh rate to 20s)
Statistics>>DoS Visibility
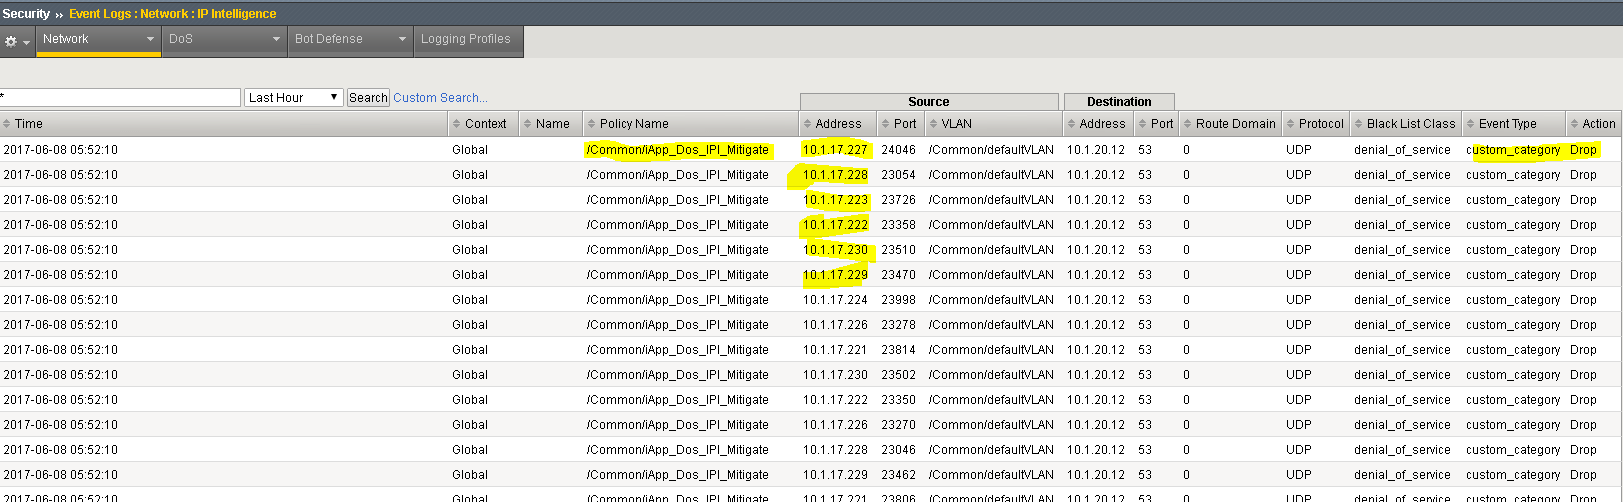
Security>>Event Logs>>Network->IP Intelligence
Access the Attacker system CLI (putty ssh) and run the UDP flood attack:
# sudo bash
# cd ~/scripts
# ./udp\_flood.sh

From the menu, select ‘1’ to start the attack

root@attacker-a:~/scripts# ./udp\_flood.sh
1) Attack start
2) Attack end
3) Quit

#?
Note
This attack is relatively short-lived. You can launch it again if the attack ends and you are not finished showing the various reports. Simply type ‘1’ again, to re-run the attack. You may have to run the attack multiple times using ‘1’.
In the DoS Overview page observe the blocks by Bad Actor


In the IP Intelligence Event Logs observe the IP addresses that are being added to the denial_of_service blacklist.
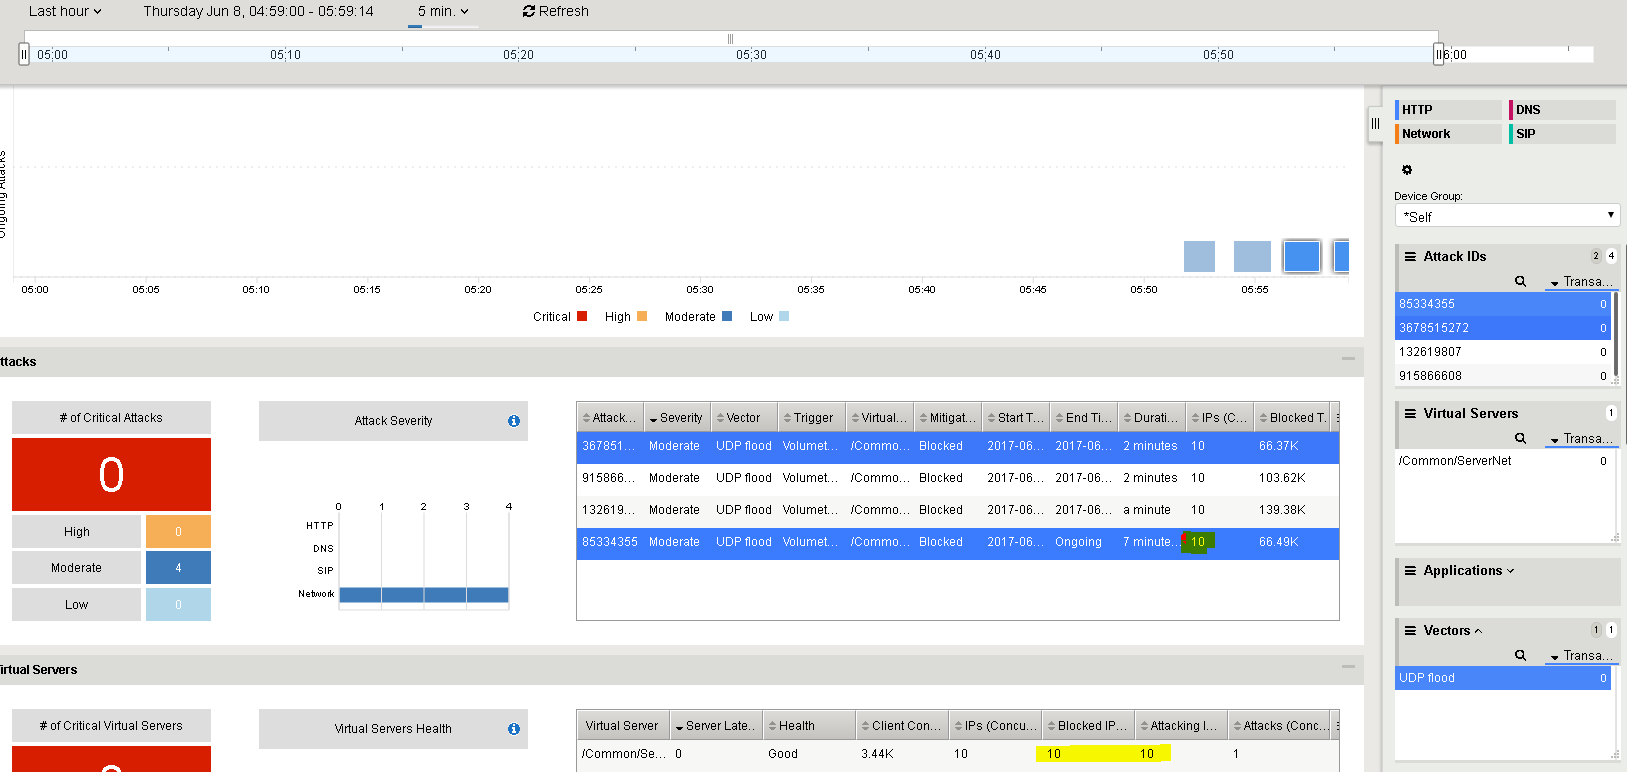
In the DoS Visibility tab expand the Vectors inspector and select UDP Flood. When it updates, select a flood from the timeline. Note in the Attacks panel the #IPs blocked is 10
End the UDP_Flood attack script by typing ‘2’ to kill any still running processes and then ‘3’ to exit the script.
Clean-Up : Be sure to stop all hping3 processes by using the following command:
# sudo bash
# killall -9 hping3