F5 Solutions for DDoS > Class 3: DDoS Hybrid Defender > DDoS Hybrid Defender Setup Source | Edit on
Lab 4 - Multi-vector Demo
In this simple demo you will launch a small number of network attacks and show the configuration, logging and reporting capabilities of the Hybrid Defender. The point of this demo is to provide context for a UI walkthrough with some live data.
Task 1 - Access DoS Quick Configuration and display the ServerNet protected object
This protected object is defending all ports/protocols for 10.1.20.0/24, which is the network behind the Hybrid Defender. Attacks will be launched at 10.1.20.12, which is an interface on the LAMP server. Verify that the following vectors are configured:
- Add the TCP vectors under DDoS Settings.
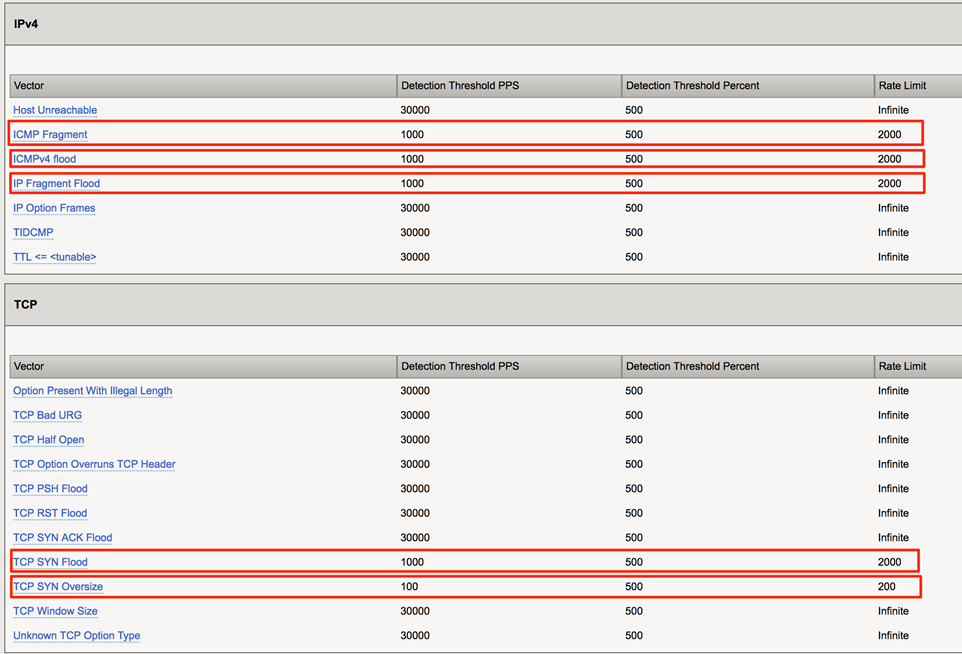
- Click Update when finished.
You will now launch the attacks and show the behavior
Open the following tabs in the DHD UI:
DoS Protection->Quick Configuration->ServerNet
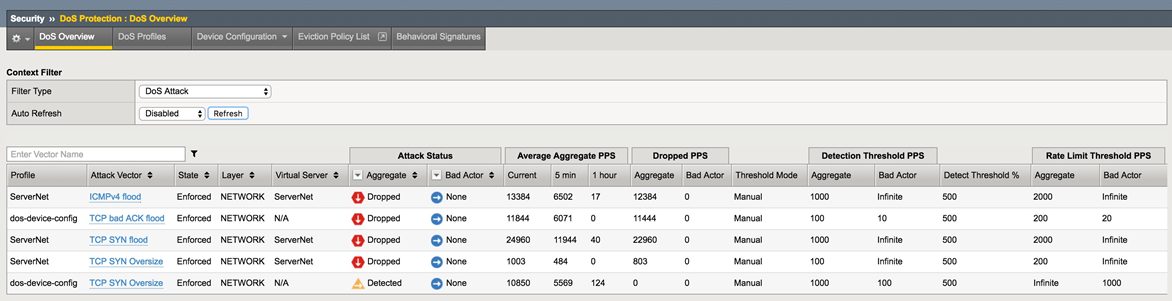
Security->DoS Protection->DoS Overview (leave the filter at default: ’DoS Attack’)
Statistics->DoS Visibility
Access the Attacker shell and run the following commands/attack
# cd ~/scripts
# ./multivector.sh
Click Refresh on the DoS Overview page. You will see some attacks mitigated by Device Configuration and some mitigated by the more specific settings on the ServerNet Protected Object.
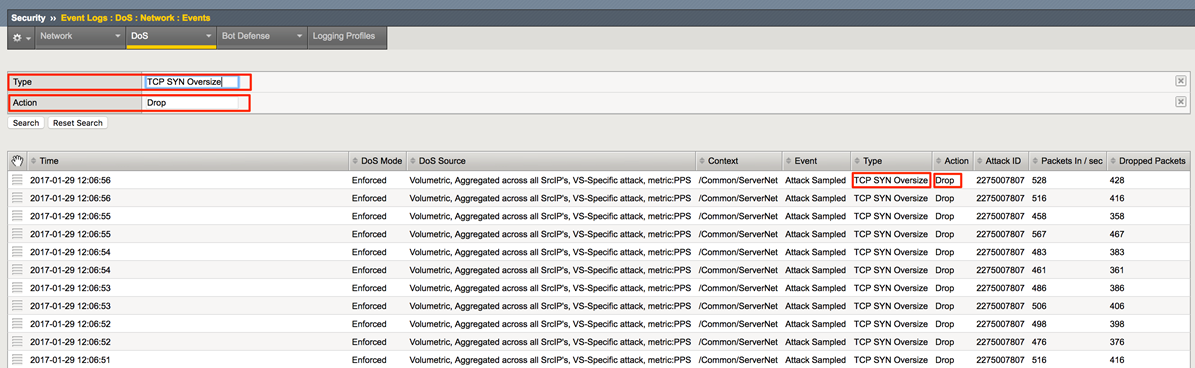
Navigate to Security->Event Logs->DoS->Network->Events.
Click on “custom search…” link.
Drag one of the values from the “Attack Type” column into the custom search builder. From the Action column, drag Drop into the search builder. Click “Search”.
Further explore the DoS Event logs. For example, clear the search and identify the “Stop” and “Start” times for an attack, etc.
Task 2 – View the DoS Visibility Page
You can now use the new DoS Visibility page to view statistics about the DoS attacks you submitted during this exercise.
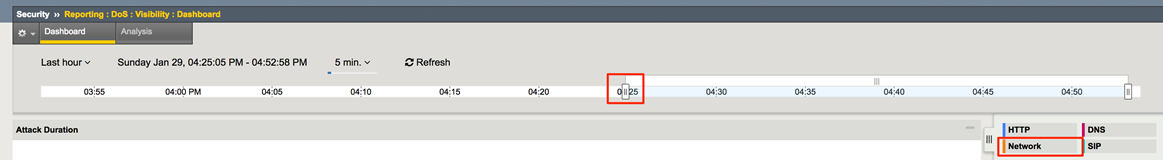
- In the Hybrid Defender WebUI, access the DoS Visibility reporting tool at Statistics->DoS Visibility.
Note
DoS Visibility is a reporting tool, not a real-time monitoring tool. Events are displayed, much like other AVR-based reporting, in 5 minute windows. Do not expect events to be shown here immediately after running an attack. Quicker/real-time monitoring of on-going DoS attacks is best accomplished in the DoS Event Logs and DoS Overview areas of the WebUI.
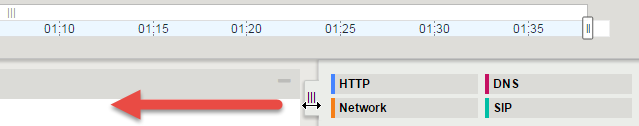
You should see the attacks in the timeline and a variety of details in the windows. Use the slider to shorten the timeframe if needed. You might have to hit refresh several times.
You can select events from the timeline and see details about the attacks.
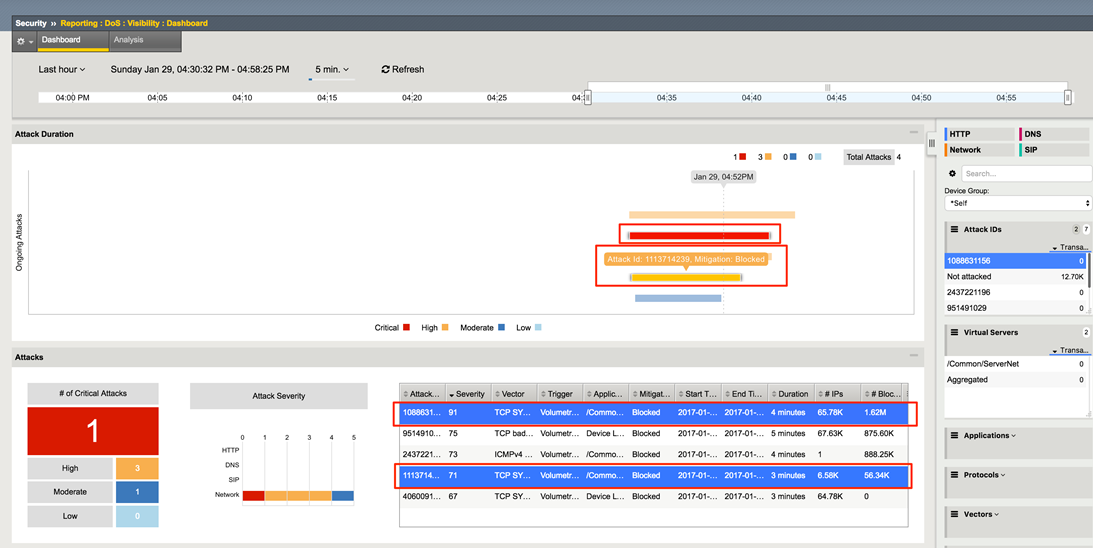
In the Attack Duration window view the attack.
- Scroll down in the left-side of the page to view the Attacks section.
View the details at the bottom of the Attacks section.
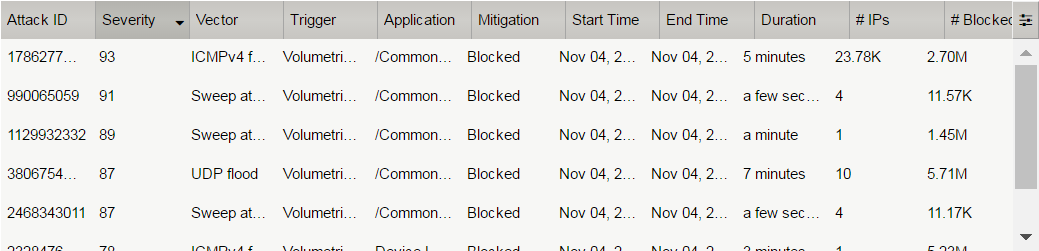
This table displays details of each attack that has occurred.
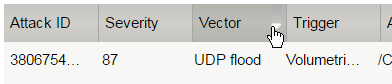
Sort this table by Vector.
Scroll down in the left-side of the page to view the Virtual Servers section.
You can see the details of device-wide attacks (Device Level) and protected object-level attacks (/Common/ServerNet).
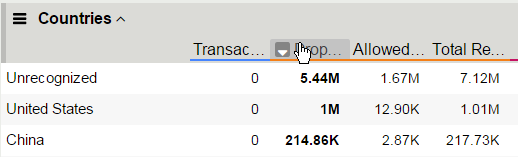
Scroll down in the left-side of the page to view the Countries section.
View the details at the bottom of the Countries section. This table displays the attack details from each country.
View the various widgets in the panel on the right-side of the page.
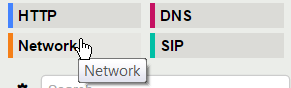
Click Network to filter out only the network-level attacks (all the attacks so far have been network-level).
If it’s not already expanded, expand the Virtual Servers widget, and then select /Common/ServerNet.
This filters the results to only attacks at this protected object-level. Notice the changes to the map on in the Countries section.
Click /Common/ServerNet to remove the filter.
Drag the resize handle on the right-side of the main window as far to the left as possible.
Expand the Vectors widget, and then select ICMPv4 flood.
Expand the Client IP Addresses widget.
Question: How many client IP addresses contributed to this attack?
Expand the Countries widget.
Sort the countries by Dropped Requests.
Select China, and then view the changes to both the Client IP Addresses widget and the map.
At the top of the page open the Analysis page.
Note
The requests are still filtered for the ICMPv4 flood results for China.
- Drag the resize handle on the as far to the right as possible.
- Examine the Avg Throughput (Bits per second) graph.
- Place your mouse over the peak in the graph.
Question: What is the Average client in throughput during the attack?
- Feel free to examine more of the Dashboard page and the Analysis page.
- Type Ctrl + C to stop the attack.