Advanced Multi-layer Firewall Protection > Advanced Multi-Layer Firewall Protection > Module 2: AFM Packet Tester, Flow Inspector, Stale Rule Lab Source | Edit on
Advanced Firewall Manager (AFM) Packet Tracer
Create and View Packet Tracer Entries
In this section, you will generate various types of traffic as you did previously, but you will view the flow using the network packet tracer.
- Return to the TMUI in Chrome and log in if necessary.
- Navigate to Security > Debug > Packet Tester.
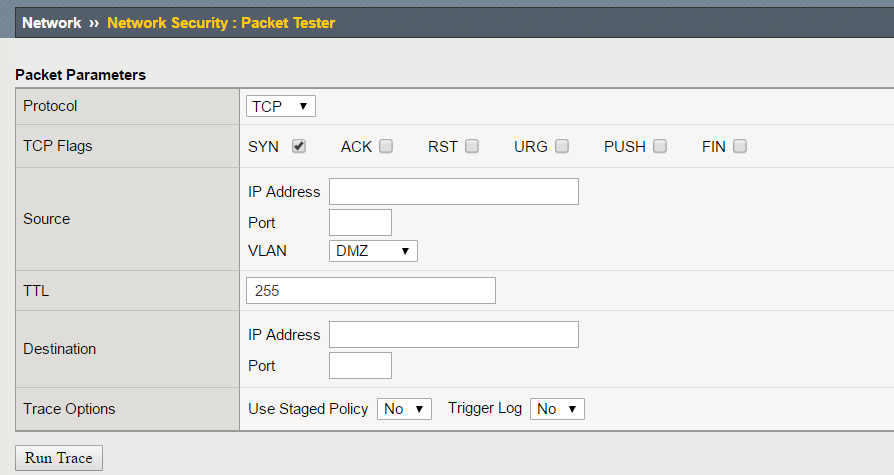
Create a packet test with the following parameters:
| Protocol | TCP |
|---|---|
| TCP Flags | SYN |
| Source | IP - 1.2.3.4 Port – 9999 Vlan – external |
| TTL | 255 |
| Destination | IP – 10.1.20.11 Port - 80 |
| Trace Options | Use Staged Policy – no Trigger Log - no |
3. Click Run Trace to view the response. Your output should resemble the allowed flow as shown below:
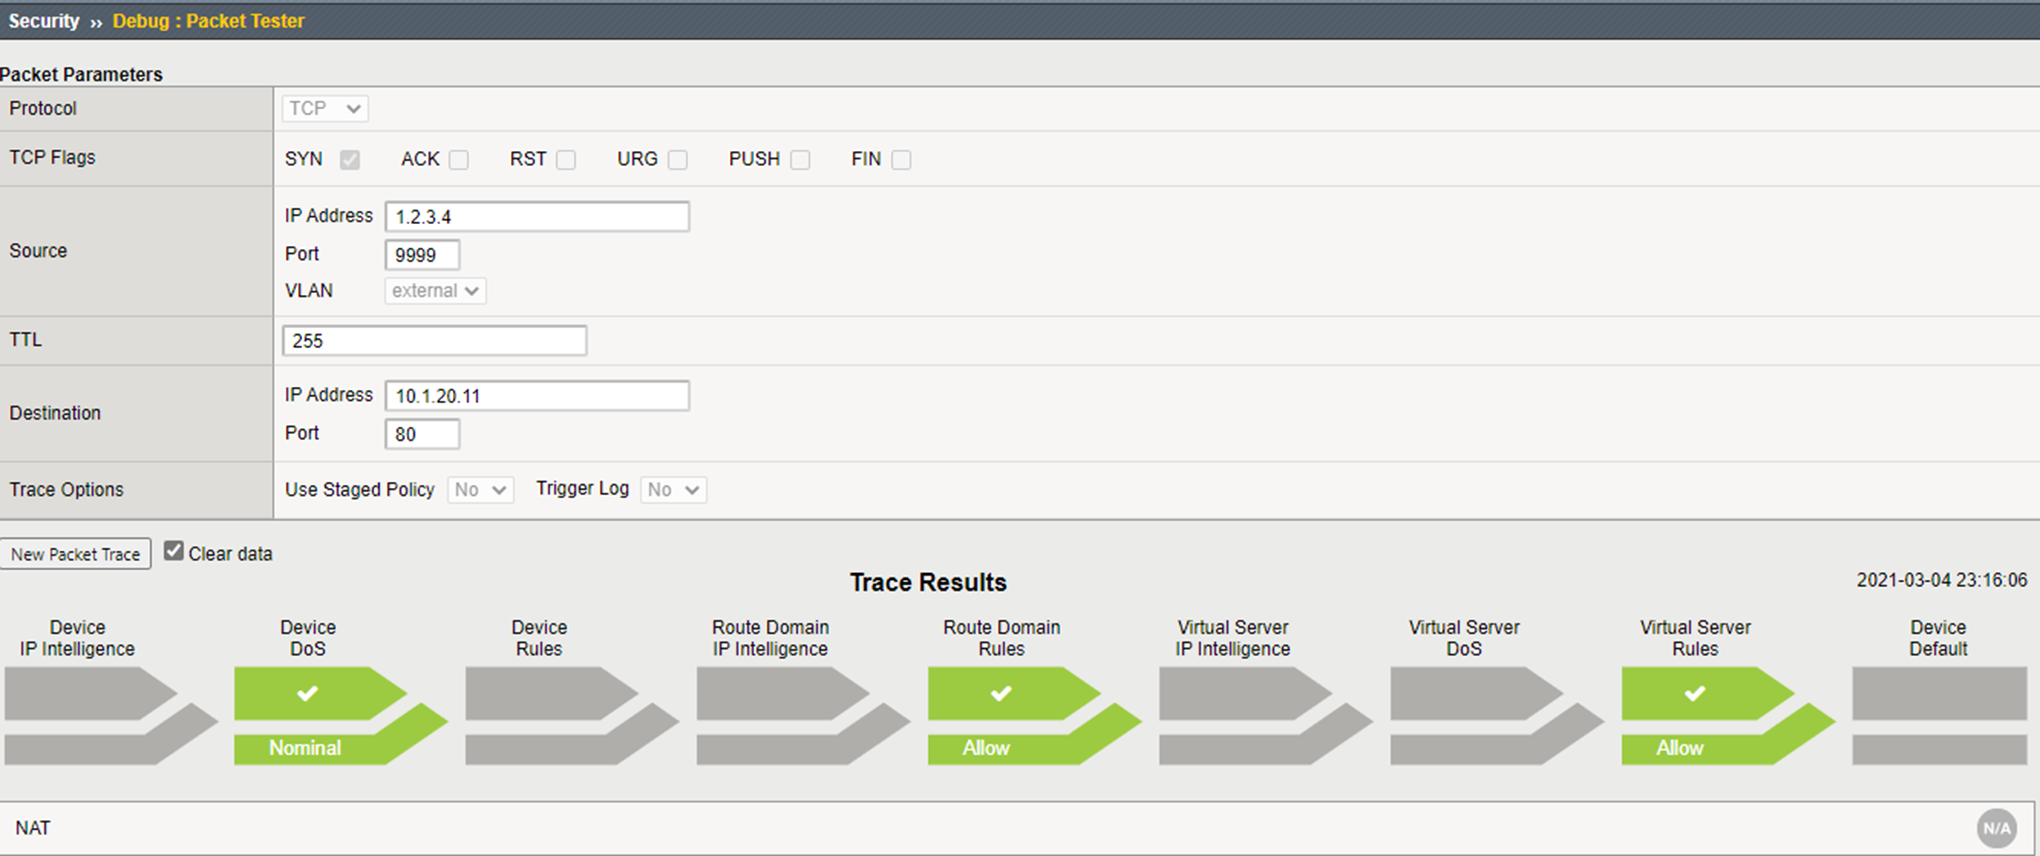
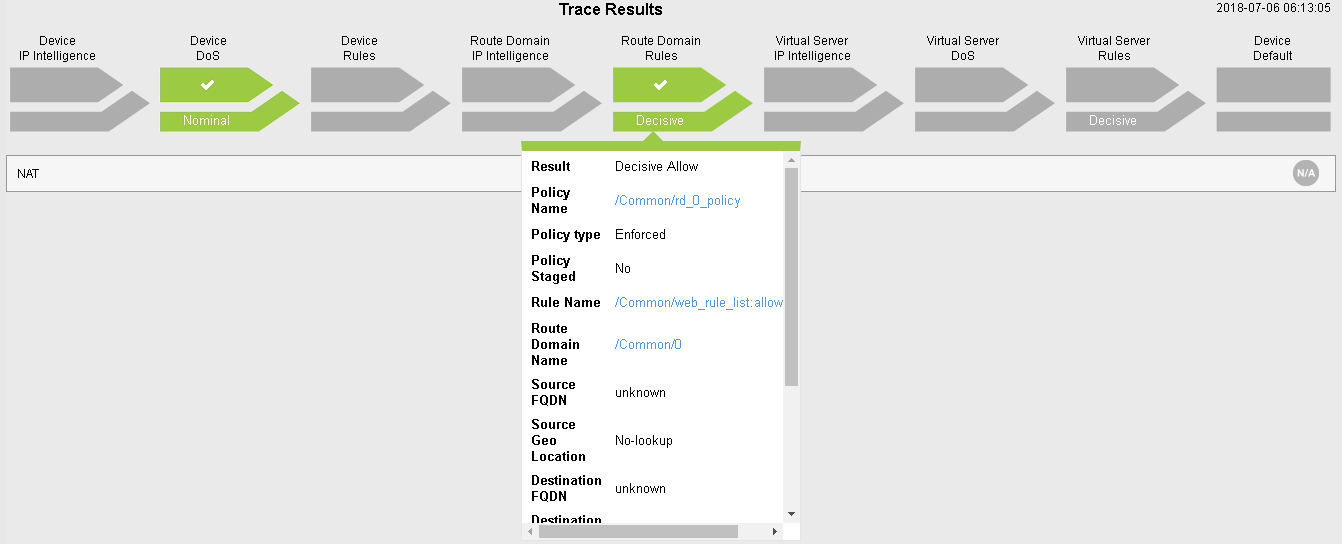
You can also click on the “Route Domain Rules” trace result and see which rule is permitting the traffic.
4. Click New Packet Trace (optionally do not clear the existing data – aka leave checked).
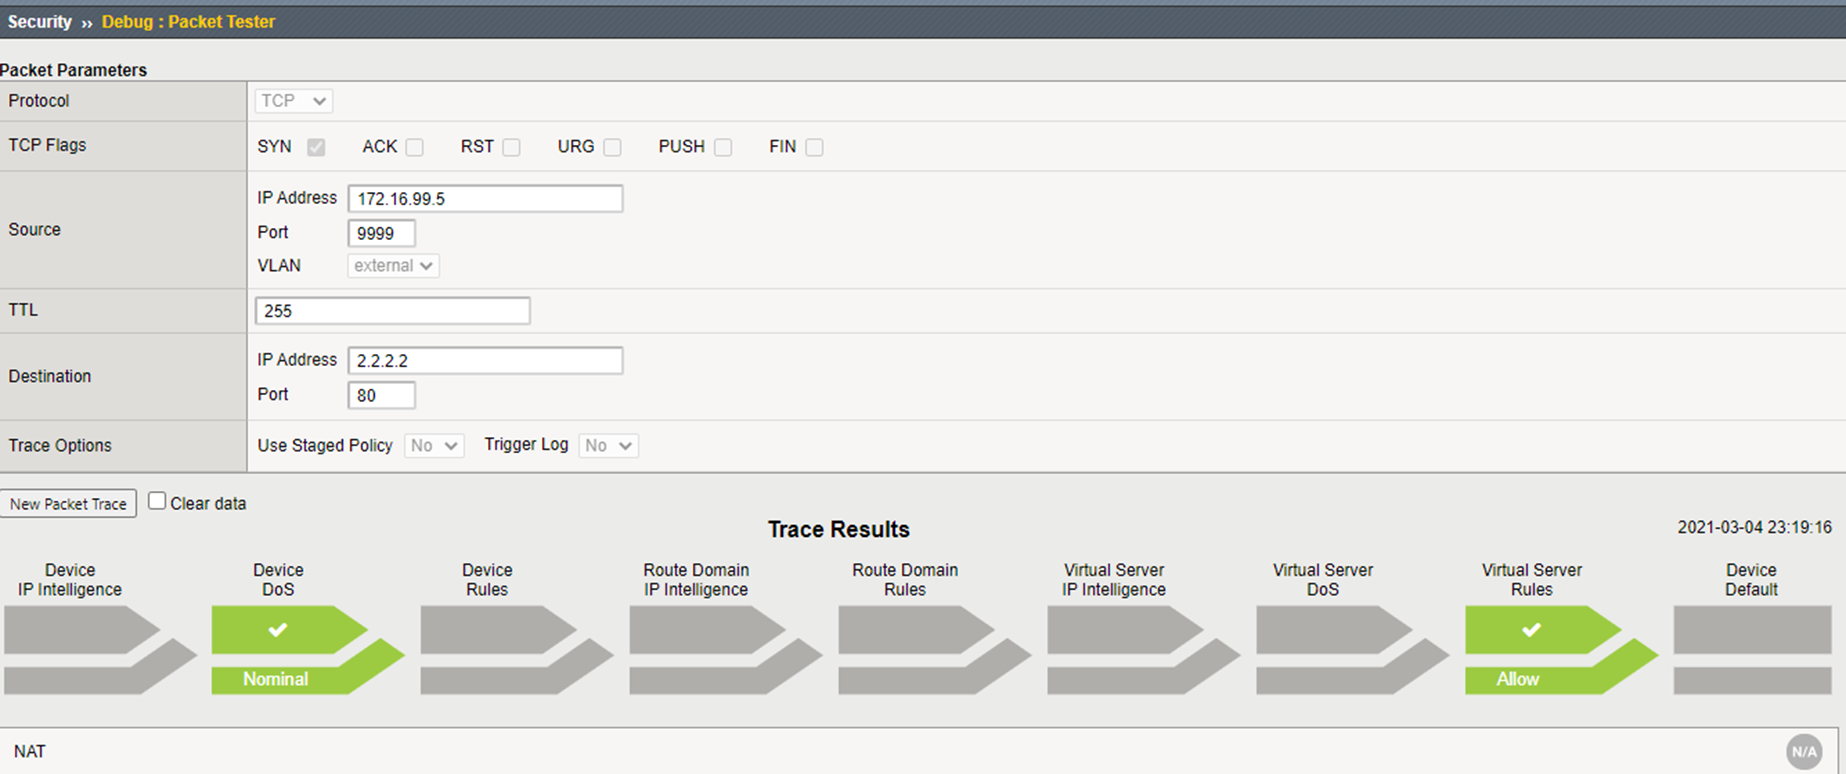
- Create a packet test with the following parameters:
| Protocol | TCP |
|---|---|
| TCP Flags | SYN |
| Source | IP - 172.16.99.5 Port – 9999 Vlan – External |
| TTL | 255 |
| Destination | IP – 2.2.2.2 Port - 80 |
| Trace Options | Use Staged Policy – no Trigger Log - no |
6. Click Run Trace to view the response. Your output should resemble the allowed flow as shown below:
7. Next to the New Packet Trace button, note the Clear Data checkbox. Uncheck it, so you won’t have to input all the fields again.
| Protocol | TCP |
|---|---|
| TCP Flags | SYN |
| Source | IP - 172.16.99.7 Port – 9999 Vlan – external |
| TTL | 255 |
| Destination | IP – 2.2.2.2 Port - 80 |
| Trace Options | Use Staged Policy – no Trigger Log - no |
This traffic will be blocked by the virtual Server rule.
- Click on the Virtual Server Rules Icon to get more specific information.
- Click Next to continue.