NGINX Modern Apps > Class 10 - NMS API Connectivity Manager > Module 8 - Observability and Monitoring Source | Edit on
Step 16 - System Metrics and Events
NGINX Management Suite Instance Manager provides metrics and events data for your instances. System metrics are collected by the NGINX Agent without requiring the user to perform any additional setup. NGINX traffic metrics are also being collected as part of the earlier ACM configurations.
The data that Instance Manager collects can be divided into two categories:
- System metrics: Data collected about the data plane system, such as CPU and memory usage.
- Traffic metrics: Data related to processed traffic from sources such as NGINX OSS, NGINX Plus, or NGINX logs.
NMS also collects events from your NGINX data plane instances so that you have a centralized view of
System Metrics
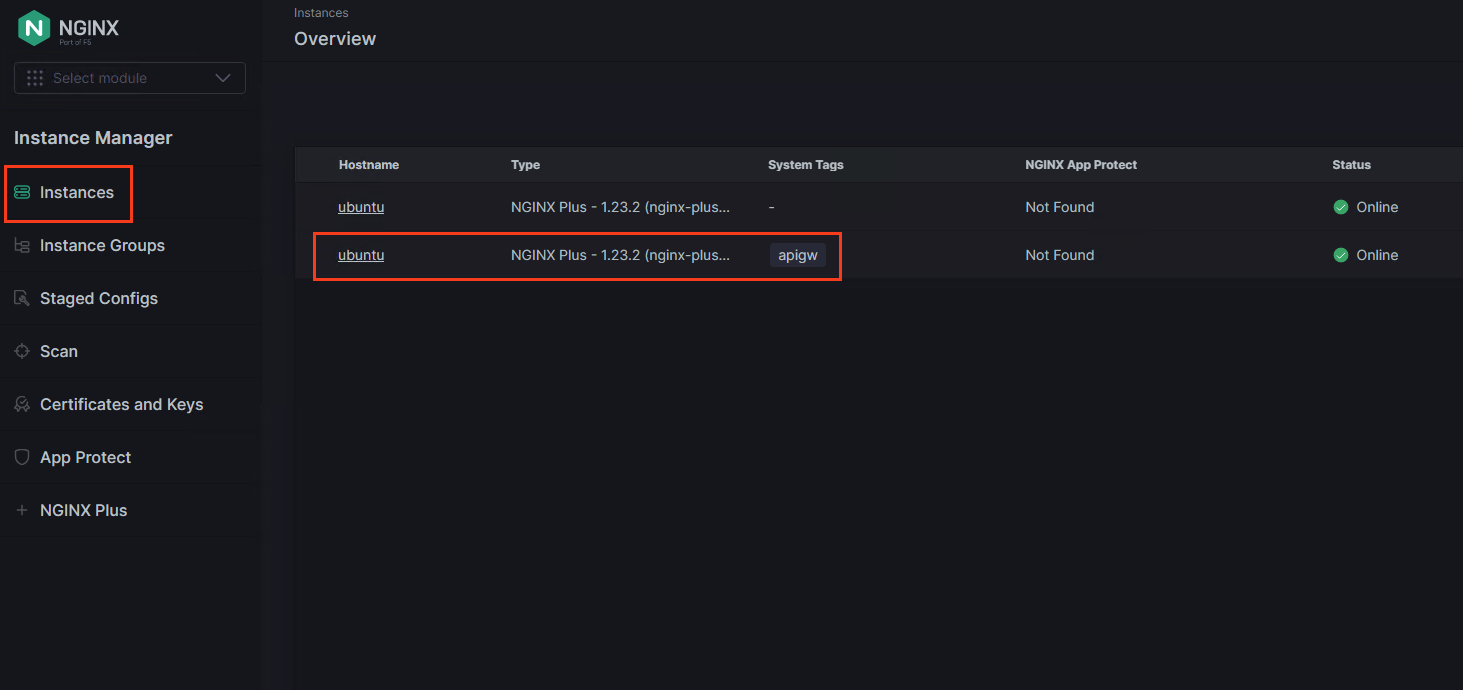
In NMS, switch to the NIM - NGINX Instance Module. Under Modules, select the Instance Manager.
Select the NGINX instance with api-gw tag on the Instances detail page.

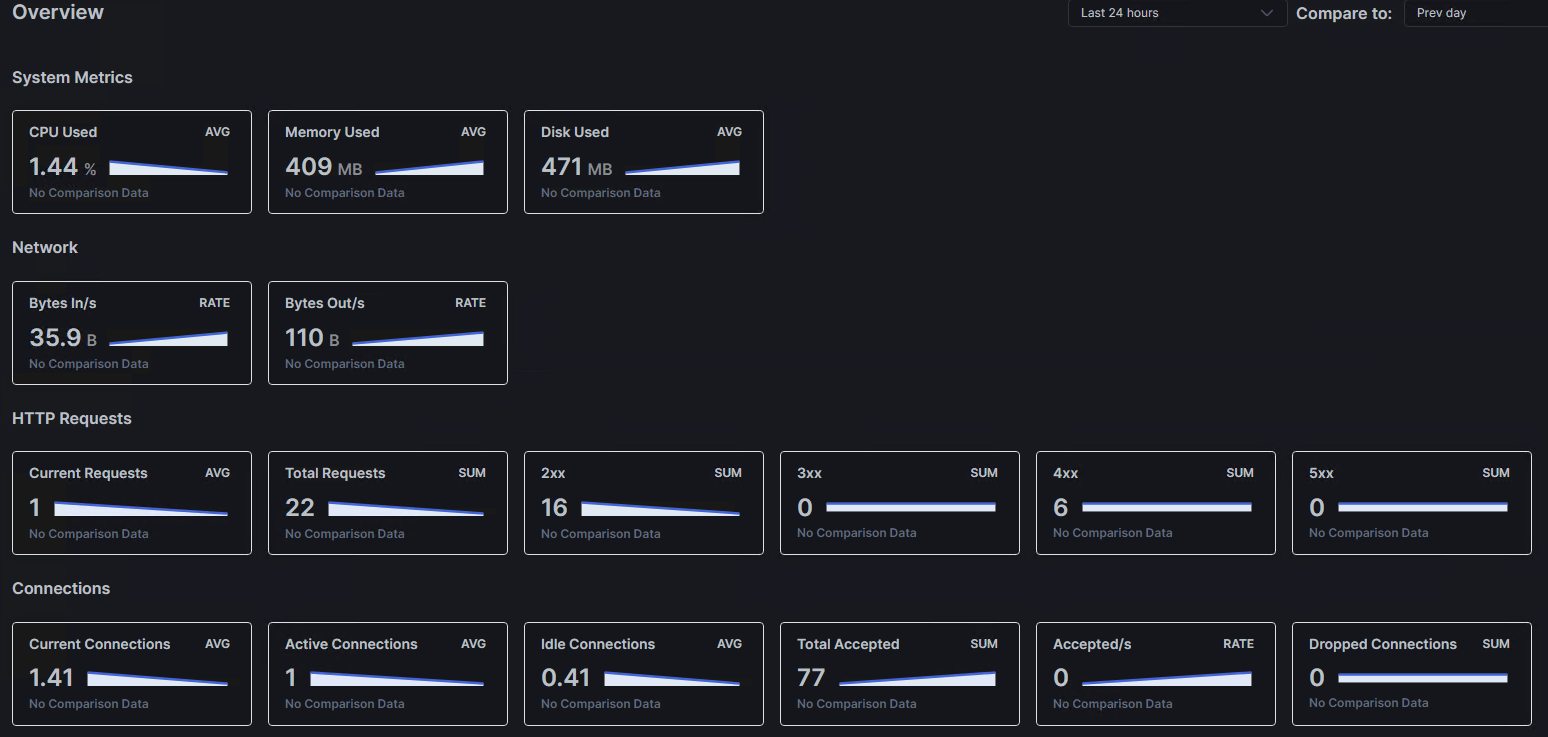
Select the Metrics Summary tab. This view gives you and overview of the NGINX instance for both the System and Traffic metrics. As you can see, the 4xx errors we observered as part of security policy testing are reported to the NMS environment.

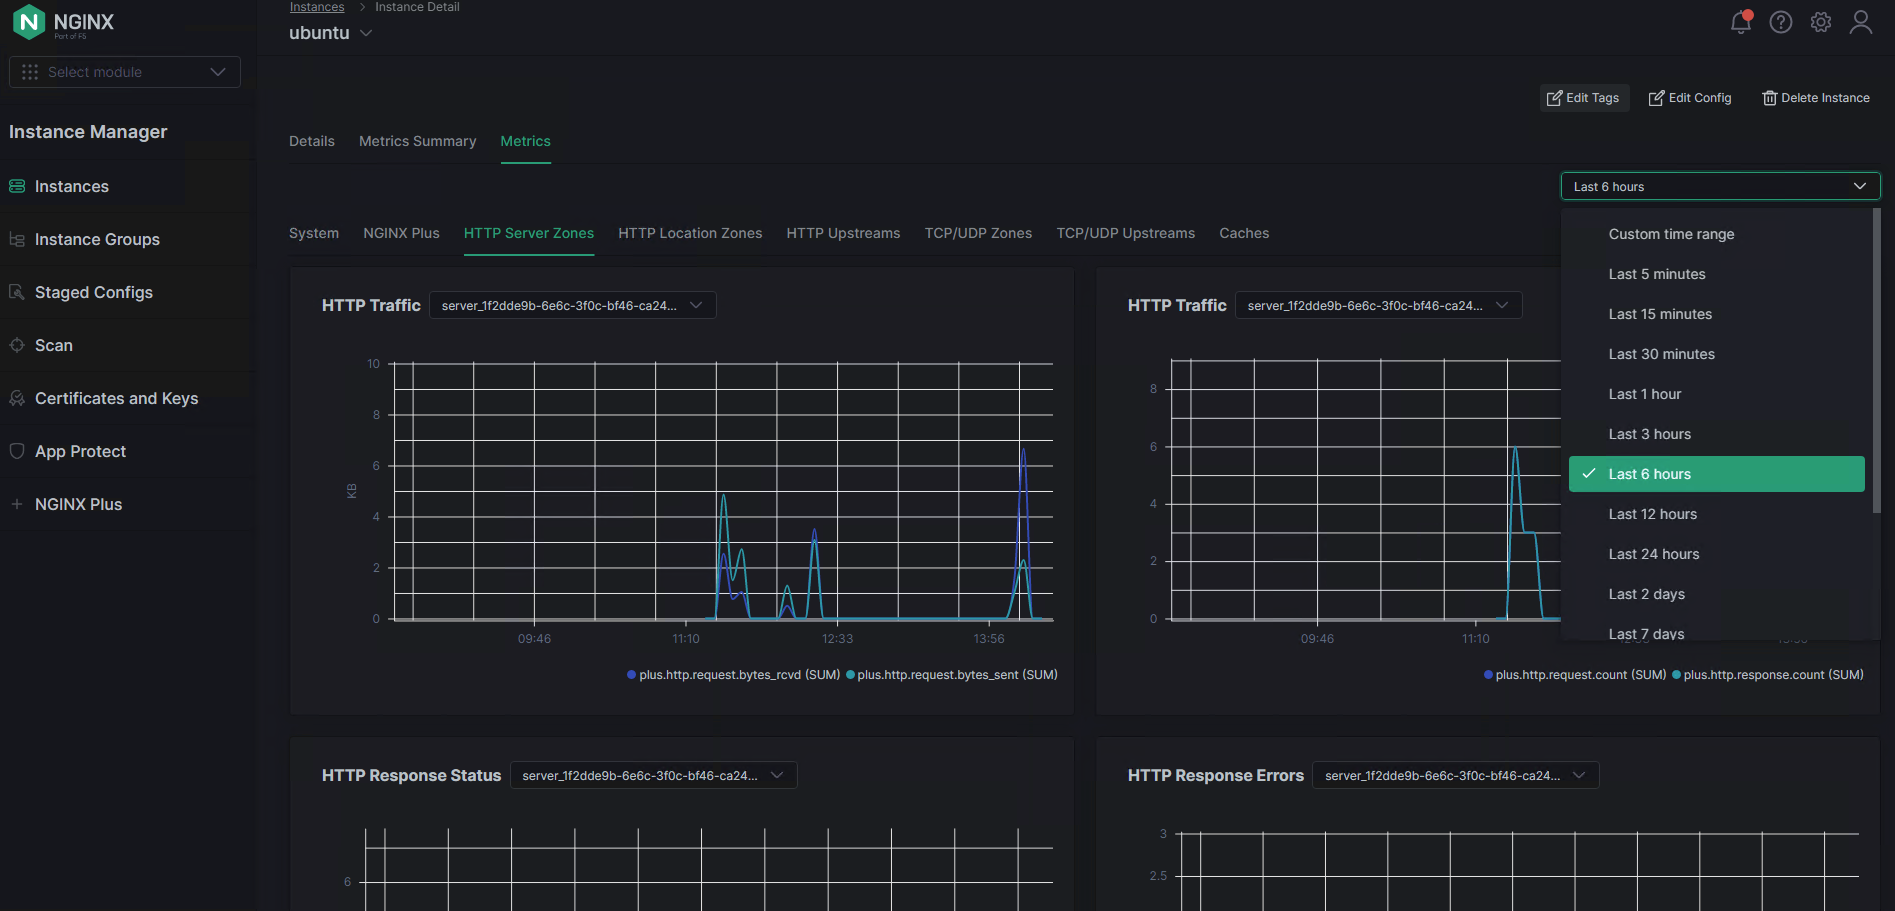
To view detailed metrics as graphs, select the
Metricstab. Here you can refine the time interval of interest and dig into further data metrics data. nMS
Events
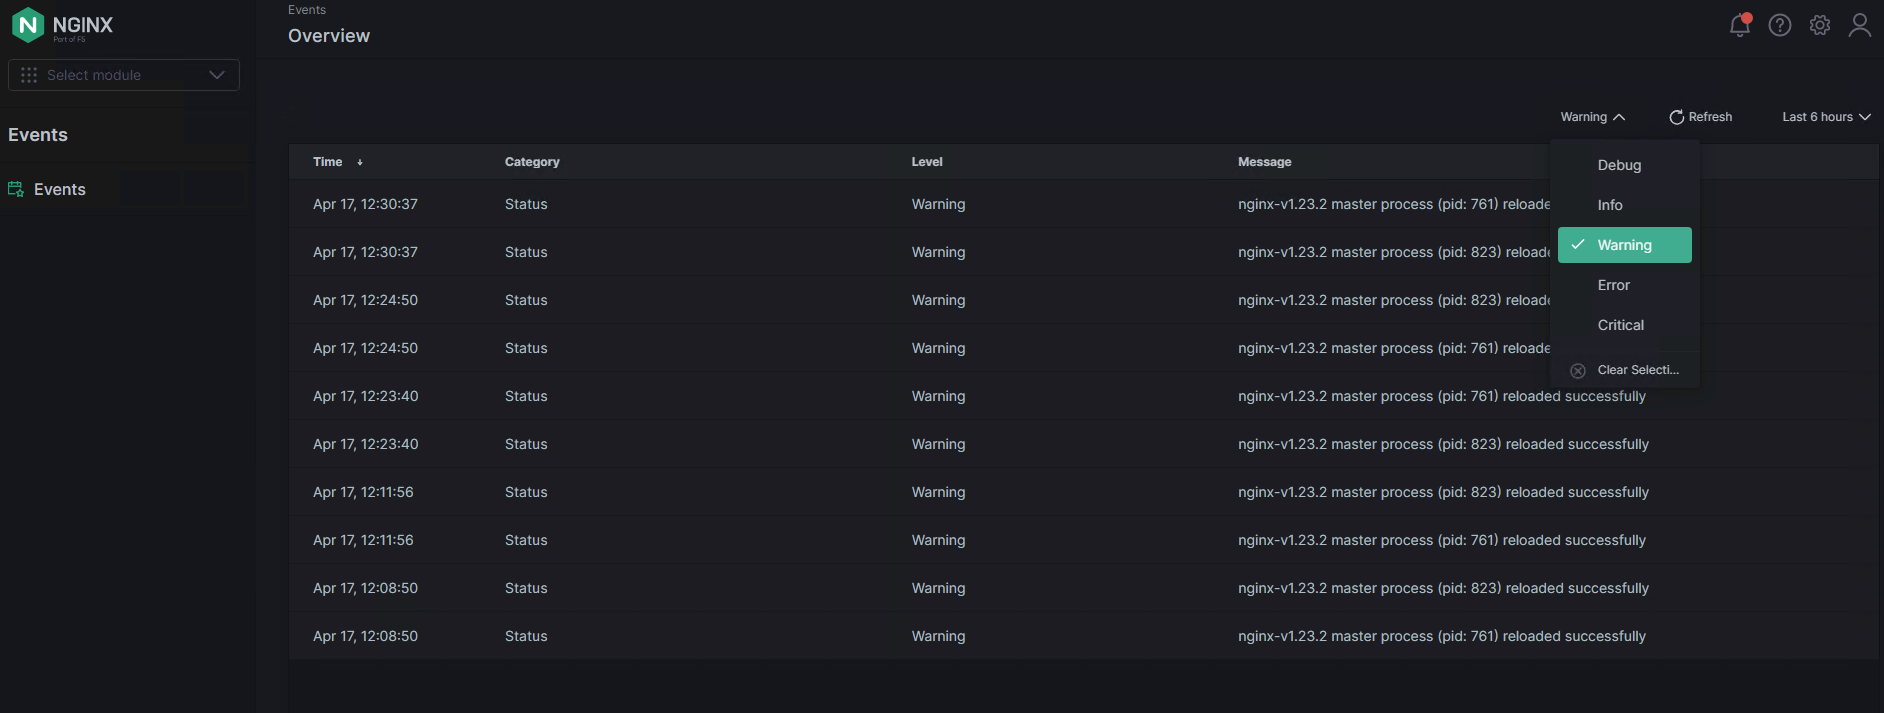
View Events in the User Interface To view events in the Instance Manager user interface, take the following steps:
Open the NGINX Management Suite web interface and log in.
In the Platform section, select Events. The Events overview page lists the events from the last six hours, with the most recent event listed first.
You can use the filters to filter events by level and time range, and sort events by selecting the column heading.

Select an event from the list to view the details.