NGINX Modern Apps > Class 6 - NGINX API Management > Module 6 - Reporting Source | Edit on
Step 12 - API analytics
There are several ways to check your API Analytics. Under the hood, both the API Definition and Published API are categorized as Applications with Components. You can see analytics for all of them at different levels.
Global Analytics for API Definitions
In NGINX Controller -> Select
Apps->api-sentence-app.From here, you can see the analytics at the application level. This view covers all of the Published API analytics (v1 and v3). If you scroll down, you can see the two distinct
Published APIs.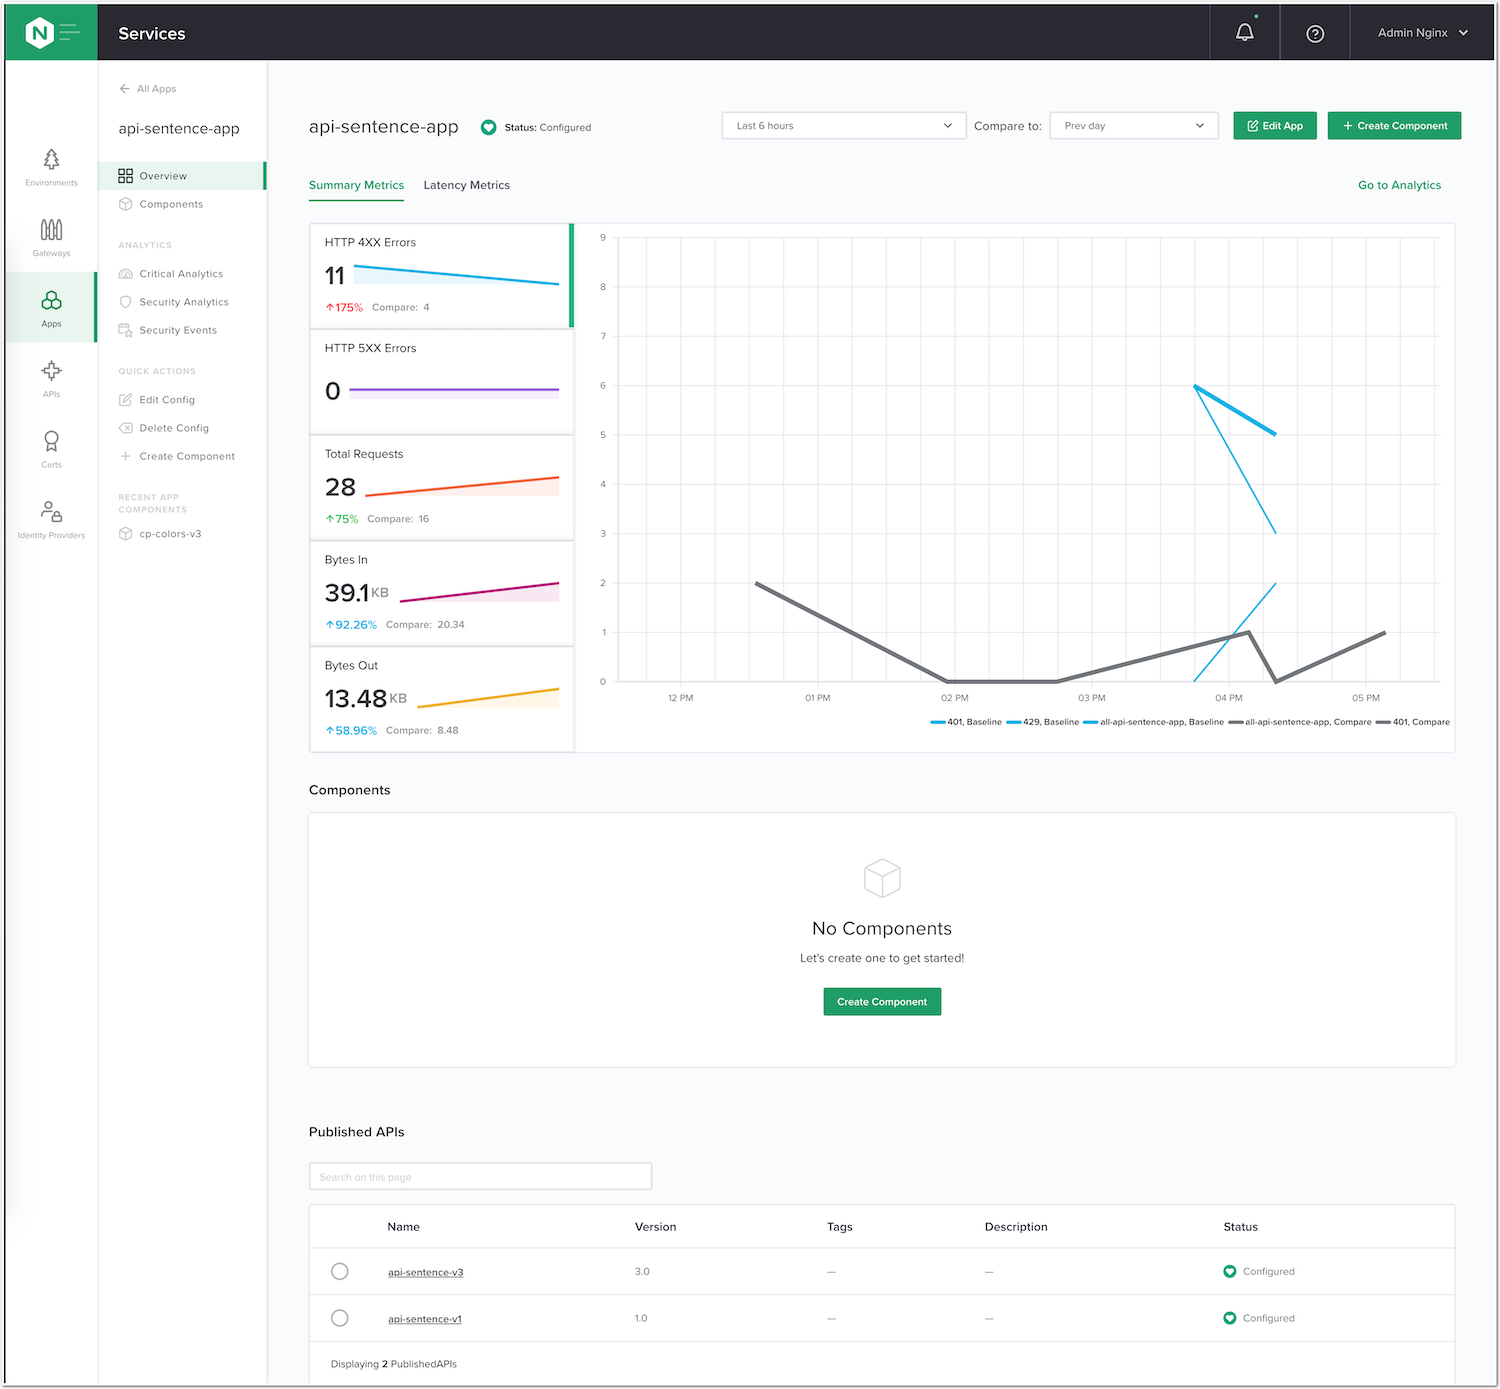
You can go deeper into each individual component’s analytics if you select
Componentson the left side menu.You can then select individual components such as
cp-colors-v3to view a component’s metrics and latency: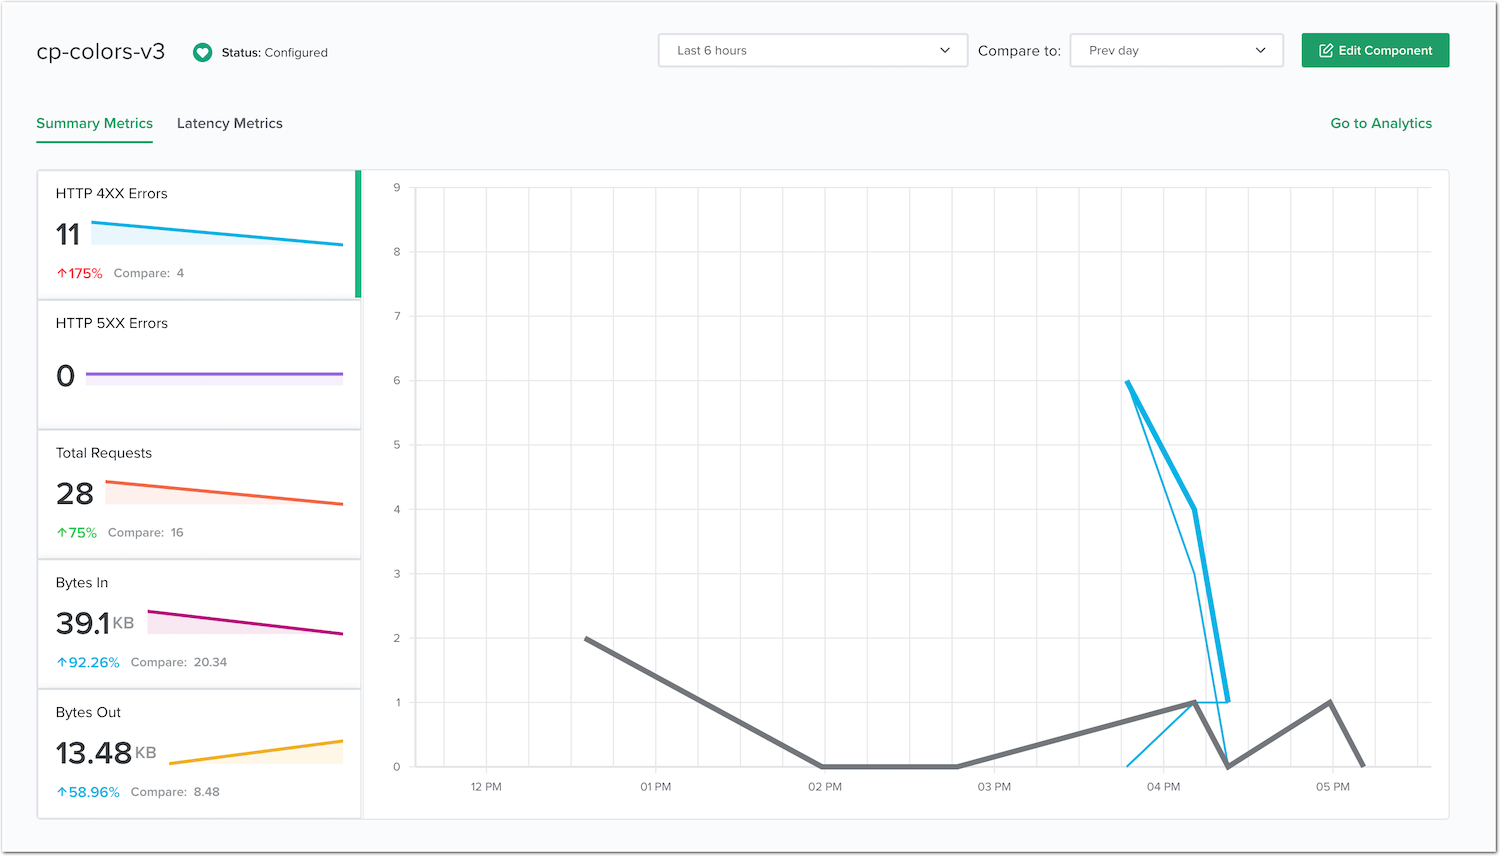
You can also view more fine grained performance analytics if you then click on the left menu on
Critical Analytics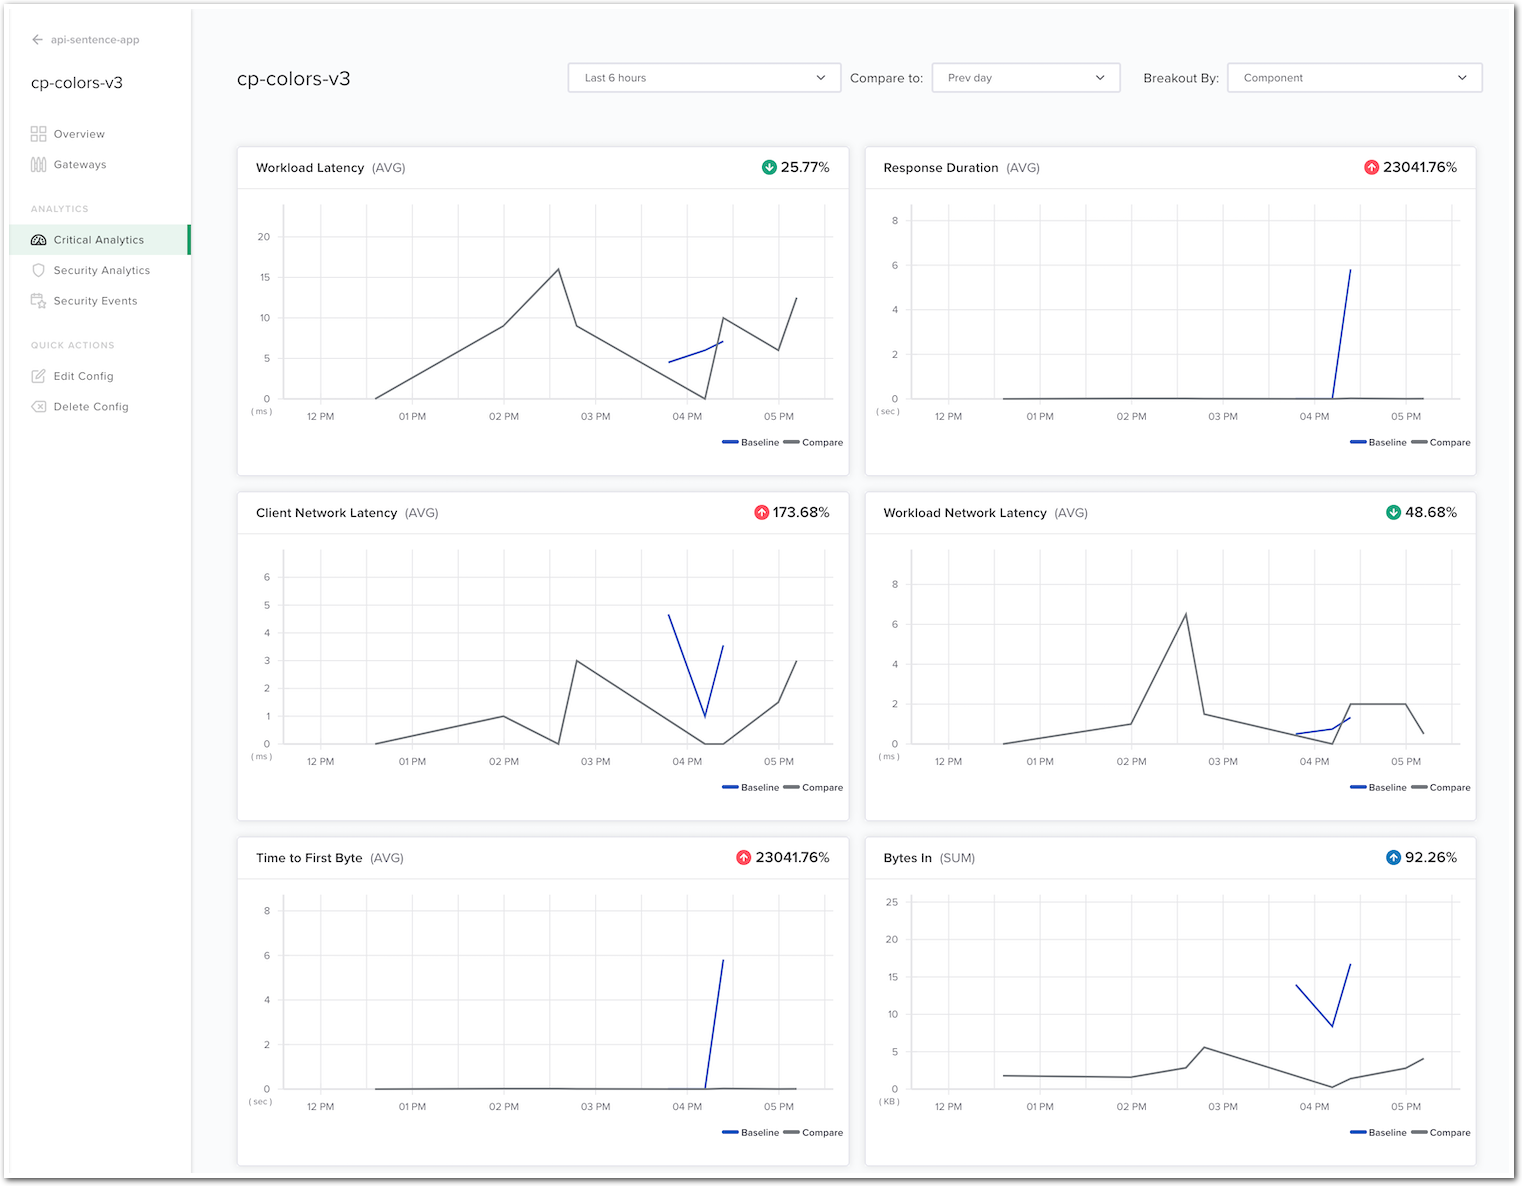
Note
Feel free to navigate to the different analytics menus and understand the various analytics views.
Warning
Congrats! You have successfully finished this lab! Visit https://nginx.com for more information regarding NGINX Controller, NGINX Plus, and NGINX App Protect!