F5 Public Cloud Solutions > Deploying F5 Solutions to GCP with Terraform and The F5 Automation Toolchain > F5 Telemetry Streaming to Google Cloud Operations Suite’s Cloud Monitoring Source | Edit on
F5 Telemetry Streaming to Google Cloud Operations Suite’s Cloud Monitoring
In the previous lab, you should have generated some traffic that will appear in the GCP monitoring infrastructure.
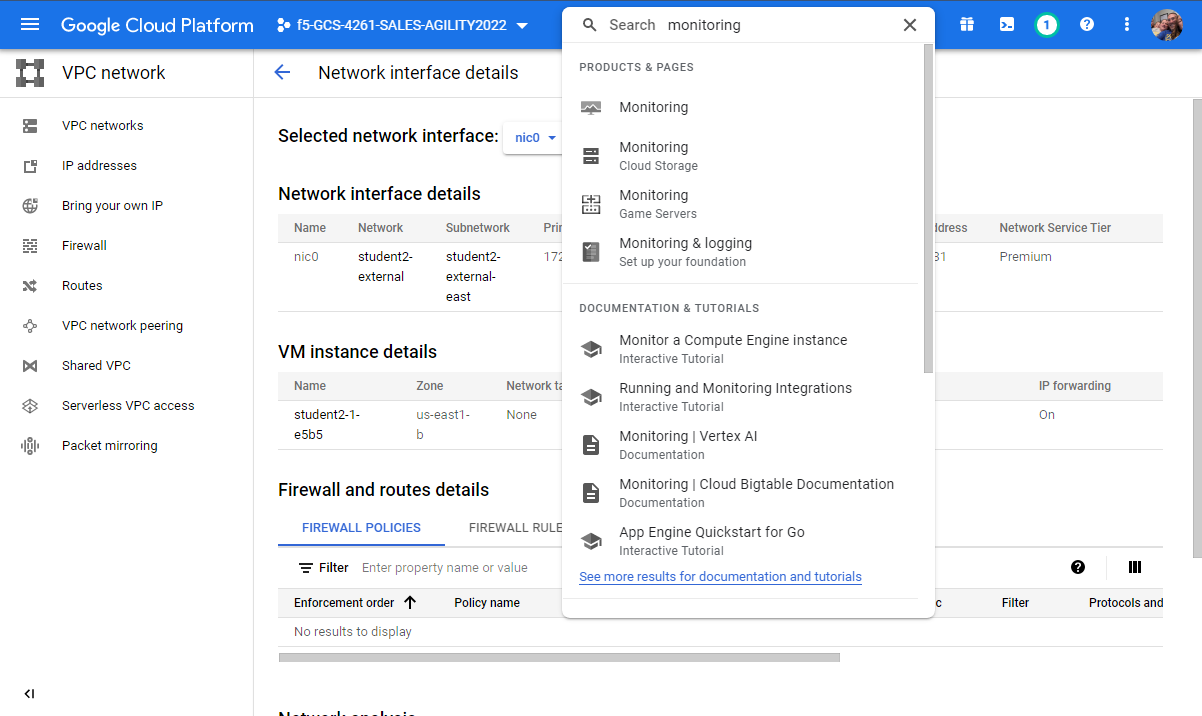
Now from the GCP Console, Services => type “Monitoring” in the search box, choose the first “Monitoring” option from the drop-down results.
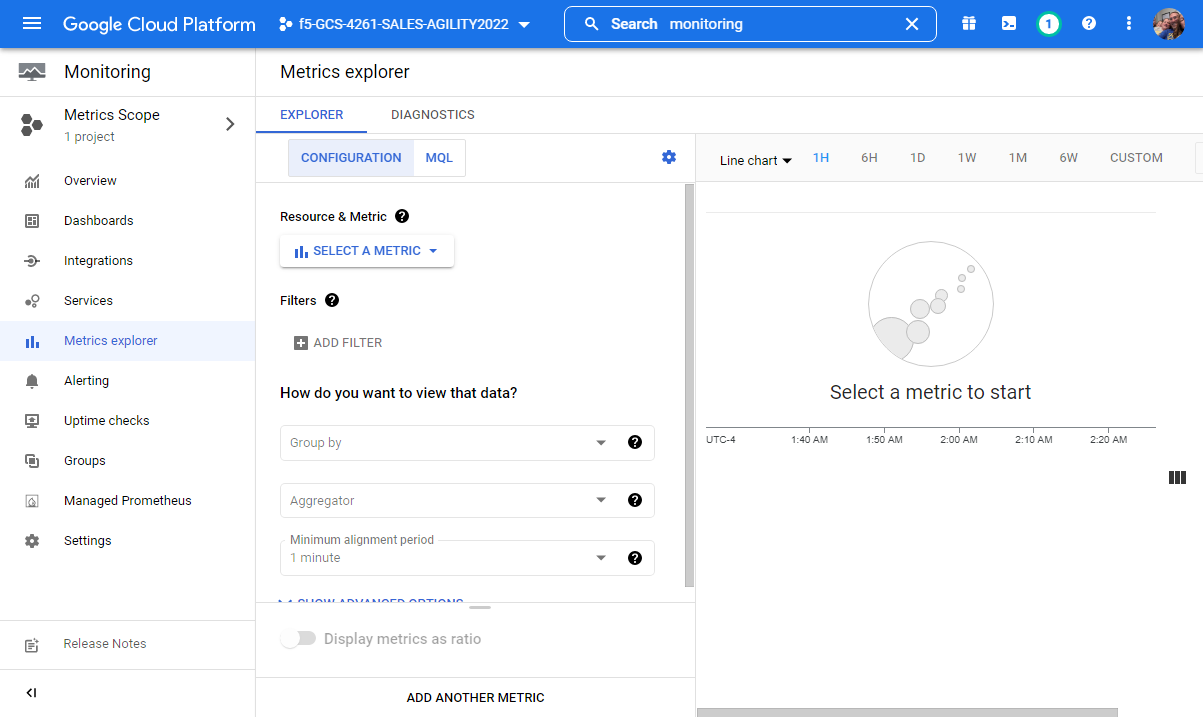
From Monitoring on the side panel => Metrics explorer.
Click on box below Resource & Metric, select VM Instance –> Custom –> custom/system/throughputPerformance/sysPerformanceThroughputClientBitsOut/average and press apply.
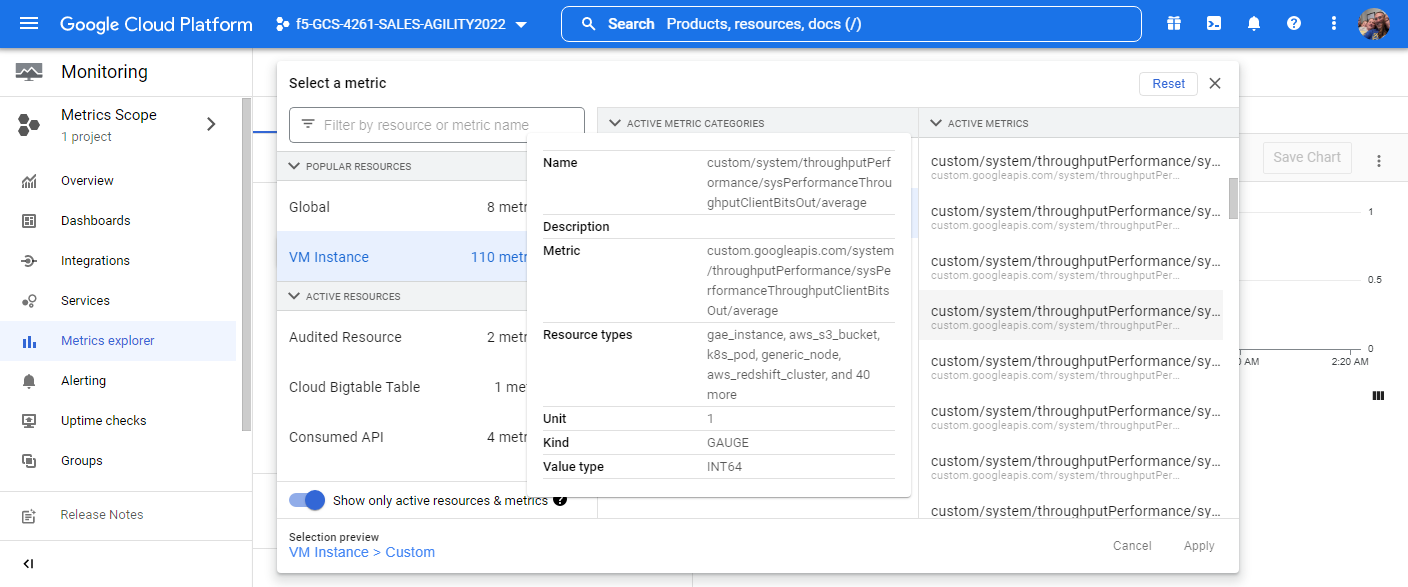
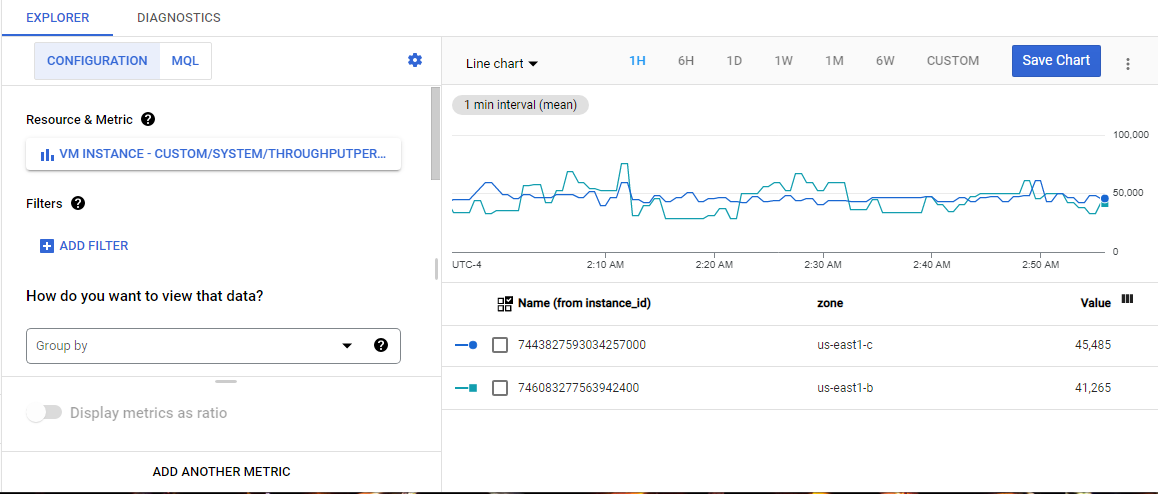
This may take a few minutes, but eventually you will see telemetry data start to be shown.