Distributed Telemetry and Operations Data Aggregation (TODA) for statistics
Overview
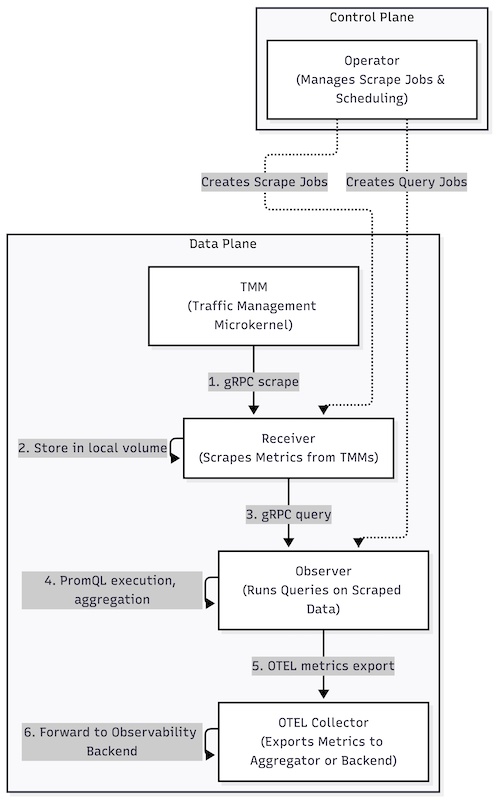
BIG-IP Next for Kubernetes generates terabytes of statistics per second. To manage this load, the system utilises three primary components: the Receiver, the Observer (or Aggregator), and the Operator. TMM provides the statistics, and the metrics scraper containers stream the metrics.
Components
Component |
Runs as |
Role |
|---|---|---|
Operator |
Deployment |
Discovers scraper pods (by the |
Receiver |
StatefulSet |
Sends gRPC requests to Scraper containers, stores the returned metric data in metricsdb organized by namespace, pod, and table. Exposes a gRPC |
Aggregator (Observer) |
StatefulSet |
Pulls metric data from Receivers, executes PromQL queries for aggregation and label enrichment, and exports final metrics to an OTel collector using gRPC with mutual TLS (mTLS). Supports metric scraping from multiple components, not only TMM. |
TMM Scraper |
Sidecar container in each TMM pod |
Replaces |
High-level design
The statistics infrastructure uses a global, table-level configuration for a tenant-specific, declarative model, supported by Prometheus. Tenants declare their scraping requirements through Kubernetes CRs. The system handles scheduling, collection, aggregation, and export automatically.
Key design principles:
Namespace as tenant identity: Each tenant is identified by their Kubernetes namespace. Receivers store metrics in a namespace-based folder hierarchy, and each metric includes a namespace label for traceability.
Declarative configuration: Tenants define what they want through YAML manifests. The system handles execution.
Policy enforcement: Administrators set boundaries through ScrapeClass resources. Tenants operate freely within those boundaries.
Efficient resource usage: When multiple tenants request the same metric at different intervals, the system merges the scrape to the shortest interval and distributes results at each tenant’s requested frequency.
Data persistence: Metrics are stored in metricsdb (a Pebble-based key-value store) to ensure no data loss between restarts and to handle cumulative metrics.
Metrics Flow Architecture
This section highlights the Metrics flow architecture.
Example:
Following is an example of Metrics of the virtual server clientside.received.bytes metric example collected from OTeL.
{
  "resourceMetrics": [
    {
      "resource": {},
      "scopeMetrics": [
        {
          "scope": {
            "name": "io.f5.toda.observer",
            "version": "5.23.0"
          },
          "metrics": [
            {
              "name": "f5.virtual_server.clientside.received.bytes",
              "unit": "By",
              "sum": {
                "dataPoints": [
                  {
                    "attributes": [
                      {
                        "key": "f5.virtual_server.destination",
                        "value": {
                          "stringValue": "55.55.55.1"
                        }
                      },
                      {
                        "key": "f5.virtual_server.name",
                        "value": {
                          "stringValue": "spk-app-1-spk-app-tcp-8050-f5ing-testapp-virtual-server"
                        }
                      },
                      {
                        "key": "f5.virtual_server.source",
                        "value": {
                          "stringValue": "0.0.0.0"
                        }
                      },
                      {
                        "key": "k8s.namespace.name",
                        "value": {
                          "stringValue": "spk-app-1"
                        }
                      },
                      {
                        "key": "target.namespace",
                        "value": {
                          "stringValue": "default"
                        }
                      },
                      {
                        "key": "observer.job.mode",
                        "value": {
                          "stringValue": "aggregated"
                        }
                      }
                    ],
                    "startTimeUnixNano": "1765878400960332314",
                    "timeUnixNano": "1765878400962968310",
                    "asInt": "0"
                  }
                ],
                "aggregationTemporality": 2,
                "isMonotonic": true
              }
            }
          ]
        }
      ]
    }
  ]
}
Distributed TODA Pods Installation
For the installation of the Receiver, Observer and Coordinator (Operator), refer to the FLO section.
Metrics Export Intervals
Note
From 2.3, the Observer exports metrics to OpenTelemetry every 1 minute by default. Configuration is no longer managed via a ConfigMap; it has been replaced by the ScrapeTemplate and Scrape custom resources. Use the every field to control the export interval:
Set
everyin aScrapeTemplateto define the default interval.Set
everyin aScrapeto override the interval per job.
The default ScrapeTemplate sets the interval to 1 minute; set the every field as needed.
For more detail on configuring statistics, see Manage statistics with tenant-aware configuration
Prometheus and Grafana
For more details on Prometheus and Grafana, see Visualize metrics in Grafana.
Note
Prometheus and Grafana are not integrated with the FLO installation. They can be installed manually to view metrics.