Visualize metrics in Grafana
Overview
Observability lets you provide isolated monitoring dashboards to different tenants while using a shared infrastructure. This guide uses Prometheus and Grafana as example tools, but you can use any equivalent monitoring solution that meets your requirements.
This setup uses:
Prometheus to collect and store metrics from your F5 components
Prometheus label proxy to filter metrics by namespace at query time
Grafana to visualize metrics, with organizations isolating tenant access
System Architecture
Complete setup includes the following:
Prometheus server — stores all metrics for all tenants
Prometheus label proxy — filters metrics by the tenant label before passing them to Grafana
Node and pod metrics — collect system metrics such as CPU usage, memory, and pod restarts
Grafana — displays dashboards for each tenant
Before you begin
Before you begin to set up the system, ensure that:
Helm is installed.
cert-manager or any other certificate management solution is installed to generate TLS certificates.
Note
The OTel Collector exposes metrics over mTLS. Ensure that Prometheus is configured with a client certificate, provisioned using cert-manager, to securely scrape these metrics.
Configure Prometheus
Create a Kubernetes ConfigMap to configure the OpenTelemetry Collector to export metrics to Prometheus.
Example: resources/otel.yaml
apiVersion: v1
kind: ConfigMap
metadata:
  name: custom-otel-collector-conf
data:
  otel-collector-config.yaml: |
    exporters:
      otlp:
        endpoint: otel-test.default.svc.cluster.local:4317
        tls:
          insecure: true
        retry_on_failure:
          enabled: true
          initial_interval: 1s
          max_interval: 10s
          max_elapsed_time: 0
    service:
      pipelines:
        metrics:
          exporters: [otlp, **prometheus**]
Apply the ConfigMap to the cluster.
kubectl apply -f resources/otel.yaml
Create the Prometheus namespace.
kubectl create namespace prometheus
Create a TLS certificate for Prometheus client authentication using cert-manager.
Example: resources/prometheus-client-cert.yaml
apiVersion: cert-manager.io/v1
kind: Certificate
metadata:
  name: prometheus-client
  namespace: prometheus
spec:
  subject:
    countries:
      - US
    provinces:
      - Washington
    localities:
      - Seattle
    organizations:
      - F5 Networks
    organizationalUnits:
      - PD
    emailAddresses:
      - clientcert@f5net.com
  commonName: f5net.com
  secretName: prometheus-client-secret
  issuerRef:
    name: <ClusterIssuer or Issuer name used in cluster>
    group: cert-manager.io
    kind: ClusterIssuer
  duration: 8760h
  privateKey:
    rotationPolicy: Always
    encoding: PKCS1
    algorithm: RSA
    size: 4096
Apply the certificate resource in the Prometheus namespace.
kubectl apply -f resources/prometheus-client-cert.yaml
Create a custom Helm values file.
Example: resources/prom-values.yaml
prometheus-pushgateway:
  enabled: false

# This example shows minimal Prometheus values. You can add as needed.
# Required for dashboards: node-exporter, kube-state-metrics (node and pod/container metrics) and the scrape jobs.

prometheus-node-exporter:
  enabled: true

kube-state-metrics:
  enabled: true

alertmanager:
  enabled: false

serverFiles:
  prometheus.yml:
    scrape_configs:
    # F5 metrics from the OpenTelemetry Collector (mTLS).
      - job_name: bnk-otel
        scheme: https
        static_configs:
          - targets:
              - otel-collector-svc.f5-utils.svc.cluster.local:9090
        tls_config:
          cert_file: /etc/prometheus/certs/tls.crt
          key_file: /etc/prometheus/certs/tls.key
          ca_file: /etc/prometheus/certs/ca.crt
          insecure_skip_verify: false
      - job_name: "node-exporter"
      # Node-level metrics (CPU, memory, network).
        kubernetes_sd_configs:
          - role: pod
        relabel_configs:
          - source_labels: [__meta_kubernetes_pod_label_app_kubernetes_io_name]
            action: keep
            regex: prometheus-node-exporter
          - source_labels: [__meta_kubernetes_pod_node_name]
            target_label: instance
          - source_labels: [__address__]
            target_label: __address__
            regex: ([^:]+)(?::\d+)?
            replacement: ${1}:9100
      - job_name: "kubernetes-cadvisor"
      # Container metrics via the kubelet cAdvisor endpoint.
        scheme: https
        tls_config:
          ca_file: /var/run/secrets/kubernetes.io/serviceaccount/ca.crt
        bearer_token_file: /var/run/secrets/kubernetes.io/serviceaccount/token
        kubernetes_sd_configs:
          - role: node
        relabel_configs:
          - action: labelmap
            regex: __meta_kubernetes_node_label_(.+)
          - target_label: __address__
            replacement: kubernetes.default.svc:443
          - source_labels: [__meta_kubernetes_node_name]
            regex: (.+)
            target_label: __metrics_path__
            replacement: /api/v1/nodes/${1}/proxy/metrics/cadvisor
      - job_name: "kube-state-metrics"
      # Pod/container status metrics for the pod dashboard.
        kubernetes_sd_configs:
          - role: endpoints
        relabel_configs:
          # Match the Service by name (prometheus subchart names it prometheus-kube-state-metrics)
          - source_labels: [__meta_kubernetes_service_name]
            action: keep
            regex: (prometheus-)?kube-state-metrics
server:
  retentionSize: 1GB
  # Mount the mTLS client cert used by the bnk-otel scrape job.
  extraVolumes:
    - name: prometheus-tls
      secret:
        secretName: prometheus-client-secret
  extraVolumeMounts:
    - name: prometheus-tls
      mountPath: /etc/prometheus/certs
      readOnly: true
  # Optional: uncomment NodePort to access Prometheus without port-forward.
  # service:
  #   type: NodePort
  #   nodePort: 30909

  # Optional tuning.
  global:
    scrape_interval: 10s
  persistentVolume:
    enabled: false # Enable for persistent metric storage.
This configuration deploys Prometheus with selected exporters enabled and defines secure scrape jobs for Kubernetes and OpenTelemetry metrics, using TLS certificates mounted from a Kubernetes Secret.
Add and update the Prometheus Helm repository.
helm repo add prometheus-community https://prometheus-community.github.io/helm-charts
helm repo update
Install Prometheus using the custom values file.
Install in prometheus namespace
helm upgrade --install prometheus prometheus-community/prometheus \
  -n prometheus \
  -f resources/prom-values.yaml
Verify the Prometheus installation
Check that the pods are running.
kubectl get pods -n prometheus
(Optional) Forward the Prometheus server port to your local machine.
kubectl -n prometheus port-forward svc/prometheus-server 9595:80
Verify that the
bnk-otelscrape target is healthy.curl -s 'http://localhost:9595/api/v1/targets' | jq '.data.activeTargets[] | {scrapePool: .scrapePool, health: .health, scrapeUrl: .scrapeUrl}'
Expected output:
{
"scrapePool": "bnk-otel",
"health": "up",
"scrapeUrl": "https://otel-collector-svc.f5-utils.svc.cluster.local:9090/metrics"
}
{
  "scrapePool": "kube-state-metrics",
  "health": "up",
  "scrapeUrl": "http://10.244.114.45:8080/metrics"
}
{
  "scrapePool": "kubernetes-cadvisor",
  "health": "up",
  "scrapeUrl": "https://kubernetes.default.svc:443/api/v1/nodes/datkube-control-plane/proxy/metrics/cadvisor"
}
Confirm that the
k8s_namespace_namelabel is present in metrics.curl -s 'http://localhost:9595/api/v1/label/k8s_namespace_name/values' | jq .
Expected output:
{
  "status": "success",
  "data": [
    "default",
    "f5-utils",
    "spk-app-1",
    "spk-app-2"
  ]
}
Sample queries
curl -s -G ‘http://localhost:9595/api/v1/query’ –data-urlencode ‘query=up{job=”bnk-otel”}’ | jq .data.result
curl -s ‘http://localhost:9595/api/v1/query?query=f5_tmm_dropped_total’ | jq .data.result
Install Prometheus label proxy
Add the Helm repo and update.
helm repo add prometheus-community https://prometheus-community.github.io/helm-charts
helm repo update
Create a custom values file.
Example: resources/prom-label-proxy-values.yaml
config:
 upstream: "http://prometheus-server.prometheus.svc.cluster.local:80"
 label: "k8s_namespace_name"
 extraArgs:
   - "--enable-label-apis=true"
   - "--error-on-replace=true"
   - "--header-name=X-Namespace"
   - "--header-uses-list-syntax"

service:
  type: ClusterIP
  port: 9090
This configuration sets up a proxy service that forwards requests to Prometheus and filters metrics based on Kubernetes namespaces by using HTTP headers.
Install the Prometheus label proxy in the Prometheus namespace.
helm upgrade --install prom-label-proxy prometheus-community/prom-label-proxy \
 -n prometheus \
 -f resources/prom-label-proxy-values.yaml
Verify the Prometheus label proxy installation
Check that the pod is running.
kubectl get pods -n prometheus
(Optional) Forward the proxy port to your local machine, using nodeIP if exposed.
kubectl -n prometheus port-forward svc/prom-label-proxy 9090:9090
Use
curlto test if proxy is reachable in the namespace.curl -s -H "X-Namespace: spk-app-1" 'http://localhost:9090/api/v1/label/k8s_namespace_name/values' | jq .
Expected output:
{
  "status": "success",
  "data": [
    "spk-app-1"
  ]
}
Sample queries:
curl -s -H "X-Namespace: spk-app-1" -G 'http://localhost:9090/api/v1/query' --data-urlencode 'query={job="bnk-otel"}' | jq .

curl -s -H "X-Namespace: spk-app-1" -G 'http://localhost:9090/api/v1/query' --data-urlencode 'query=f5_pool_member_connq_age_edm_total{job="bnk-otel"}' | jq .
Configure Grafana
Grafana provides the visualization layer for your observability setup. You can install Grafana with a default admin datasource, then provision tenant-specific organizations, users, datasources, and dashboards.
Create a Kubernetes manifest to deploy Grafana with a ConfigMap for datasource provisioning.
The Grafana manifest (example:
resources/grafana-manifest.yaml) creates three resources:ConfigMap (grafana-datasources) — Provisions a default admin datasource named
prometheusthat points directly to the Prometheus server.Service — Exposes Grafana through a Kubernetes
NodePorton port30082.Deployment — Runs the Grafana container with persistent datasource provisioning.
Example: resources/grafana-manifest.yaml
apiVersion: v1
kind: ConfigMap
metadata:
  name: grafana-datasources
data:
  datasources.yaml: |-
    {
      "apiVersion": 1,
      "datasources": [
        {
          "name": "prometheus",
          "type": "prometheus",
          "url": "http://prometheus-server.prometheus.svc",
          "access": "proxy",
          "editable": true,
          "orgId": 1,
          "isDefault": true,
          "version": 1
        }
      ]
    }
---
apiVersion: v1
kind: Service
metadata:
  name: grafana
  annotations:
    prometheus.io/scrape: "true"
    prometheus.io/port: "3000"
spec:
  selector:
    app: grafana
  type: NodePort
  ports:
    - port: 3000
      targetPort: 3000
      nodePort: 30082 # optional: specify a node port to access Grafana externally
---
apiVersion: apps/v1
kind: Deployment
metadata:
  name: grafana
spec:
  replicas: 1
  selector:
    matchLabels:
      app: grafana
  template:
    metadata:
      name: grafana
      labels:
        app: grafana
    spec:
      containers:
        - name: grafana
          image: grafana/grafana
          ports:
            - name: grafana
              containerPort: 3000
          resources:
            limits:
              memory: "1Gi"
              cpu: "1000m"
            requests:
              memory: 500M
              cpu: "200m"
          volumeMounts:
            - mountPath: /var/lib/grafana
              name: grafana-storage
            - mountPath: /etc/grafana/provisioning/datasources
              name: grafana-datasources
              readOnly: true
      volumes:
        - name: grafana-storage
          emptyDir: {}
        - name: grafana-datasources
          configMap:
            defaultMode: 420
            name: grafana-datasources
Apply the Grafana manifest to your cluster.
kubectl apply -f resources/grafana-manifest.yaml
Verify that the Grafana pod is running and the service is created.
kubectl get pods,svc -l app=grafana
Note
Confirm that the Grafana pod status shows
Runningand the service listsNodePort 30082.
Grafana tenant setup
Using Grafana UI you can,
Create organization.
Create users in that organization.
Change user roles to viewer.
Add tenant datasources pointing to prom label proxy.
Import the sample dashboards
To import a dashboard, follow these steps:
Log in to Grafana.
Click
Dashboardsin the primary menu.Click New and select Import dashboard in the drop-down menu.
Perform one of the following steps:
Upload a dashboard JSON file.
Paste dashboard JSON text directly into the text area.
1.(Optional) Change the dashboard name, folder, or UID, and specify metric prefixes, if the dashboard uses any.
Select a data source, if required.
Click Import.
F5 dashboards
TMM dashboard
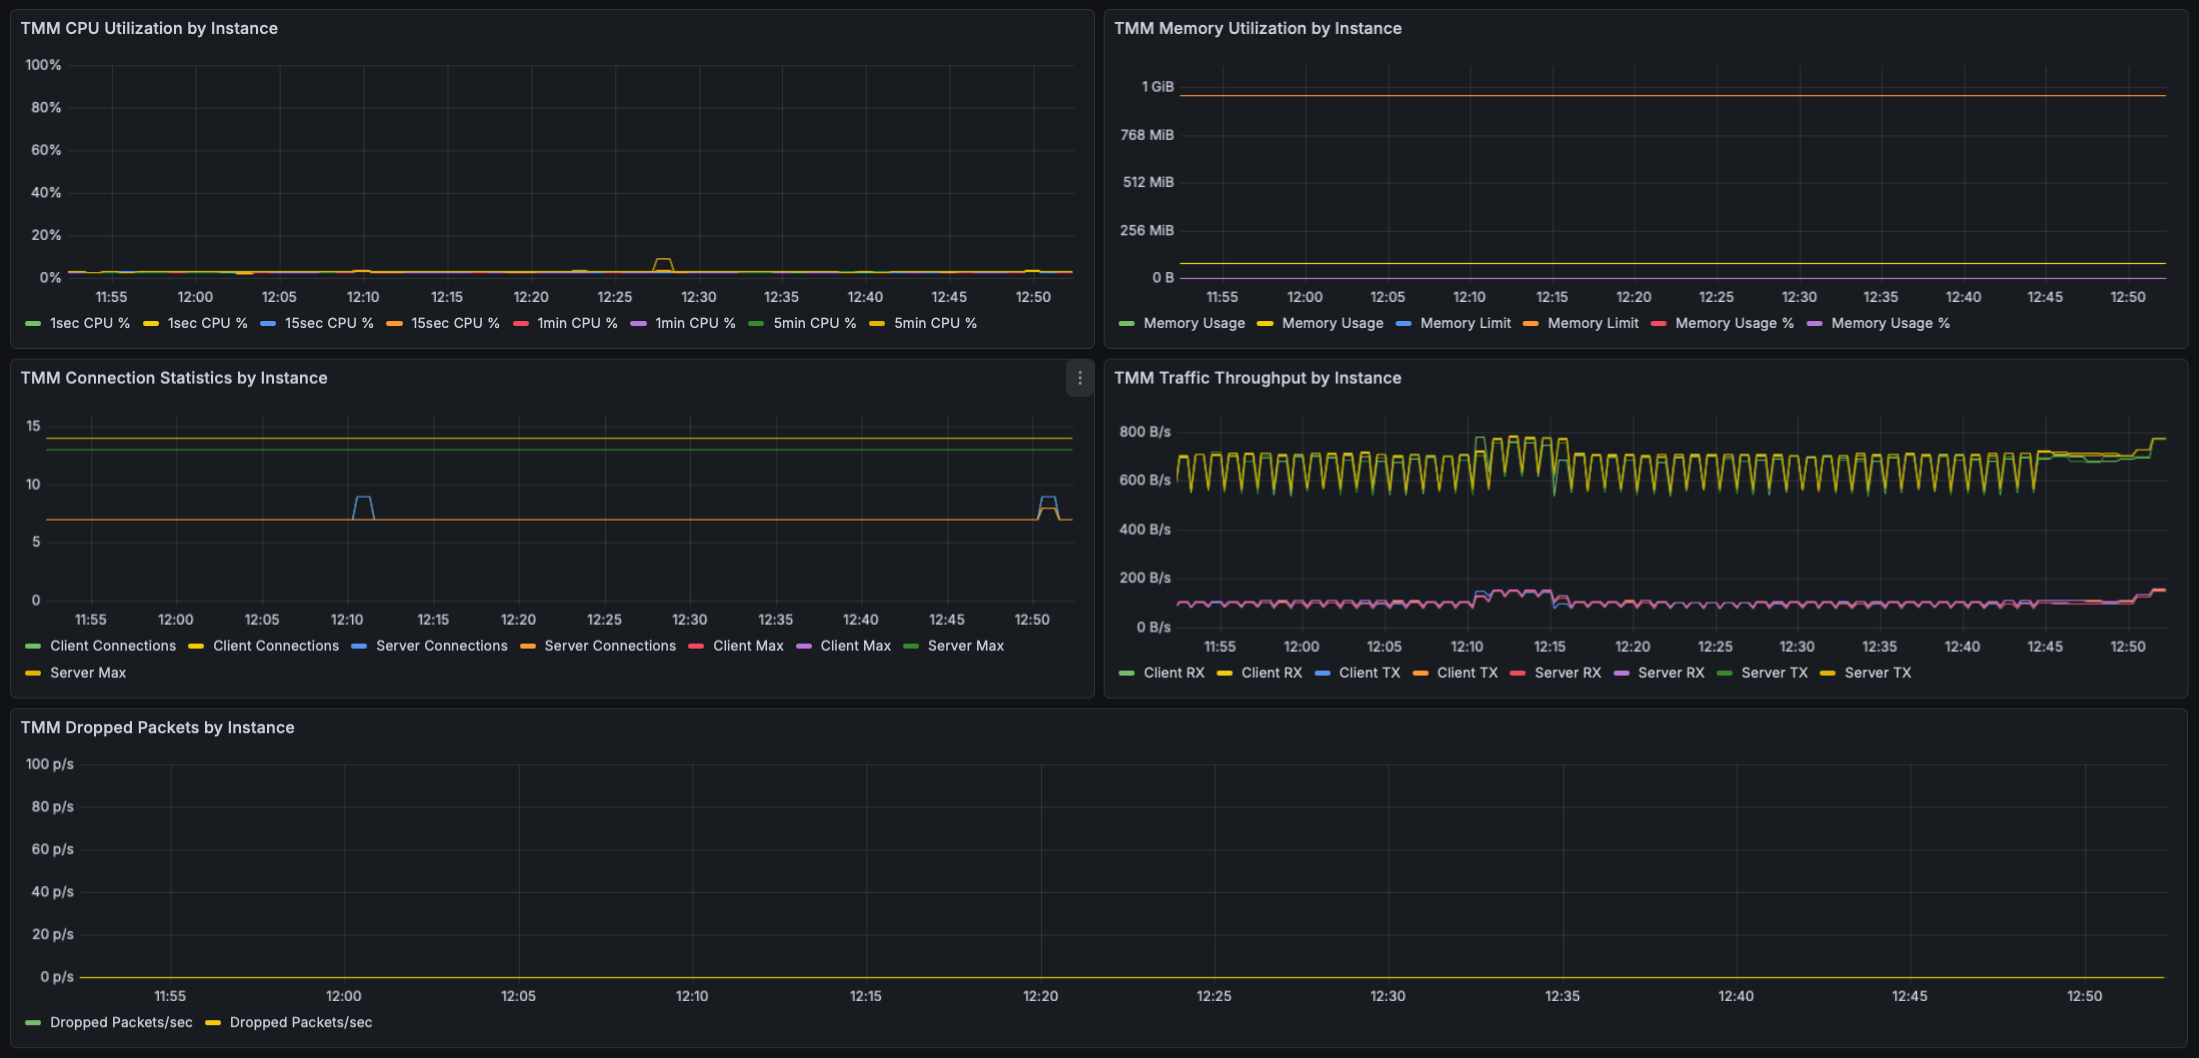
The Traffic Management Microkernel (TMM) dashboard displays key performance metrics.
CPU utilization by instance — Shows processor usage across TMM instances at various intervals (one second, 15 seconds, one minute, five minutes)
Memory utilization by instance — Displays memory usage and limits per instance
Connection statistics by instance — Tracks client and server connections with maximum thresholds
Traffic throughput by instance — Monitors receive and transmit rates for client and server traffic
Dropped packets by instance — Identifies packet loss rates
You can download the TMM dashboard JSON file here.
Sample display of the TMM dashboard:
Tenant dashboard
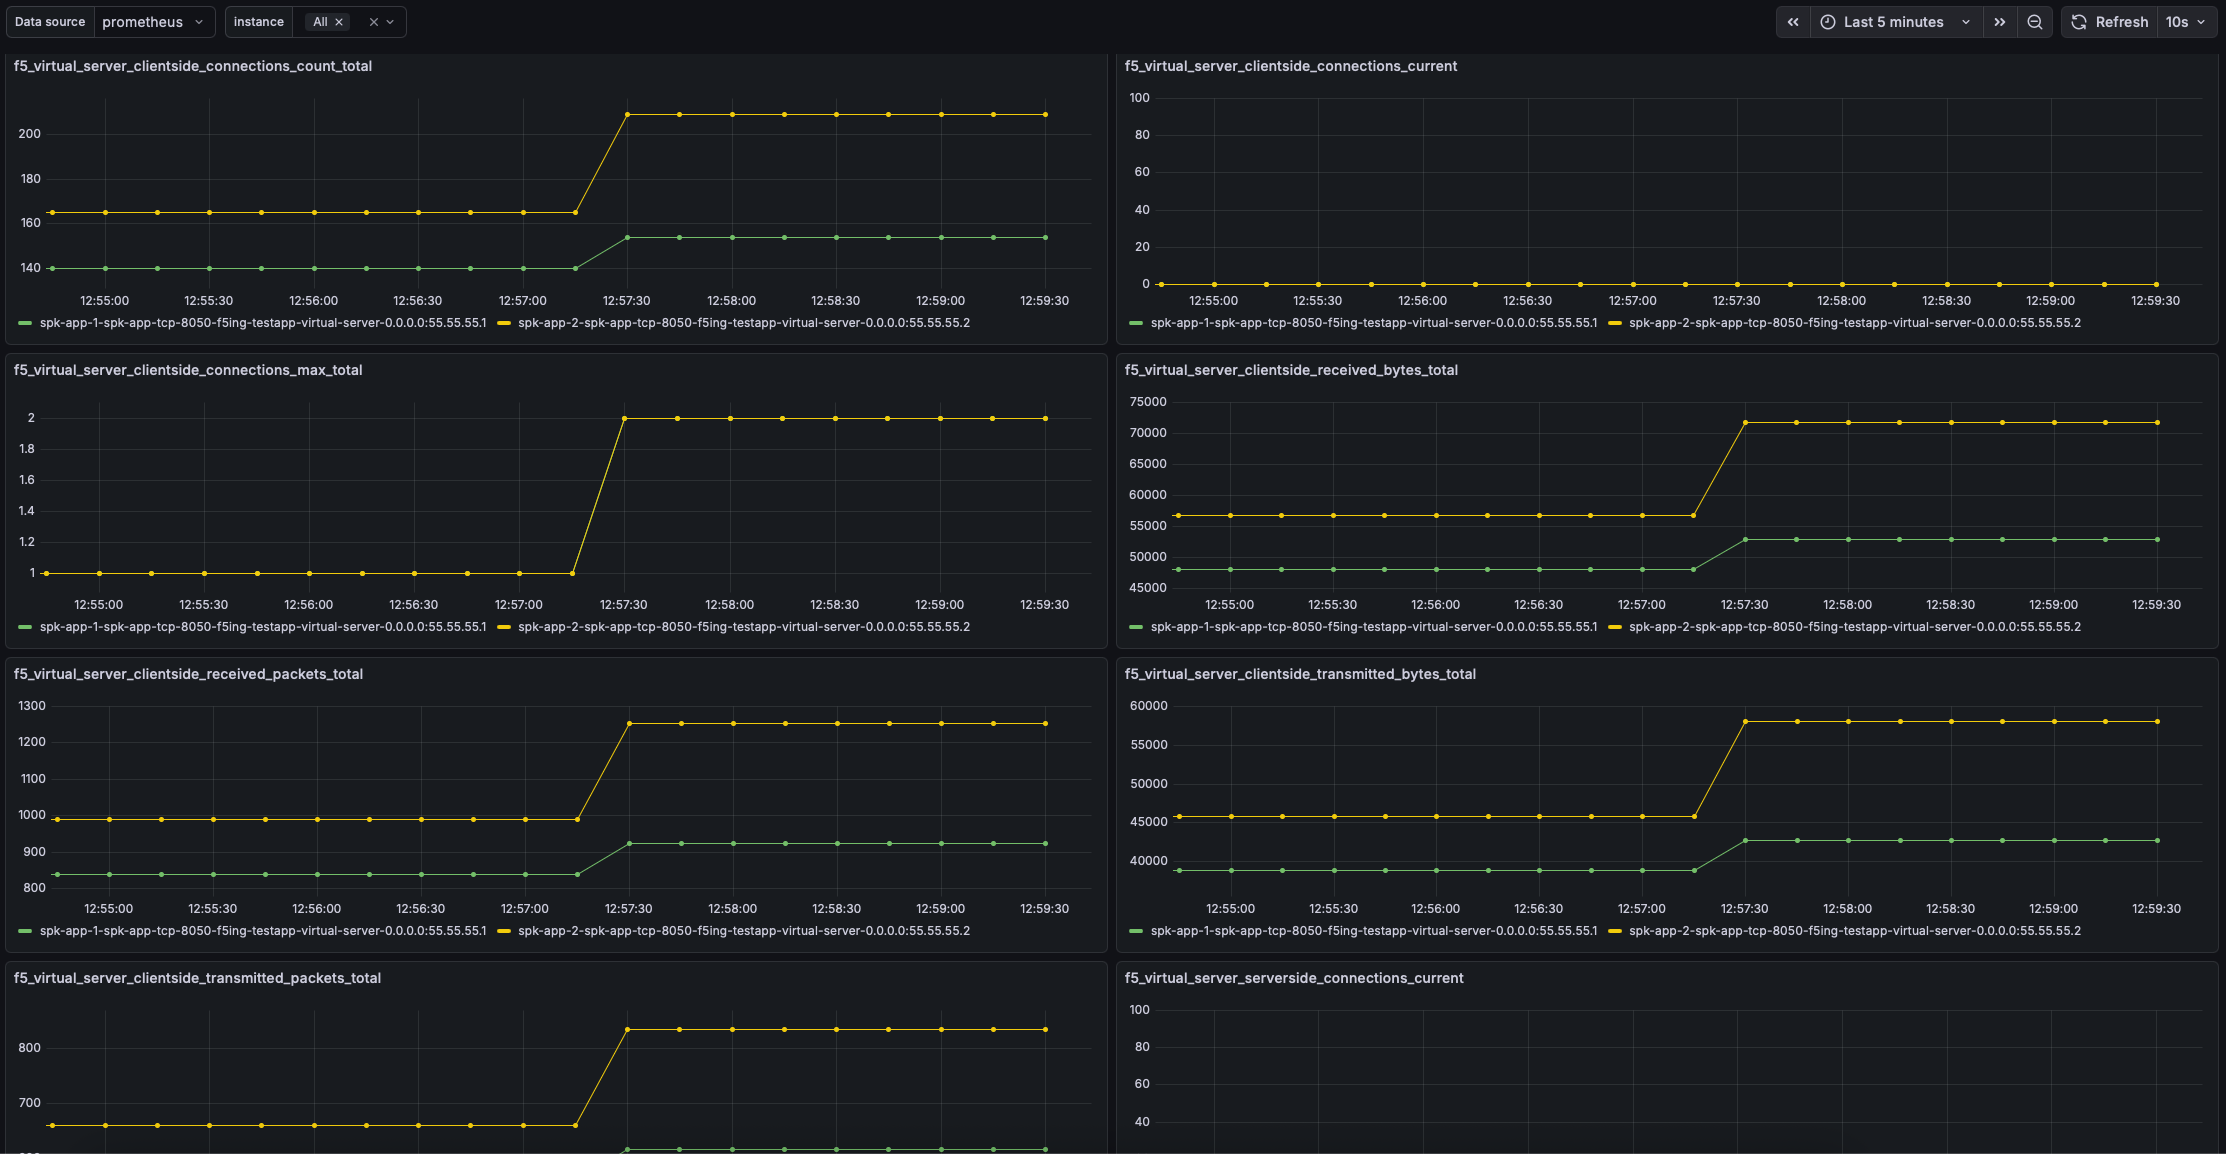
The tenant-specific dashboard shows virtual server metrics filtered by namespace:
Client-side connection counts and current connections
Maximum client-side connections
Bytes and packets received and transmitted
Server-side connection statistics
You can download the tenant dashboard JSON file here.
Sample display of the tenant dashboard:
Example 3: Pod dashboard
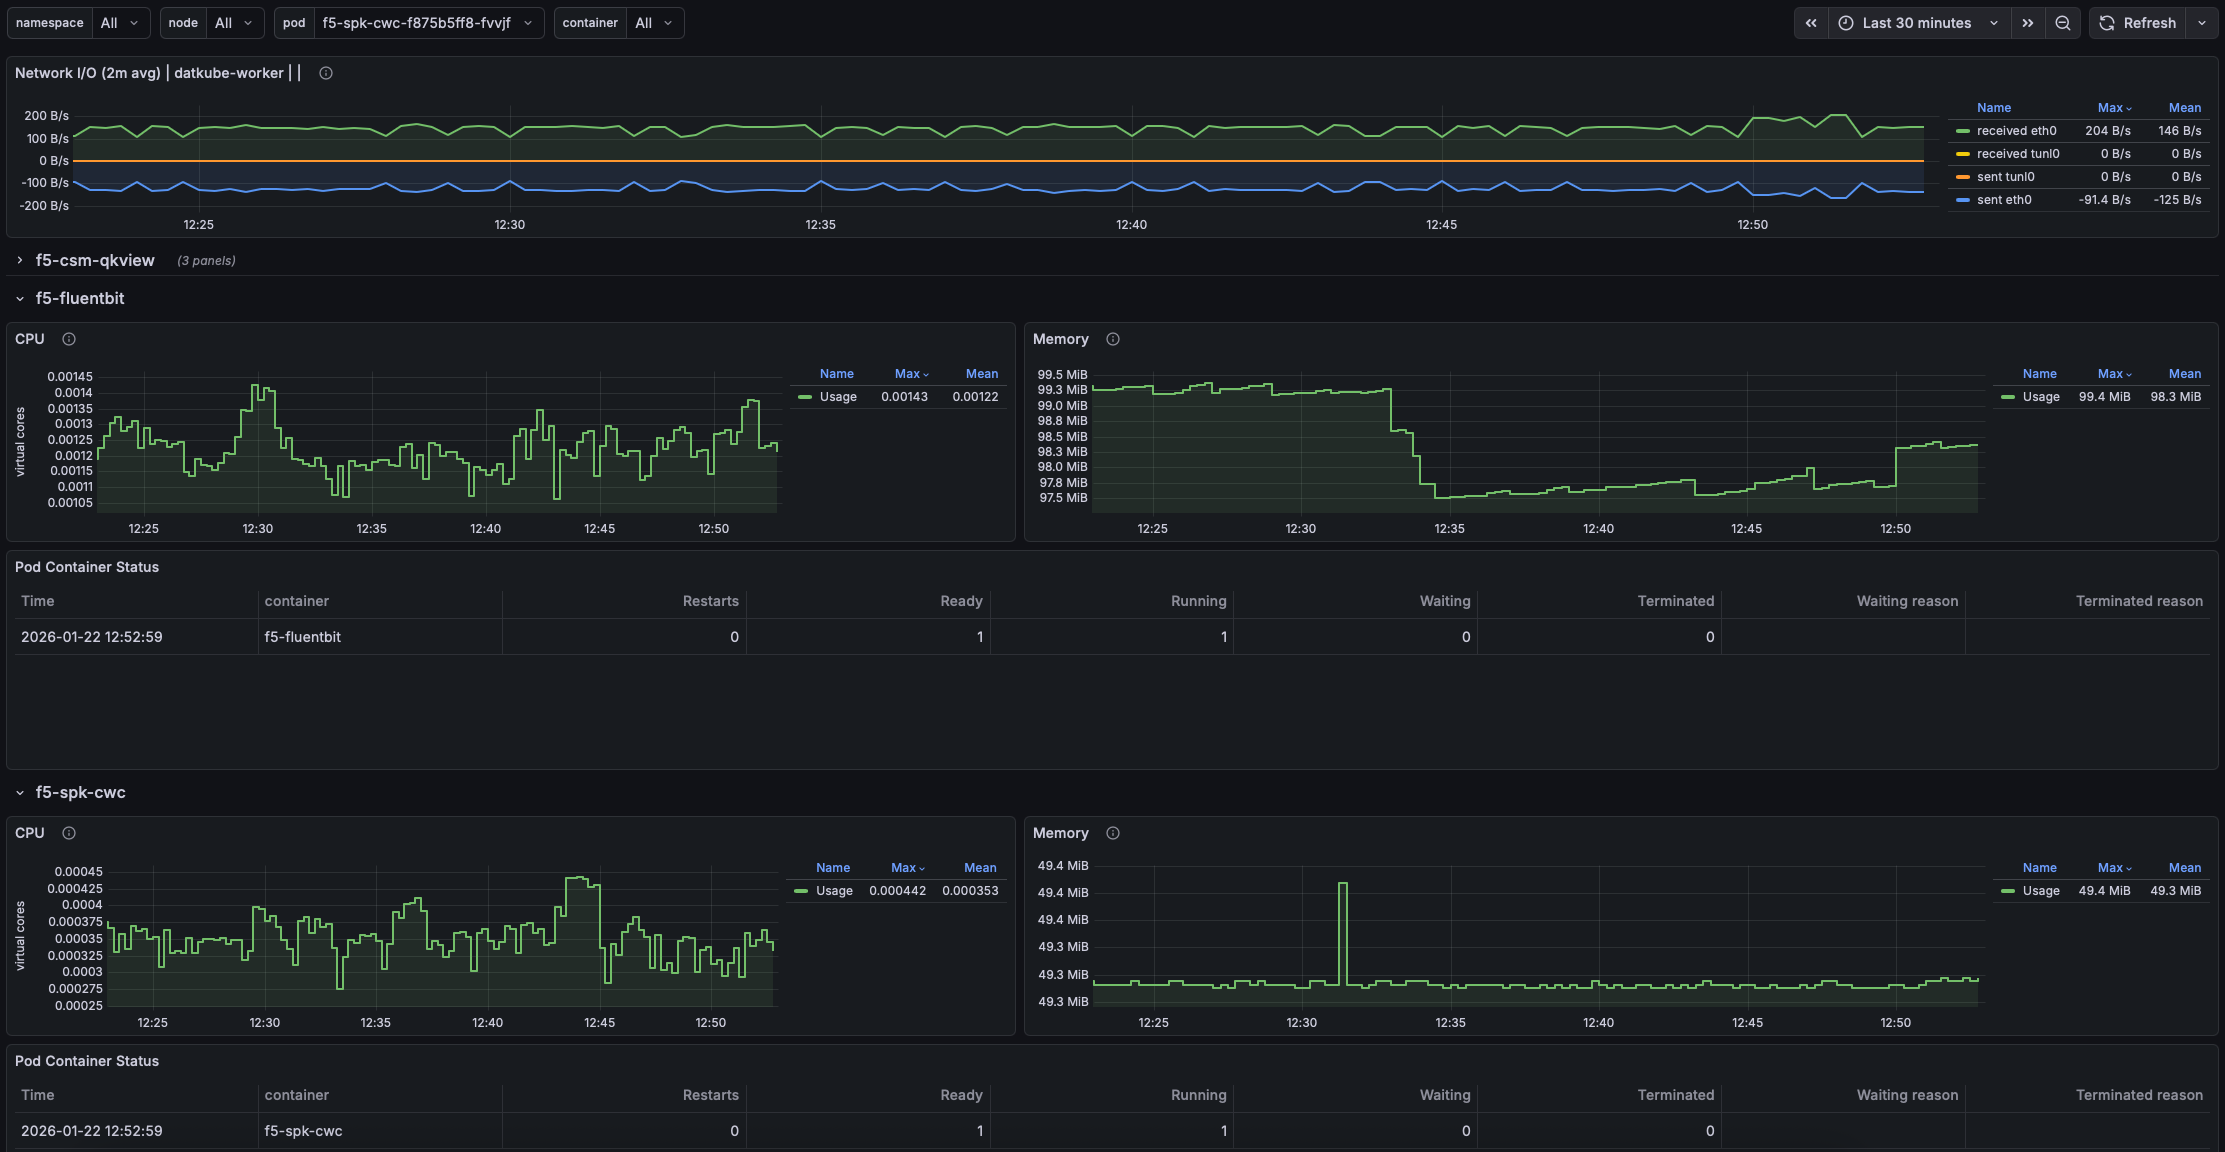
The pod dashboard provides container-level visibility:
Network I/O rates by node
CPU and memory usage per container
Pod container status including restarts, ready state, and running state
You can download the pod dashboard JSON file here.
Sample display of the pod dashboard:
Validate and troubleshoot the setup
Prometheus
Check |
Command or action |
|---|---|
Verify scrape targets are healthy |
|
Confirm namespace labels exist |
|
Test a sample query |
|
Prometheus label proxy
Check |
Command or action |
|---|---|
Verify namespace filtering |
|
Check label filtering |
|
If queries are rejected, verify that:
The
X-Namespaceheader is present in the requestThe error-on-replace behavior is configured correctly
Grafana
Check |
Action |
|---|---|
Test datasource connectivity |
Go to Connections > Data sources, select a datasource, and select Save & test |
Verify dashboard filtering |
Open a dashboard using a tenant datasource and confirm only the correct namespace data appears |
Common issues
Issue |
Solution |
|---|---|
Datasource name or UID mismatch |
Verify datasource names match between dashboard JSON and Grafana configuration |
Missing namespace labels |
Check that the OpenTelemetry Collector includes |
Proxy header not set |
Confirm tenant datasources include the |
User or organization permissions not applied |
Verify user assignments in Administration > Organizations |