F5 BIG-IQ Centralized Management Lab > BIG-IQ All Labs > Class 9: BIG-IQ Access Policy Manager > Module 1: APM access and per-request policies Source | Edit on
Lab 1.4: View APM Audit logs and Dashboards
Note
Estimated time to complete: 25 minutes
In this workflow the Student will learn how to navigate through and use the BIG-IQ Centralized Management Access Monitoring tools to understand how they can benefit an Administrators day to day Access tasks and also how it can help with troubleshooting Access related issues.
Lab environment access
If you have not yet visited the page Getting Started, please do so.
Tasks
- Navigate to Monitoring Audit Logs Access
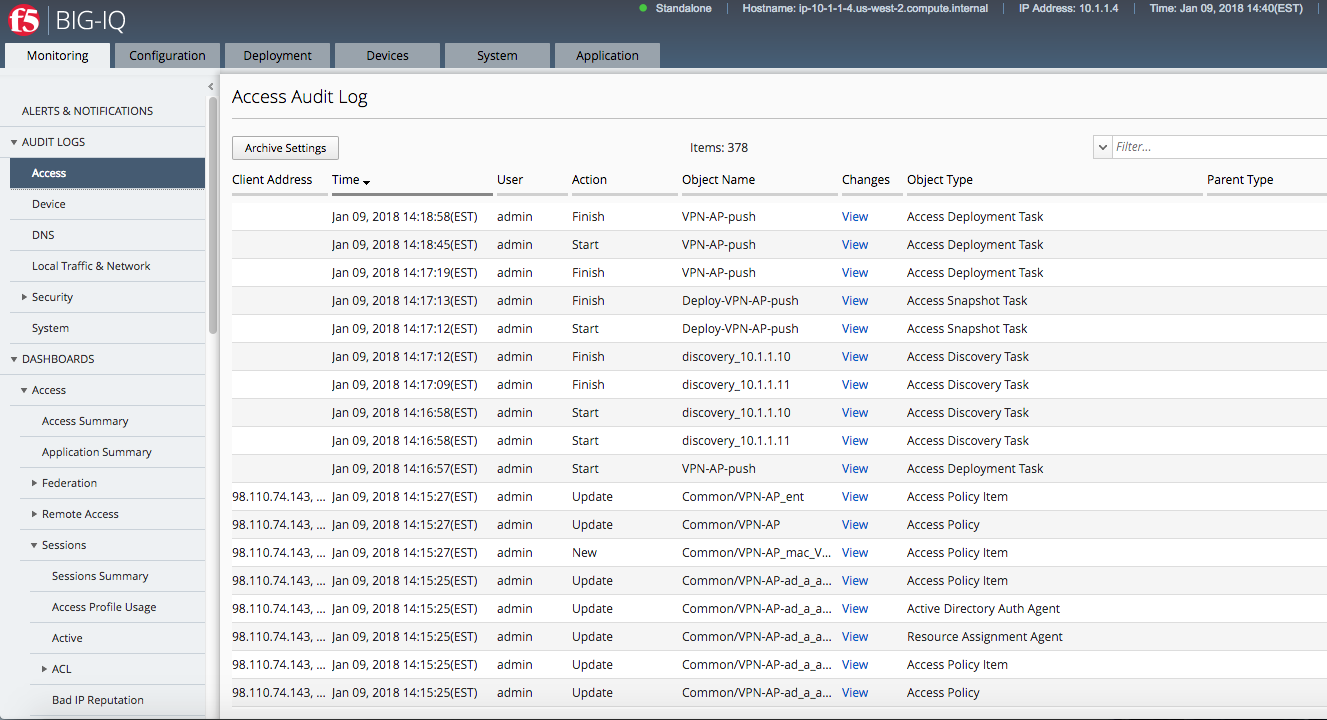
Note: In case you do not have any data in BIG-IQ, check the active session in Access tab in BIG-IP Boston Active cluster. If the session shows pending (blue), restart the apmd process on the BIG-IP (bigstart restart apmd).
We will now walk through several different Dashboards available under the Access portion of BIG-IQ. During this exercise we will bring attention to several key areas of interest for Adminstrators.
Start by following along the separate menu paths below to each sub-menu section for Access Dashboards:
Navigate to Monitoring Dashboards Access
View Access Summary
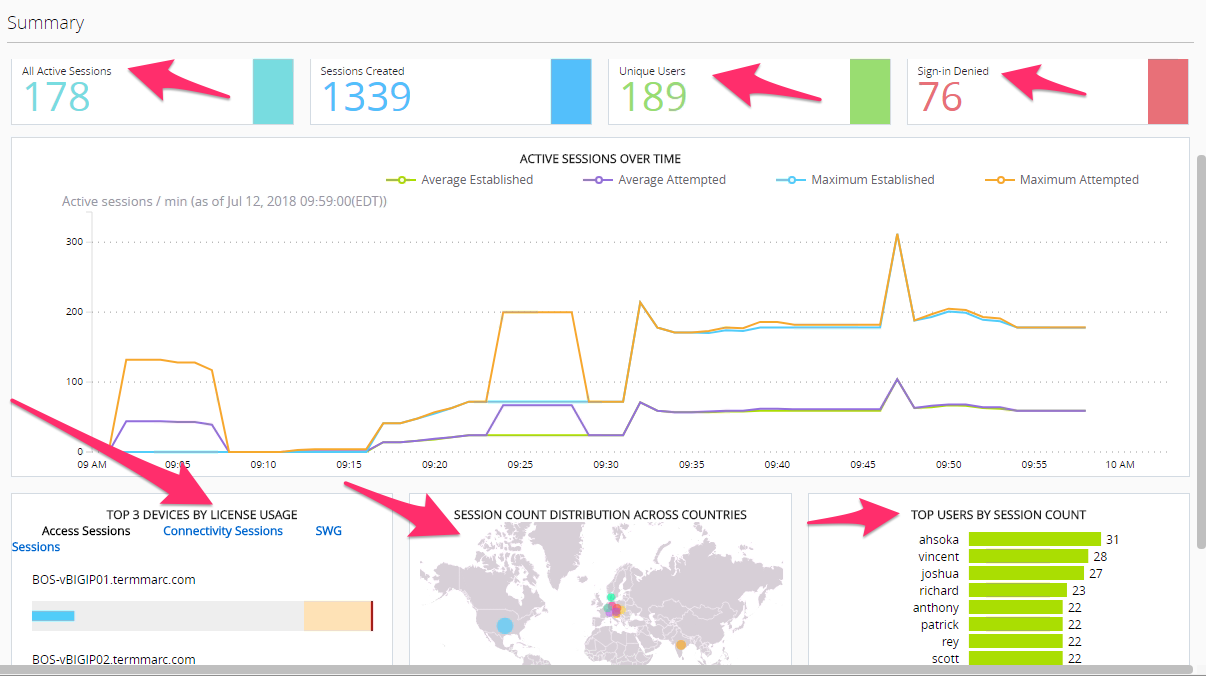
Notice the layout provides a great overview of usage of the entire Access infrastructure of devices which are currently under management with BIG-IQ. This single page view provide a quick snapshot view of license usage, Geographic access usage, top users, Session counts and Denied Sign-Ins. There is a time slider at the top of the page allowing the Admin to apply constraints of the time period for which the graphs and session counts should display. Take notice of the current Session counts and Sign-In Denied count, then adjust the left time slider moving it to the right slightly. Then adjust the right slider moving it to the left slightly. You will notice the session counts have changed. Now notice from this point an Admin could quickly drill down into certain areas of interest for troubleshooting. Click on the Sign-in Denied number to review further details. On the lower portion of this page you will find a list of denied sessions. You can see the duration of the session for the given user along with the username, client ip, and in this example IP-Reputation matched that prevented access for many of the sessions.
Application Summary
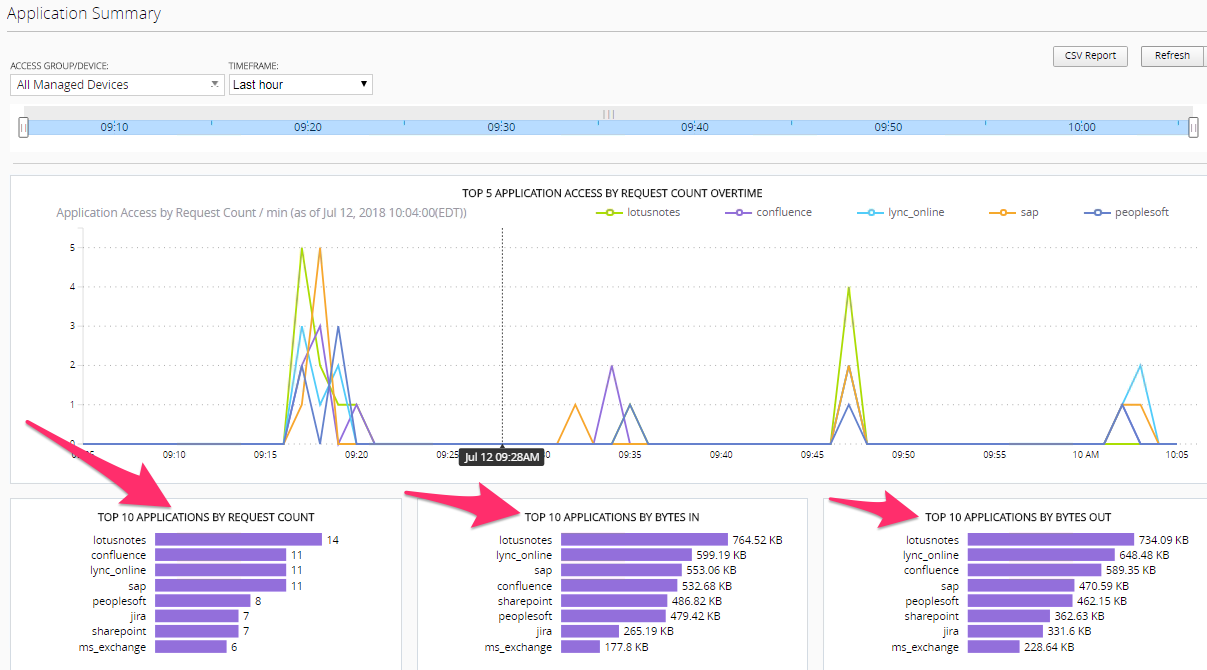
On the Application Summary screen we can see useage request for Top 10 apps along with Bytes In/Out details and number of Unique Users per application. By clicking on an application name like Confluence we can drill down to the details for that specific application.
Federation -> SAML ->SP -> SP Summary
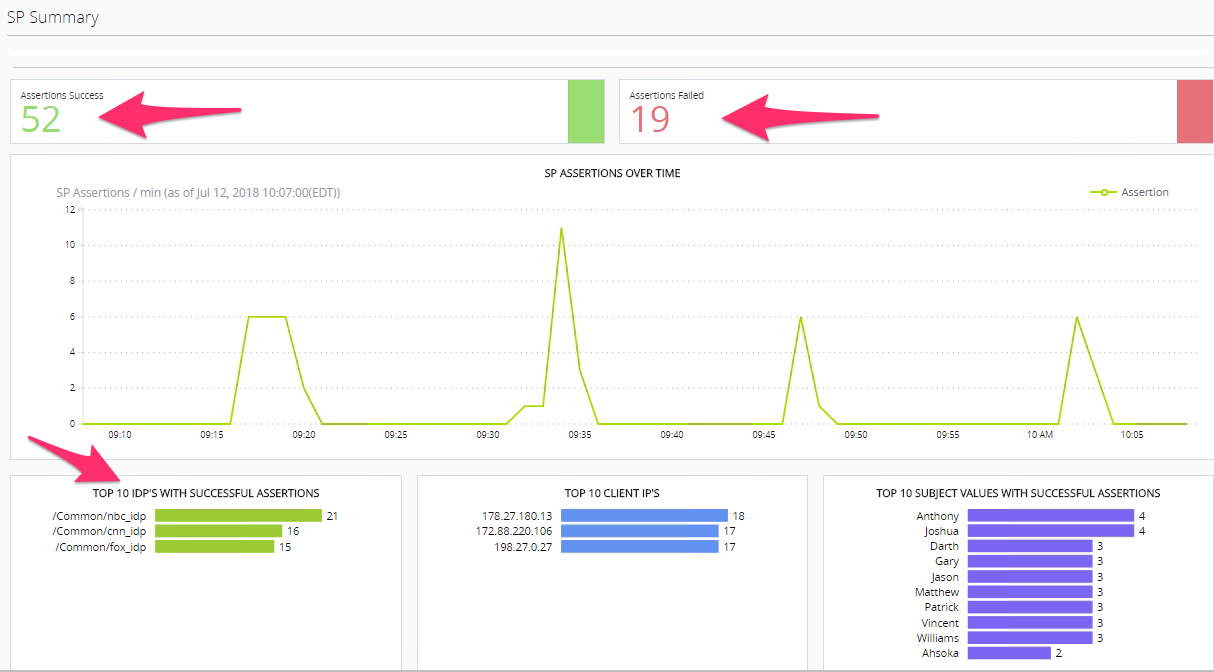
Federation is being used more widely these days. The BIG-IP Access Policy Manager can perform both SAML Service Provider as well as Identity Provider functions. In this summary screen we see the Federated Assertions for foreign Identity Providers for Services (Applications) hosted from the Access Policy Managers in the organization.
Once again an Admin can use this screen to start diagnosing issues like Failed Assertions by clicking the lines in that section for drill down details.
Federation -> SAML ->IdP -> IdP Summary
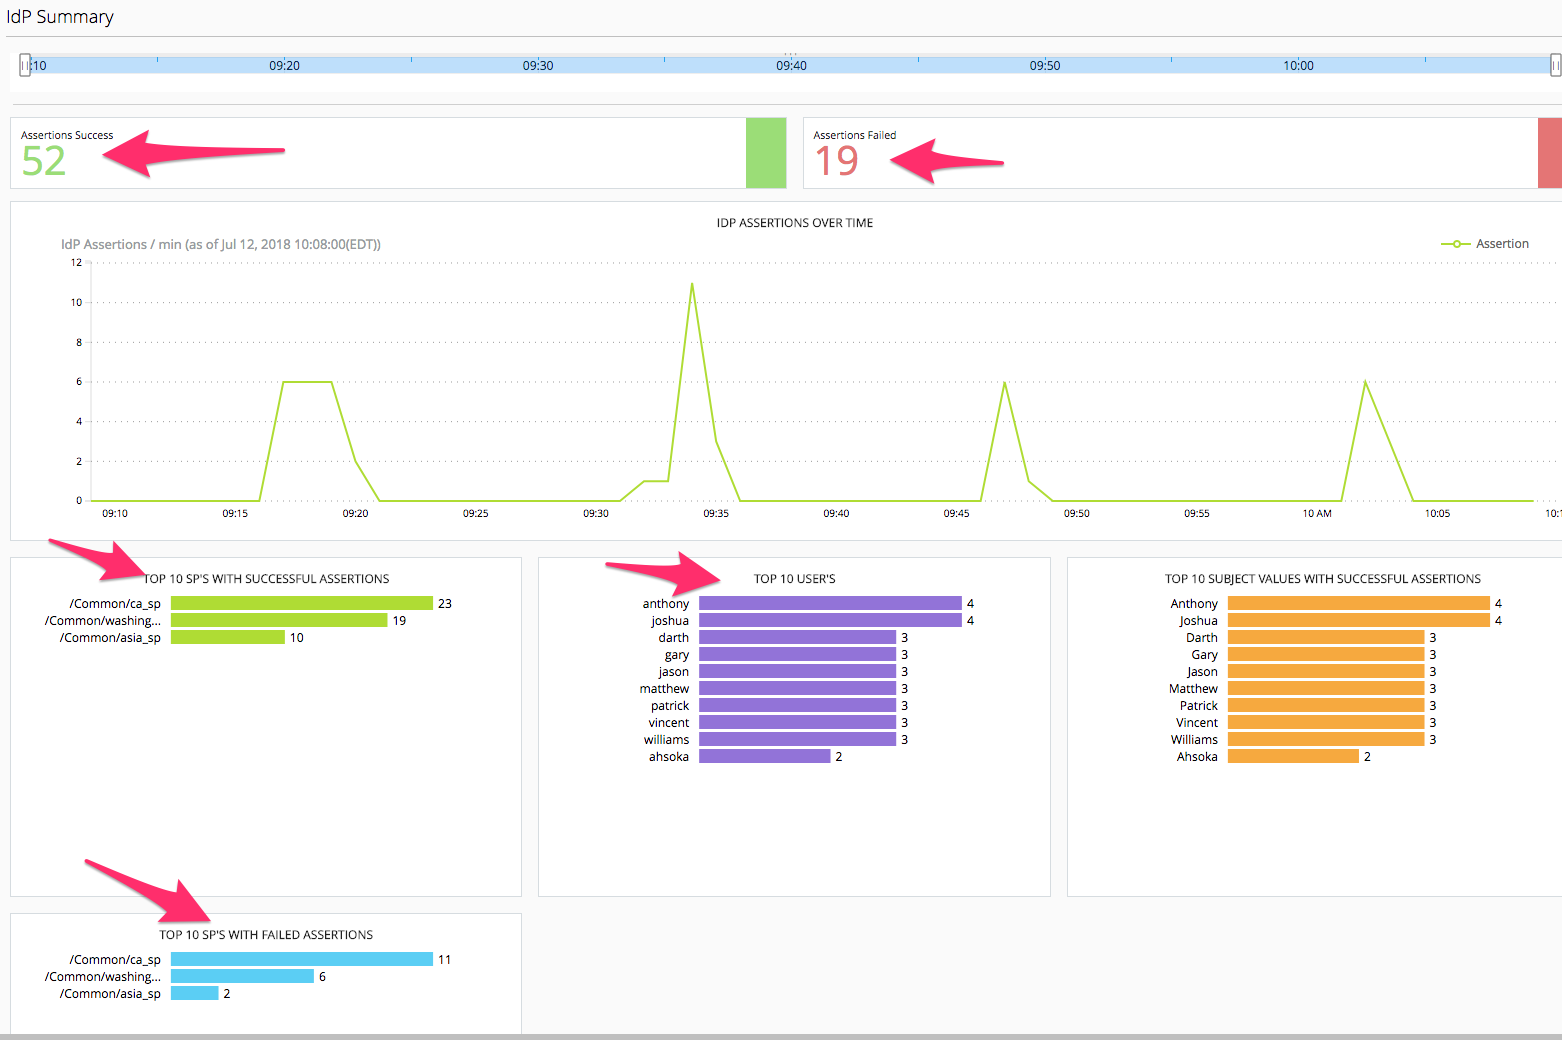
In the IdP Summary screen we see when the BIG-IP Access Policy Manager is acting as the Identity Provider and providing assertions to external Service Provider hosted applications. Same drill down/troubleshooting benefits can be found here for the Administrators of the Access environment.
Remote Access -> Network Access -> Network Access Summary
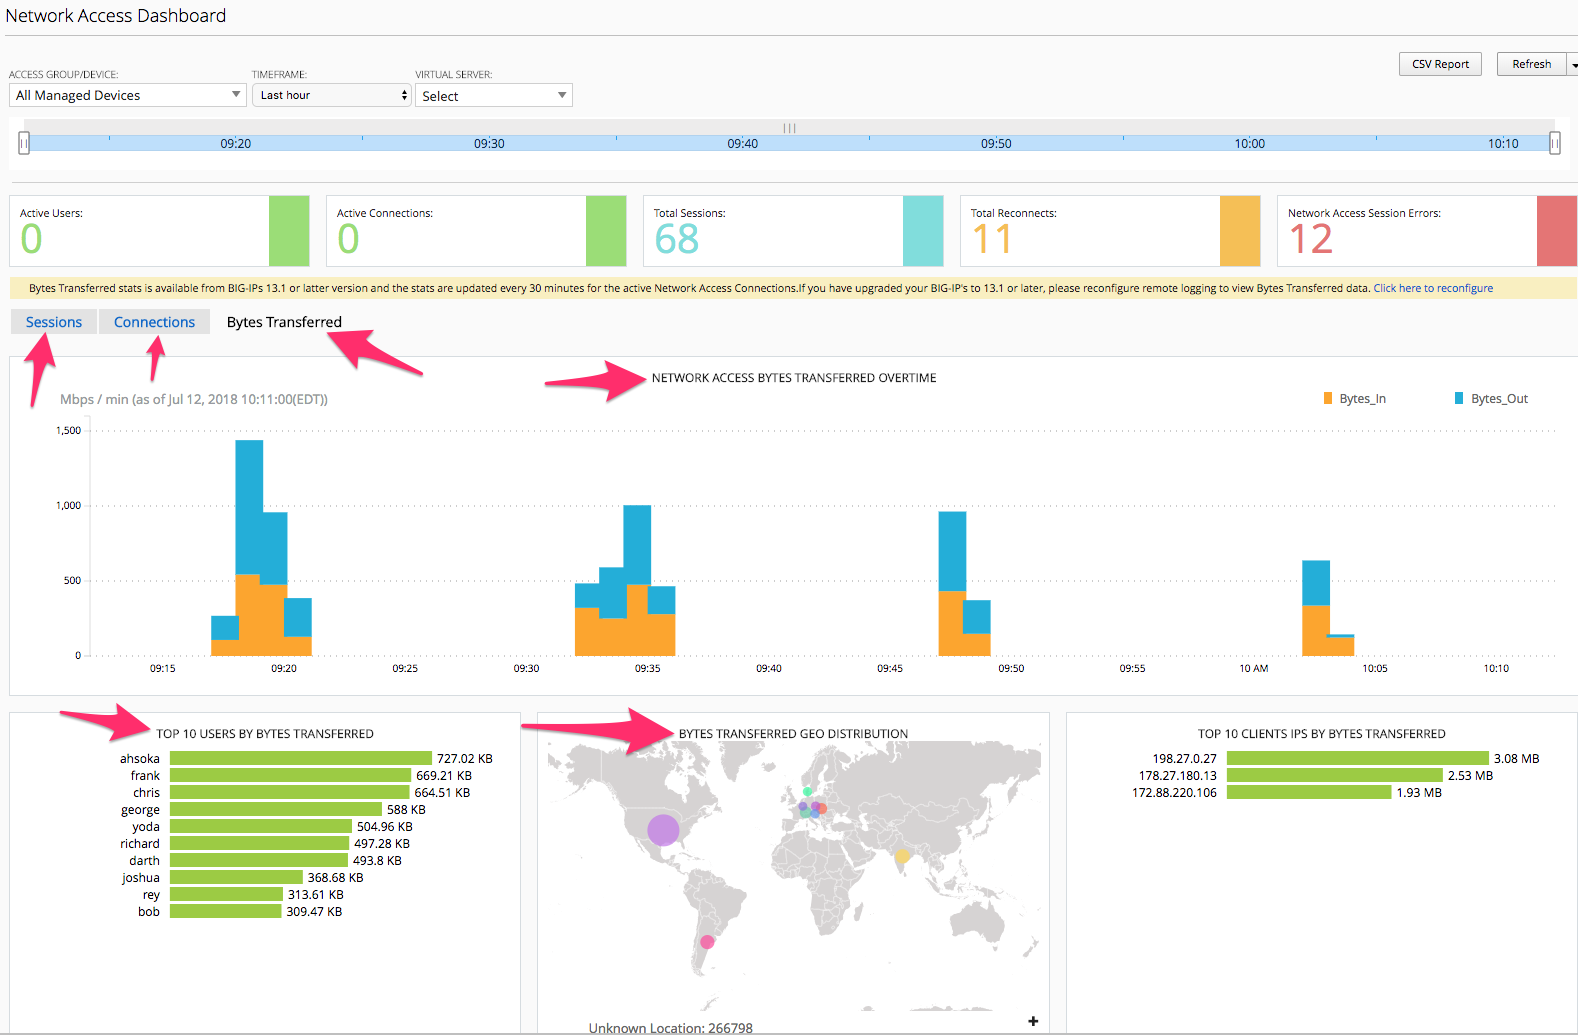
In the Network Access Summary screen you will notice something new between the user counts number at top and the graph below them. There are three TABS, Sessions, Connections, Bytes Transferred. You will currently be selected/presented with the Sessions Tab information. Click the Connections tab and review. Now click the Bytes Transferred tab. As of version 13.1 TMOS code that runs on the BIG-IPs the BIG-IQ 5.4 can display these details for reporting and troubleshooting and capacity usage and planning.
Remote Access -> Network Access -> Network Access Usage
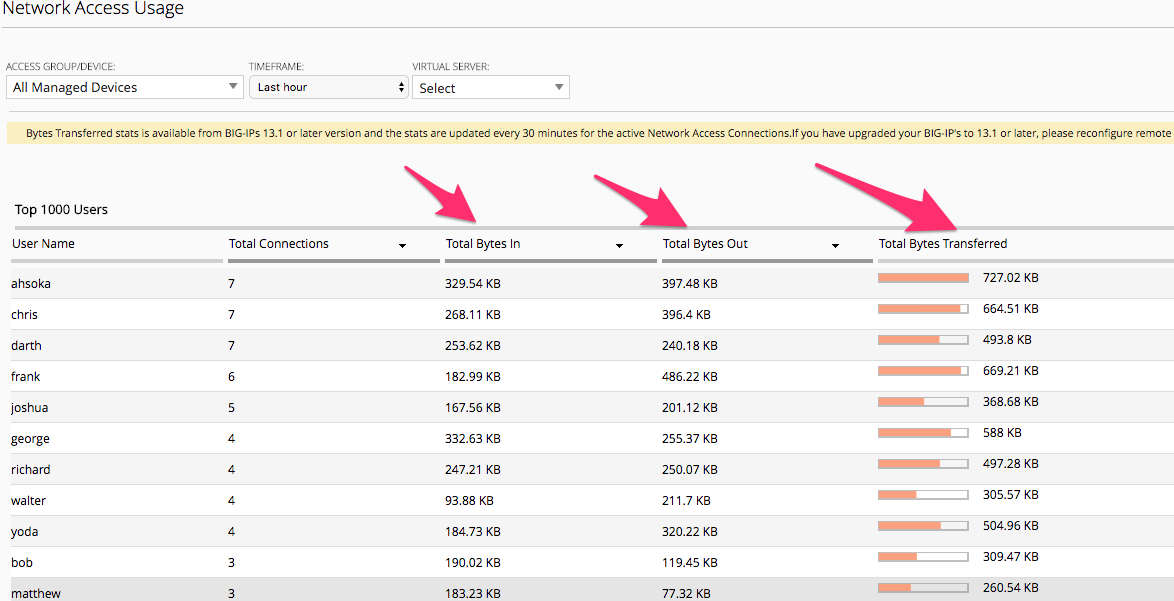
This screen again is providing more detailed reporting of the Bytes In/Out/Transferred by given users for the Admin to utilize.
Remote Access -> VDI Summary
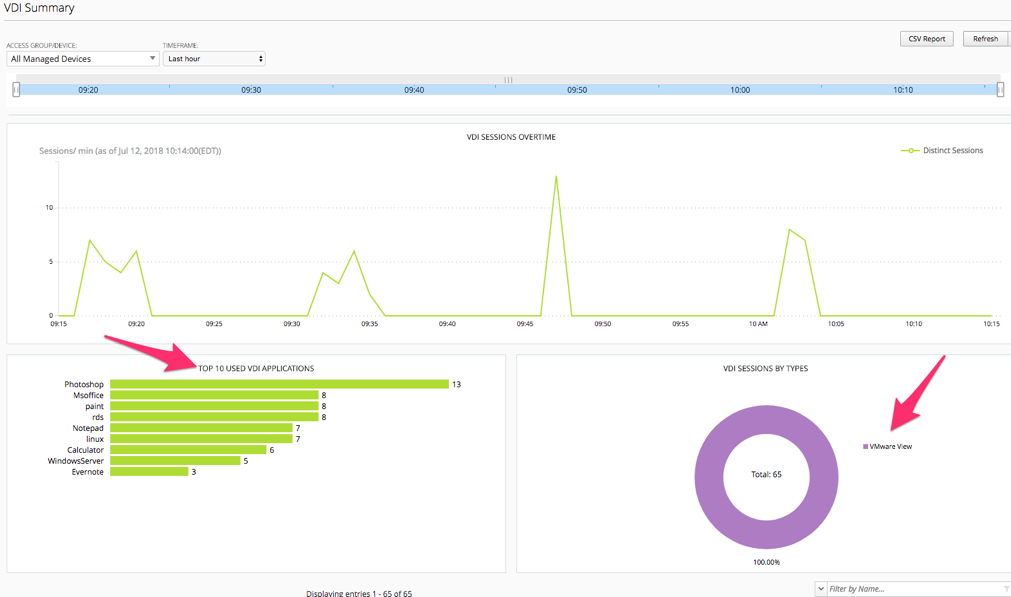
Many companies have implemented the use of Virtual Desktop Infrastructures of the years for deploying either individual published applications or full desktops for users. This summary screen provides reporting on the usage of those VDI objects being served through the BIG-IP Access Policy Manager working as a VDI Proxy for the three major flavors of VDI technology from Microsoft RDP, VMWare Horizon and Citrix XenApp/XenDesktop.
Sessions -> Sessions Summary
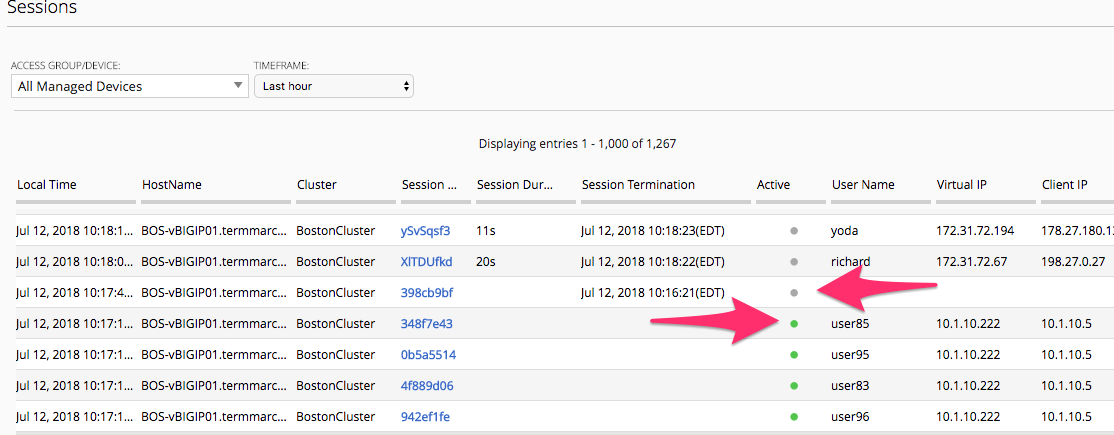
As we review the Session Summary screen you should notice under the ACTIVE column there are Green Dots for sessions that are currently active however this screen is displaying the list of all sessions even those denied sessions we reviewed earlier. You can click on the session ID to review the policy events for a given session.
Sessions -> Active
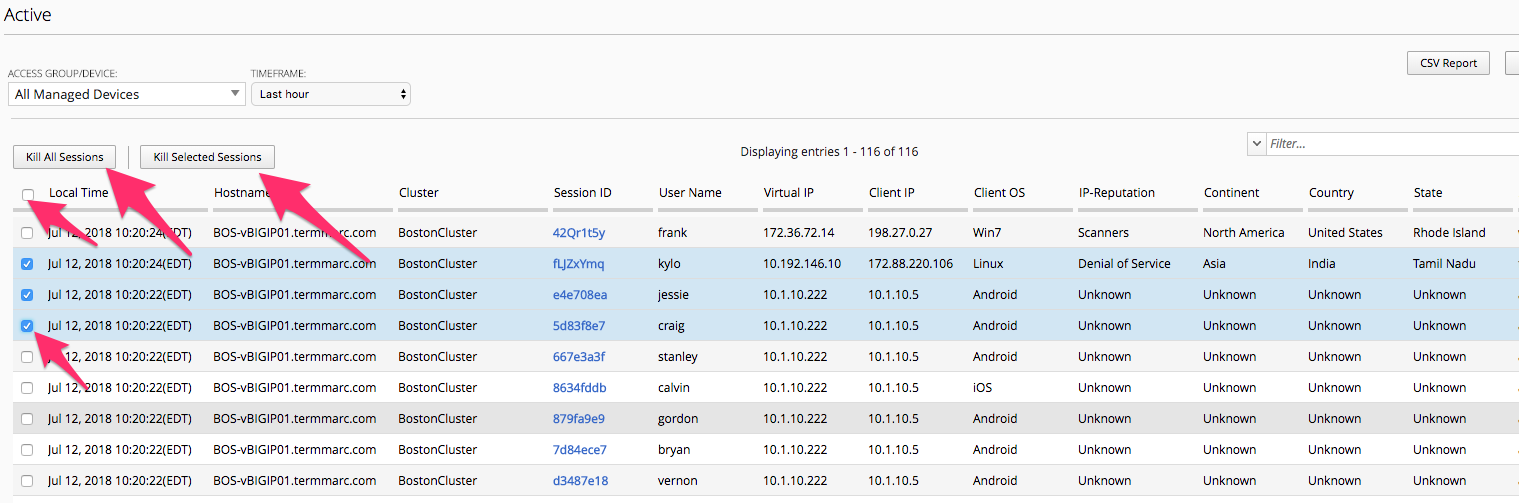
In this screen we are only reporting the Currently Active Sessions. Notice the check box to the left of eash session. You can click to check a box and the button above “Kill Selected Sessions” will be un-grayed allowing the Admin to kill the checked sessions. If the Admin were to click the check box in the Column header it would check all sessions boxes and the Kill All Sessions and/or Kill Selected Sessions buttons would then perform the kill on all sessions. In both scenarios the Admin is presented with a Confirmation Screen before actually killing those checked sessions.
Sessions -> Bad IP Reputation
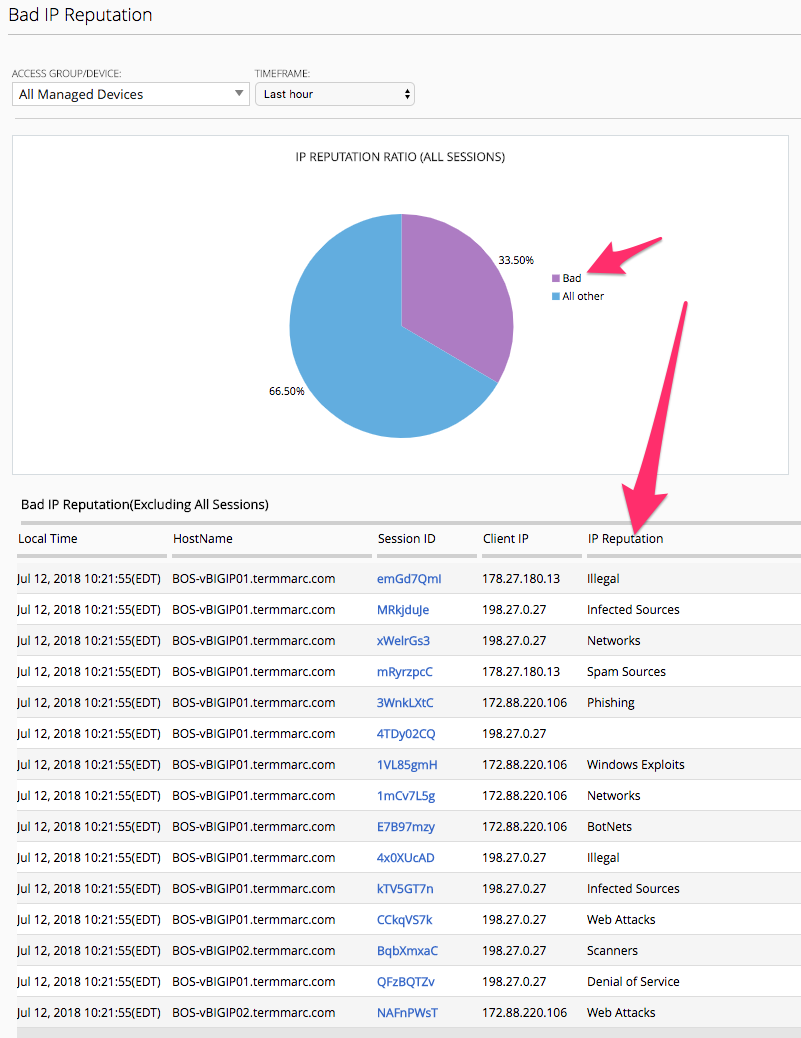
In this section we can see the reported IP Reputation data for incoming requests to the APM Policies.
Sessions -> Bowsers and OS
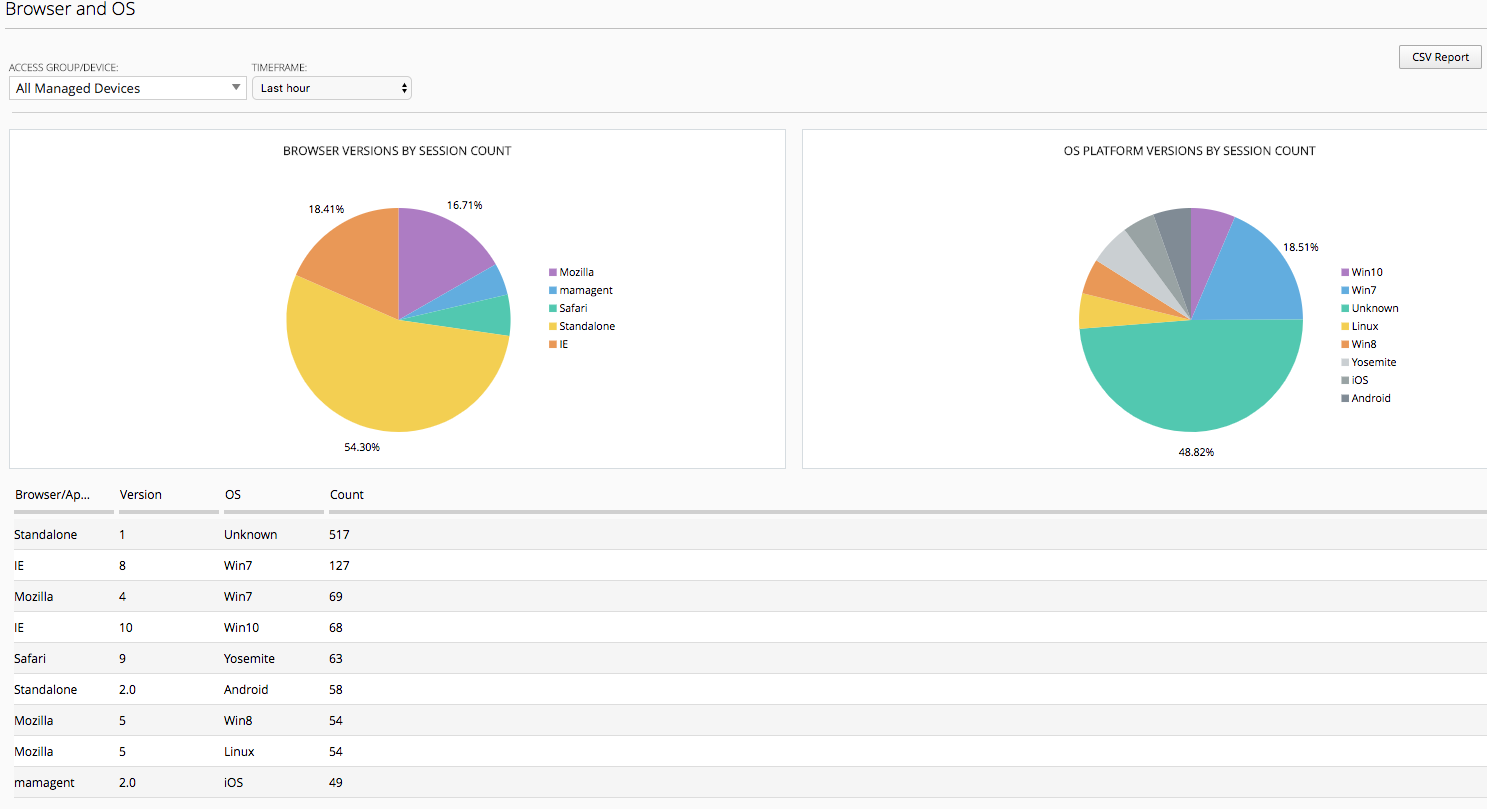
This screen provide details of browser types and OSes being used to access the APM policies. This is great information if an organization has specific policies in place that stipulate which Browsers and OSes that support. The Admin can quickly see where they fall in line with those policies.
Sessions -> By Geolocation
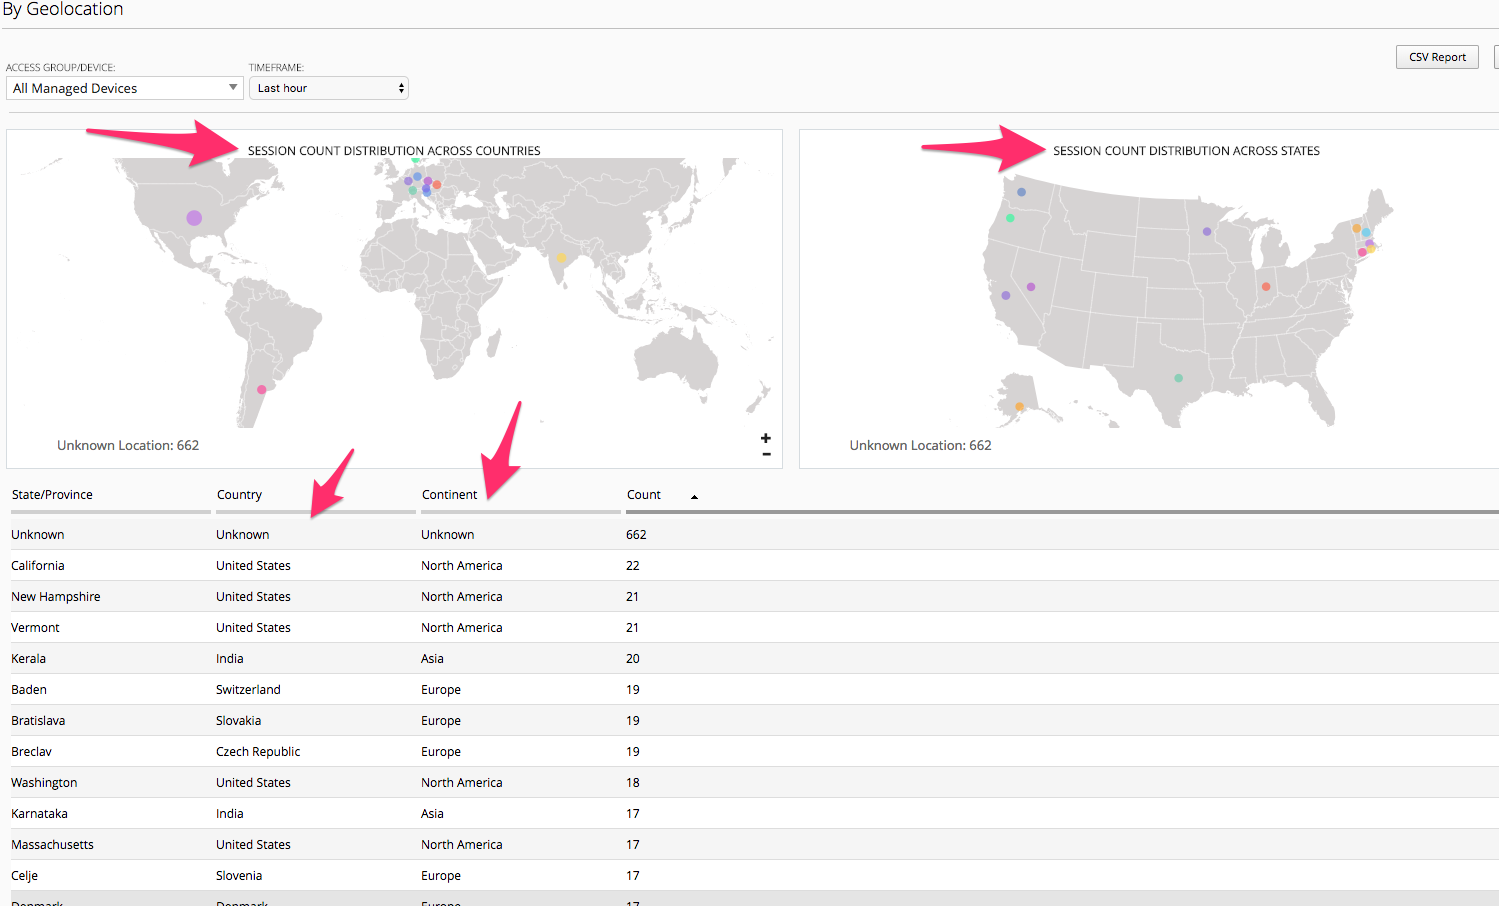
This reporting screen provides a Heatmap displaying from where access attempts are being initiated from. If an organization only allowed or supported access from certain geographic regions this screen can provide quick details on possible bad actor attempts to the organizations Access infrastructure.
Endpoint Software -> Endpoint Software Summary
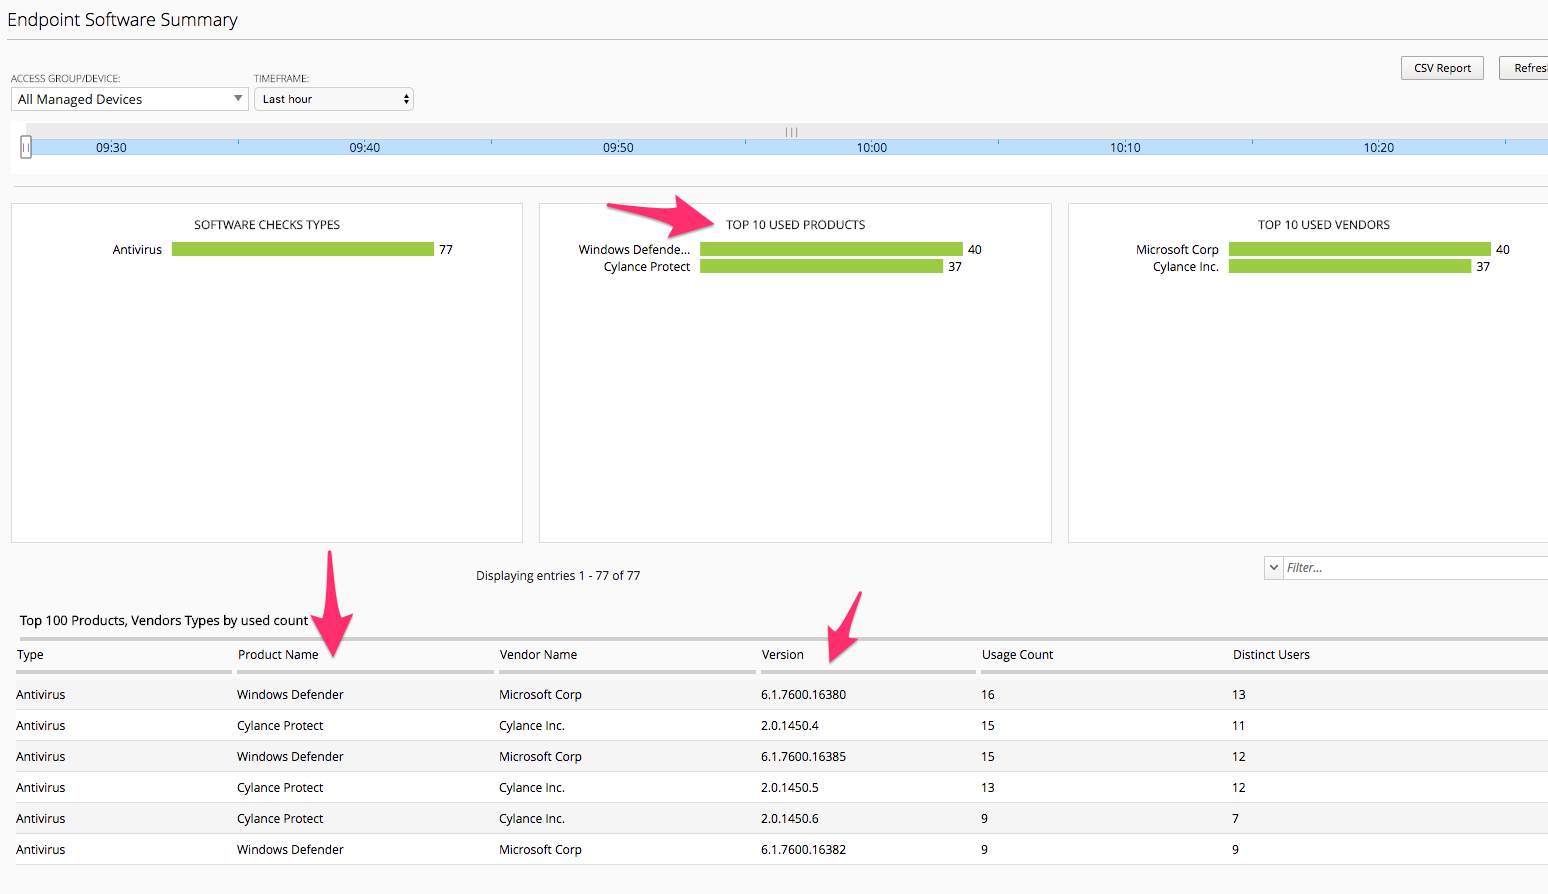
You may need to reset the Timeframe either by adjusting the sliders or using the Timeframe dropdown. This screen provides information of Endpoint Software in use by clients and detected via the Endpoint Inspection helper applications that run on clients systems and report back to the BIG-IP Access Policy Manager during access.
Endpoint Software -> Endpoint Software Details
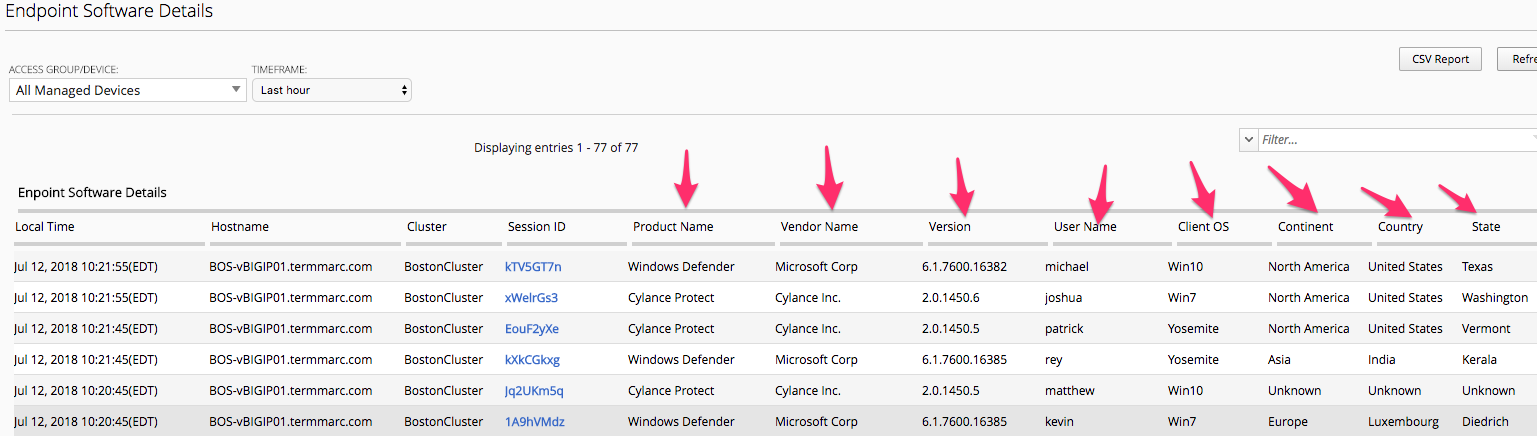
This is another great troubleshooting screen to review versions of client AV software.
License Usage
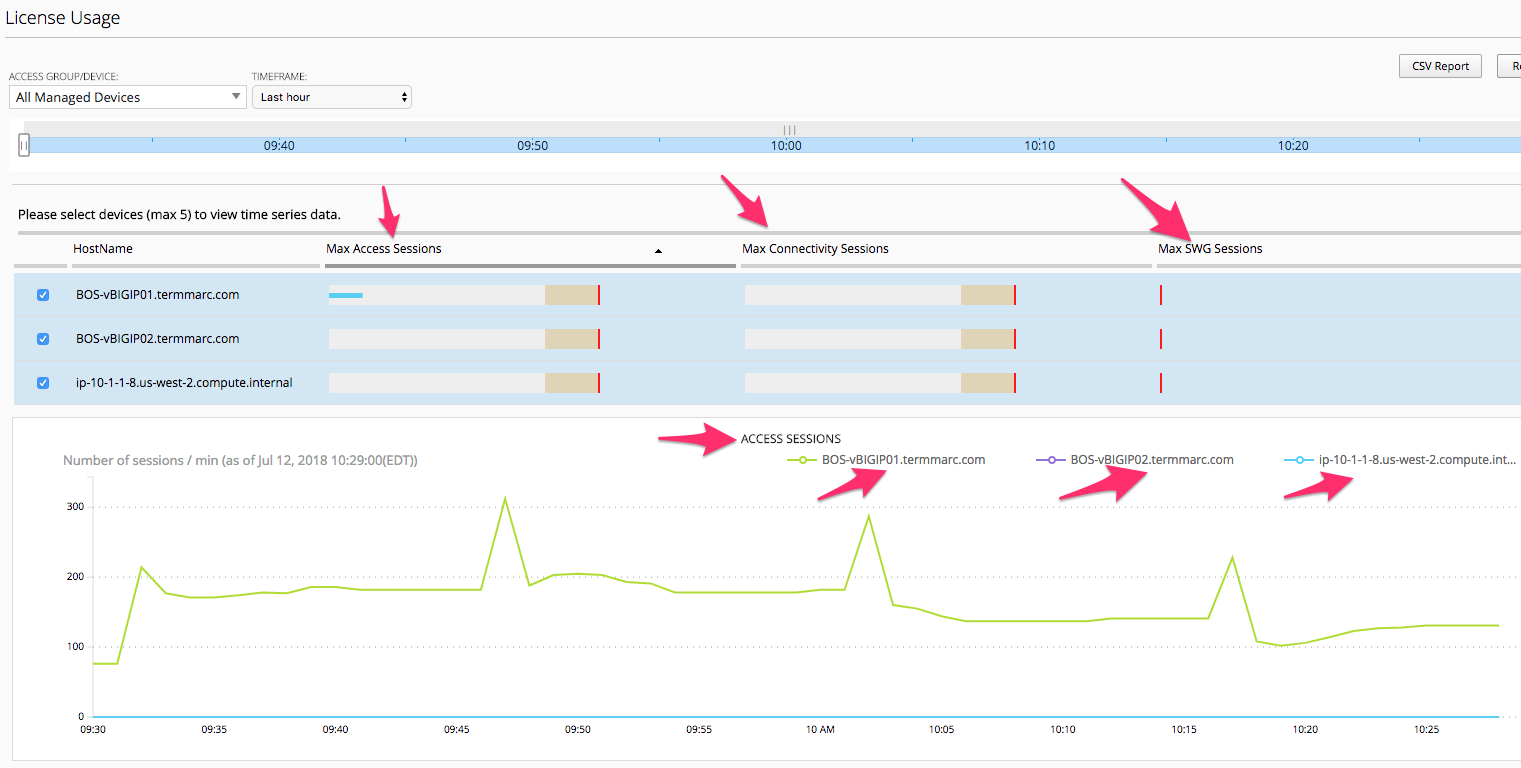
This screen provides an overview of the Access Policy Manager license usage for both Access Session licenses as well as Connectivity Session licenses per APM Device.
User Summary
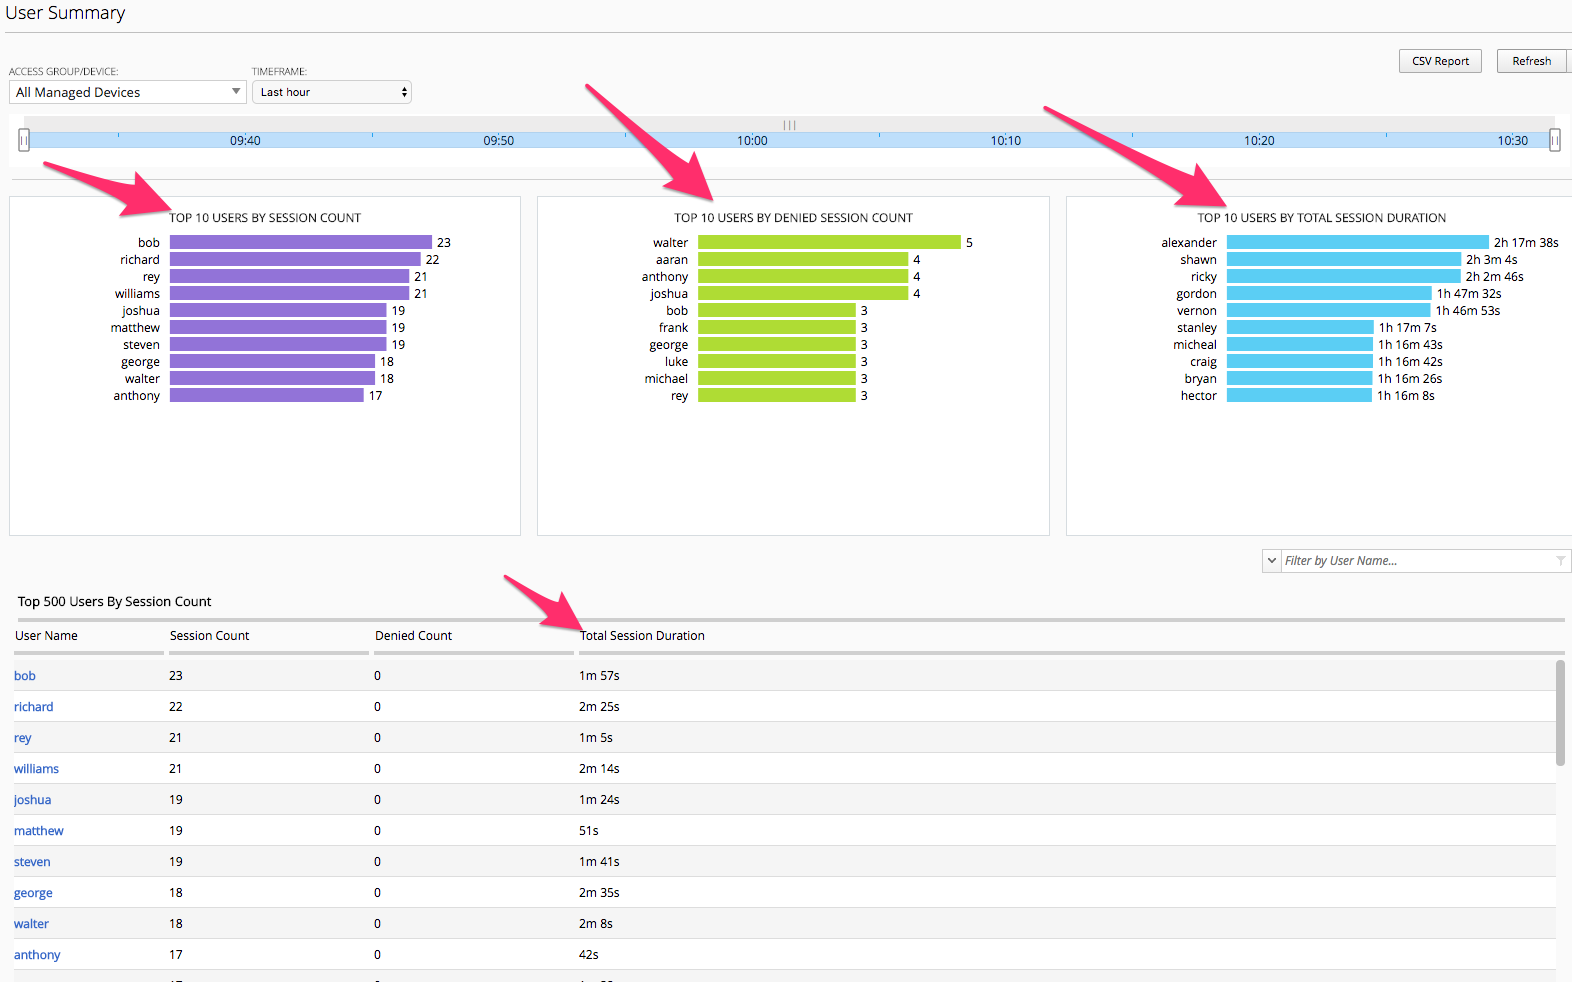
In the user summary screen one item that can be useful to an Admin is the Filter Search field by Username. If your organization has a large community of users accessing in many different methods or applications the ability to filter by username and drill into those sessions for a specific user are helpful for troubleshooting issues.
These were just a few of the screens available however taking the time to review this Monitoring Dashboards with live data can be helpful in getting familiar with Admin duties for Access Policy infrastructure using the BIG-IQ Centralized Manager.