NGINX Modern Apps > Class 4 - Introduction to NGINX Instance Manager > Module 2: Managing NGINX Instances Source | Edit on
Exercise 2.3: Show metrics for NGINX instances
Objective
Gather metrics from NGINX Instances.
NGINX Instance Manager collects metrics from NGINX instances and stores entries in the nginx-manager database. These metrics can be accessed externally by a grafana dashboard or other systems since they are exposed as a prometheus endpoint. Further customization can be done using PromQL to form queries.
Guide
Step 1: View metrics in the UI
For this step, open the user interface for nginx-manager in
the UDF dashboard. You can select the ACCESS menu under
NGINX Manager Server and the INSTANCE MANAGER UI selection.
This will open the user interface in a new browser tab.
From the Launchpad page, select Instance Manager and click on the Ubuntu hostname instance. The user
interface should open a page with details of the instance. Select the Metrics tab.
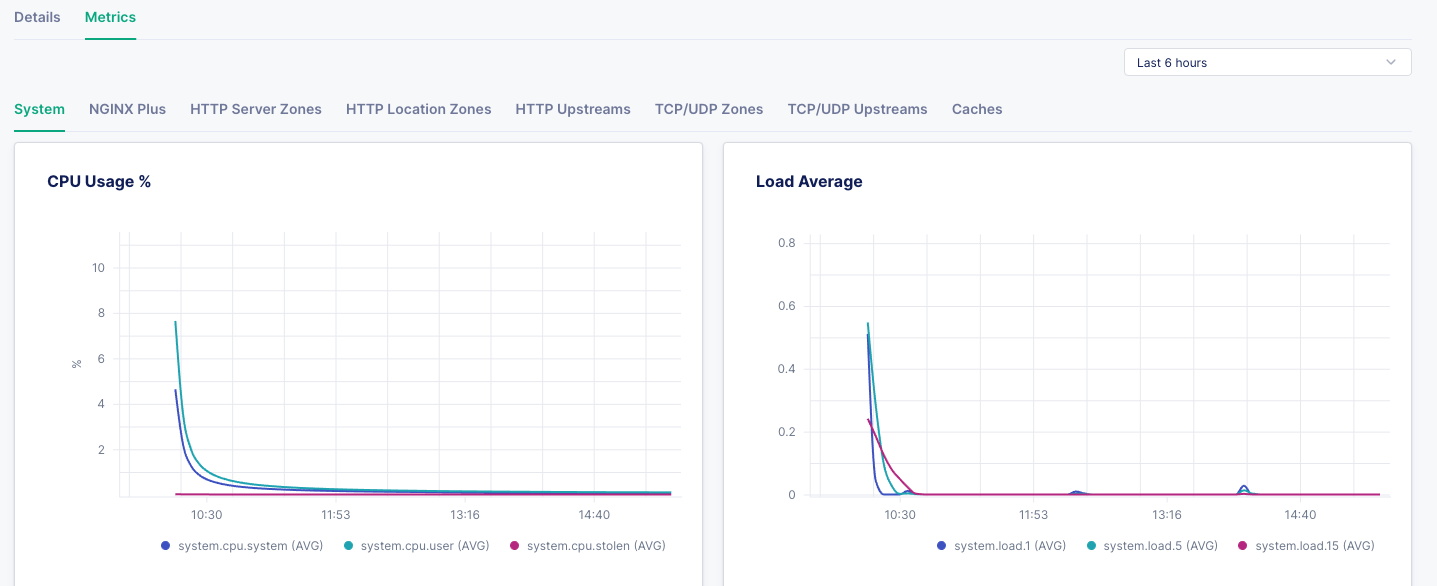
This page has some useful system information, such as CPU/Memory utilization. On the upper right, you can change the time duration from last 5 mins to last 90 days.
You can see operating system metrics and CPU and memory usage.