F5 Application Delivery Controller Solutions > TMOS - Performance Tuning > Lab 2: Working With TCP Profiles Source | Edit on
Task 3: TCP Buffers and Window Scaling
In this section, you will review graphs related to the testing in the previous sections showing the traffic behavior with each of the TCP Profiles.
Window Scale Review Using Wireshark Screenshots
To speed up the process, you will review TCP Window Scale screenshots taken from packet captures collected while this class was created.
Base Condition - tcp-wan-optimized/tcp-lan-optimized TCP Profiles assigned
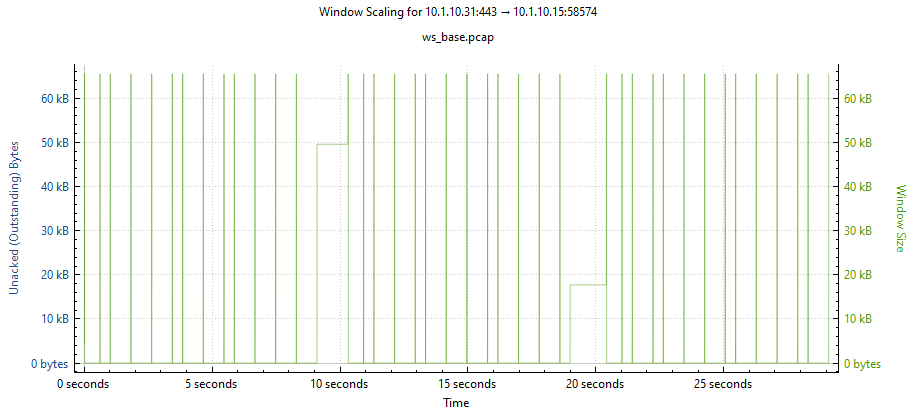
Server-side: The TCP Window size is limited to 65353 bytes because Window Scaling is not enabled. The TCP Window drops to zero many times throughout the single TCP stream.
F5-tcp-Progressive
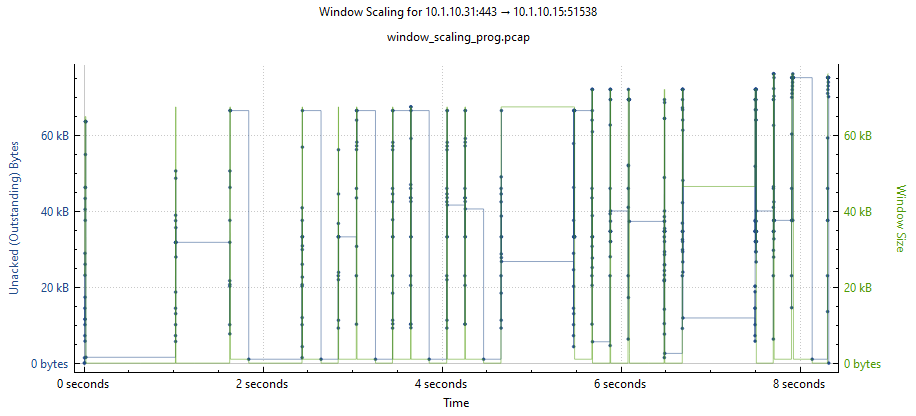
Server-side: The TCP Window size grows a bit larger towards the end of the TCP stream but there are still many drops to zero bytes. This is due to the way f5-tcp_progressive calculates the buffers with a low latency link.
Tcp_3mb Profile
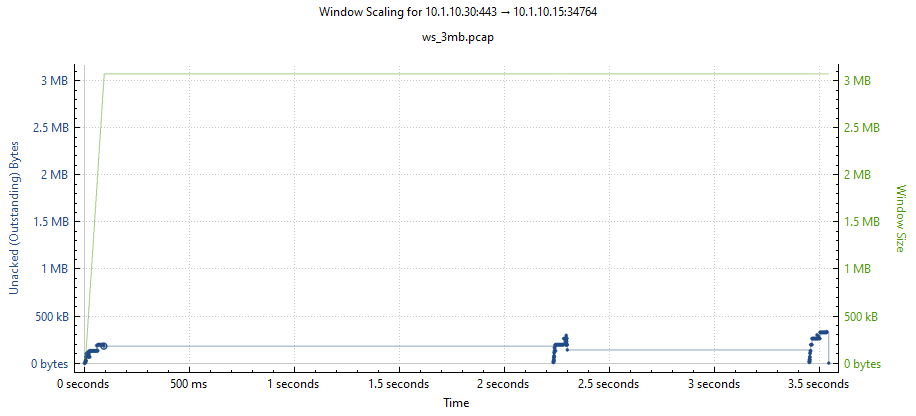
Server-side: The TCP Window size grows to 3mb in about 100ms and stays there throughout the TCP stream. There are TCP Zero Window events.
Wireshark Instructions For Viewing Window Scaling Graphs
If you don't know how to view the above data using Wireshark, follow the steps below, either from the Windows-Client or using TCP captures you may already have on your local system unrelated to this lab. You can skip to step 7 if using Wireshark locally with your own TCP capture files.
If you already know how to view TCP Window Scaling graphs in Wireshark, you can skip to the bottom of this page and go to Lab 3.
Open RDP session to the Windows Client. An RDP file will save to your browser's download location.
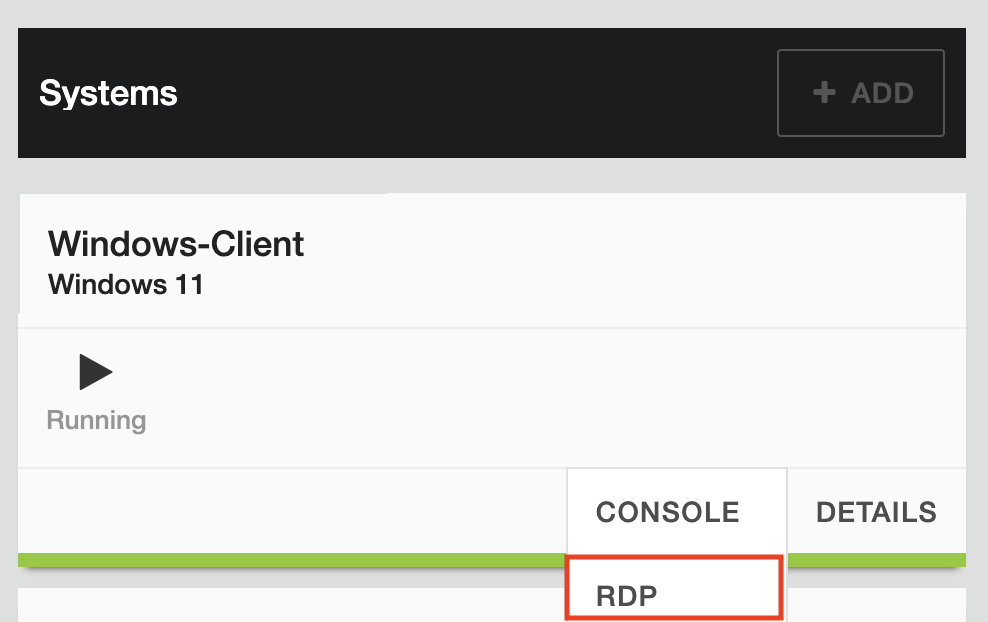
Find the .RDP file and click to open with your RDP client
Use the following credentials:
User: labUserPassword: lab.F5demo.com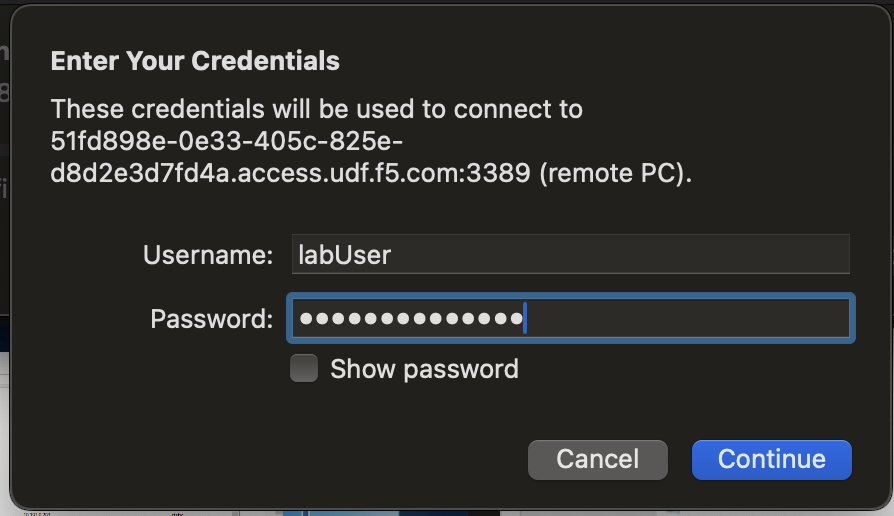
Click continue to the connection prompt
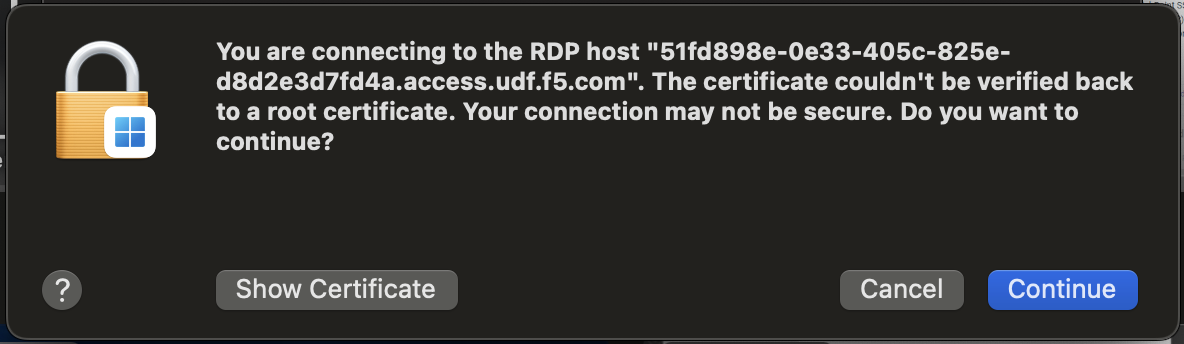
Double-click the Captures folder on the Desktop
Double-click ws_base.pcap to open the file in Wireshark
Use the following filter expression to show only SYN and SYN/ACK packets. For Wireshark to display the TCP Window Scale graphs correctly, it needs to see the entire TCP handshake.:
tcp.flags.syn==1
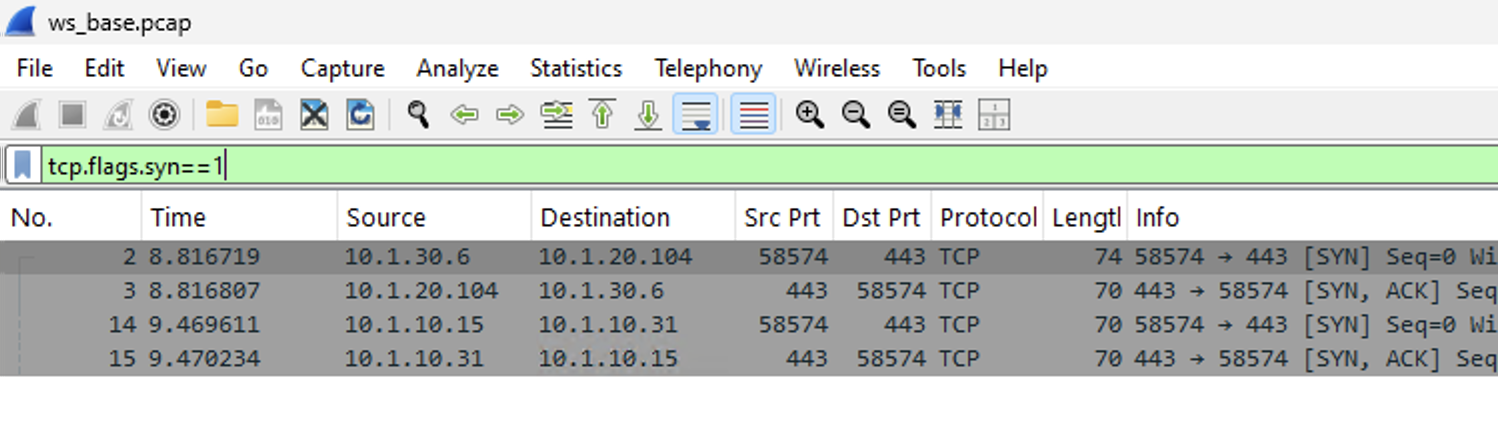
Click <Enter> for Wireshark to process the filter
You should see 2 sets of SYN packets from the lab capture.
Client-side: 10.1.30.6 <--> 10.1.20.104Server-side: 10.1.10.15 <--> 10.1.10.31If you are using you own capture file, pick a flow that is of interest.
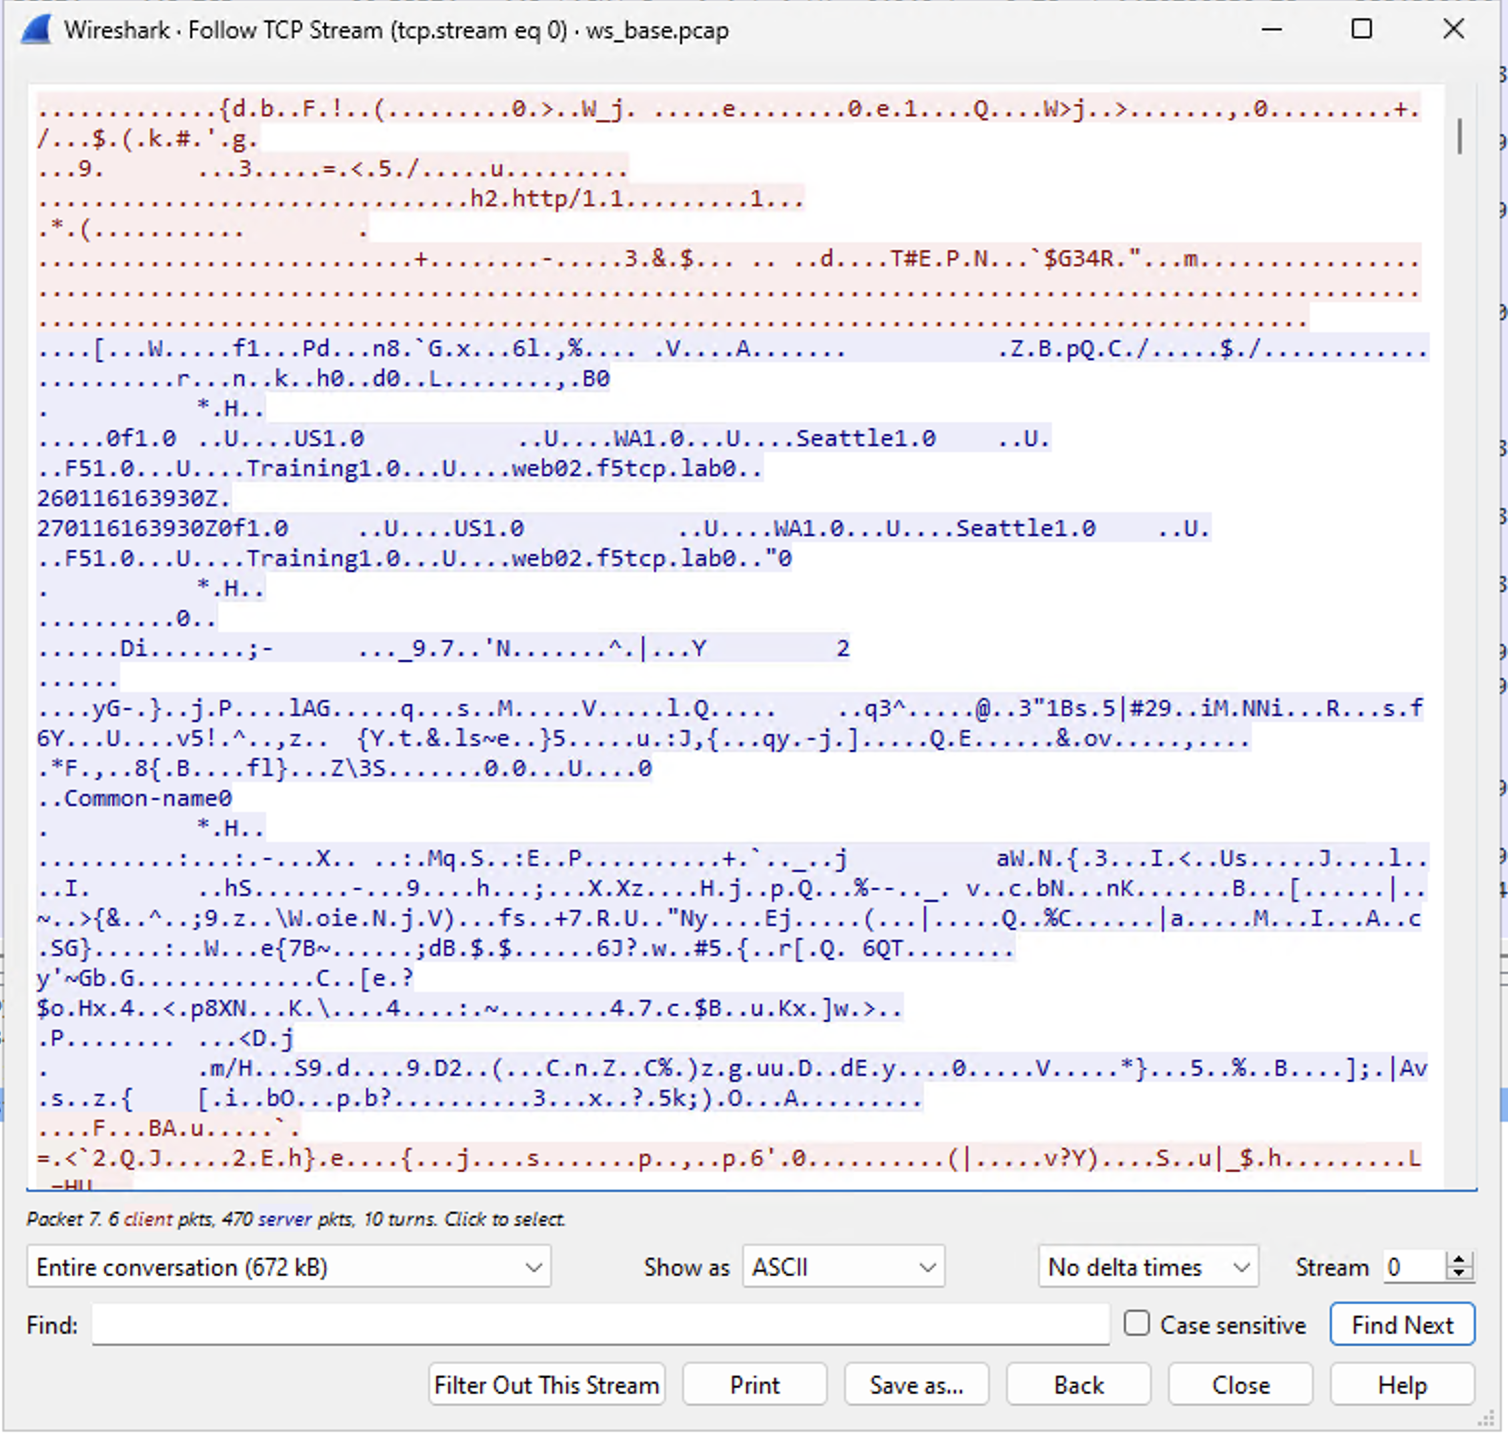
Right-Click on either a SYN or SYN/ACK from the server-side flow and select Follow > TCP Stream
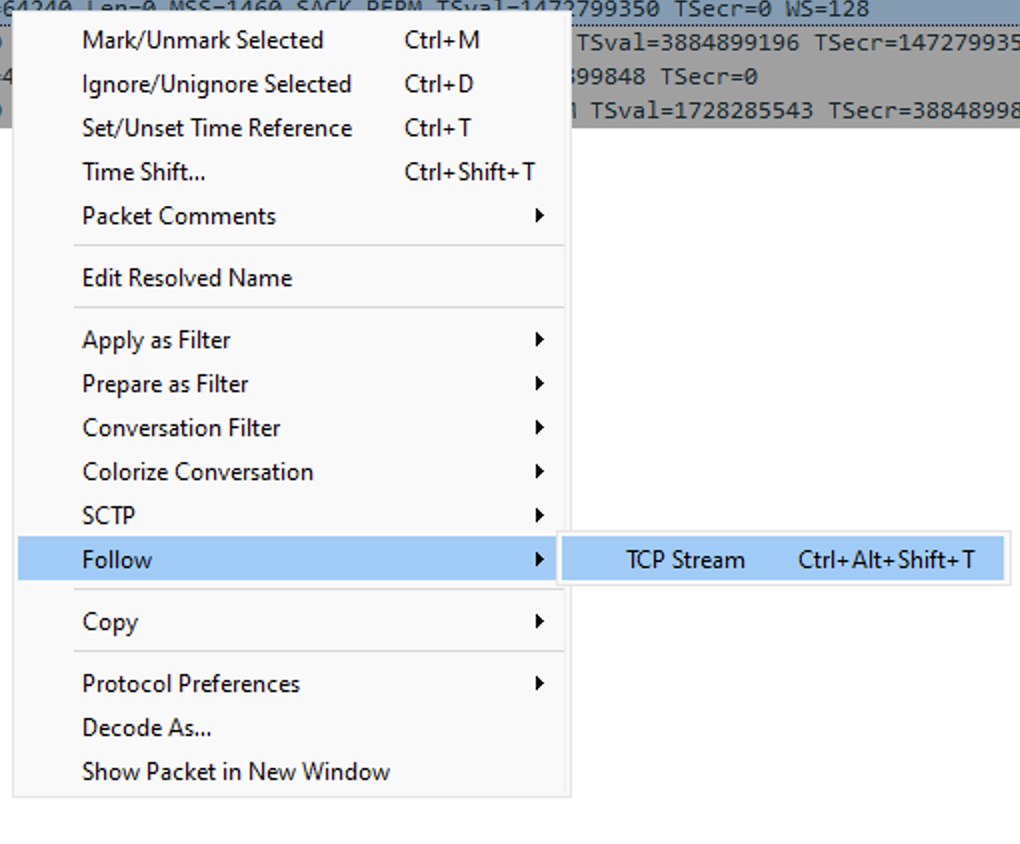
Close the TCP Stream dialog box by either clicking the X on the top corner or clicking the Close button at the bottom of the dialog.
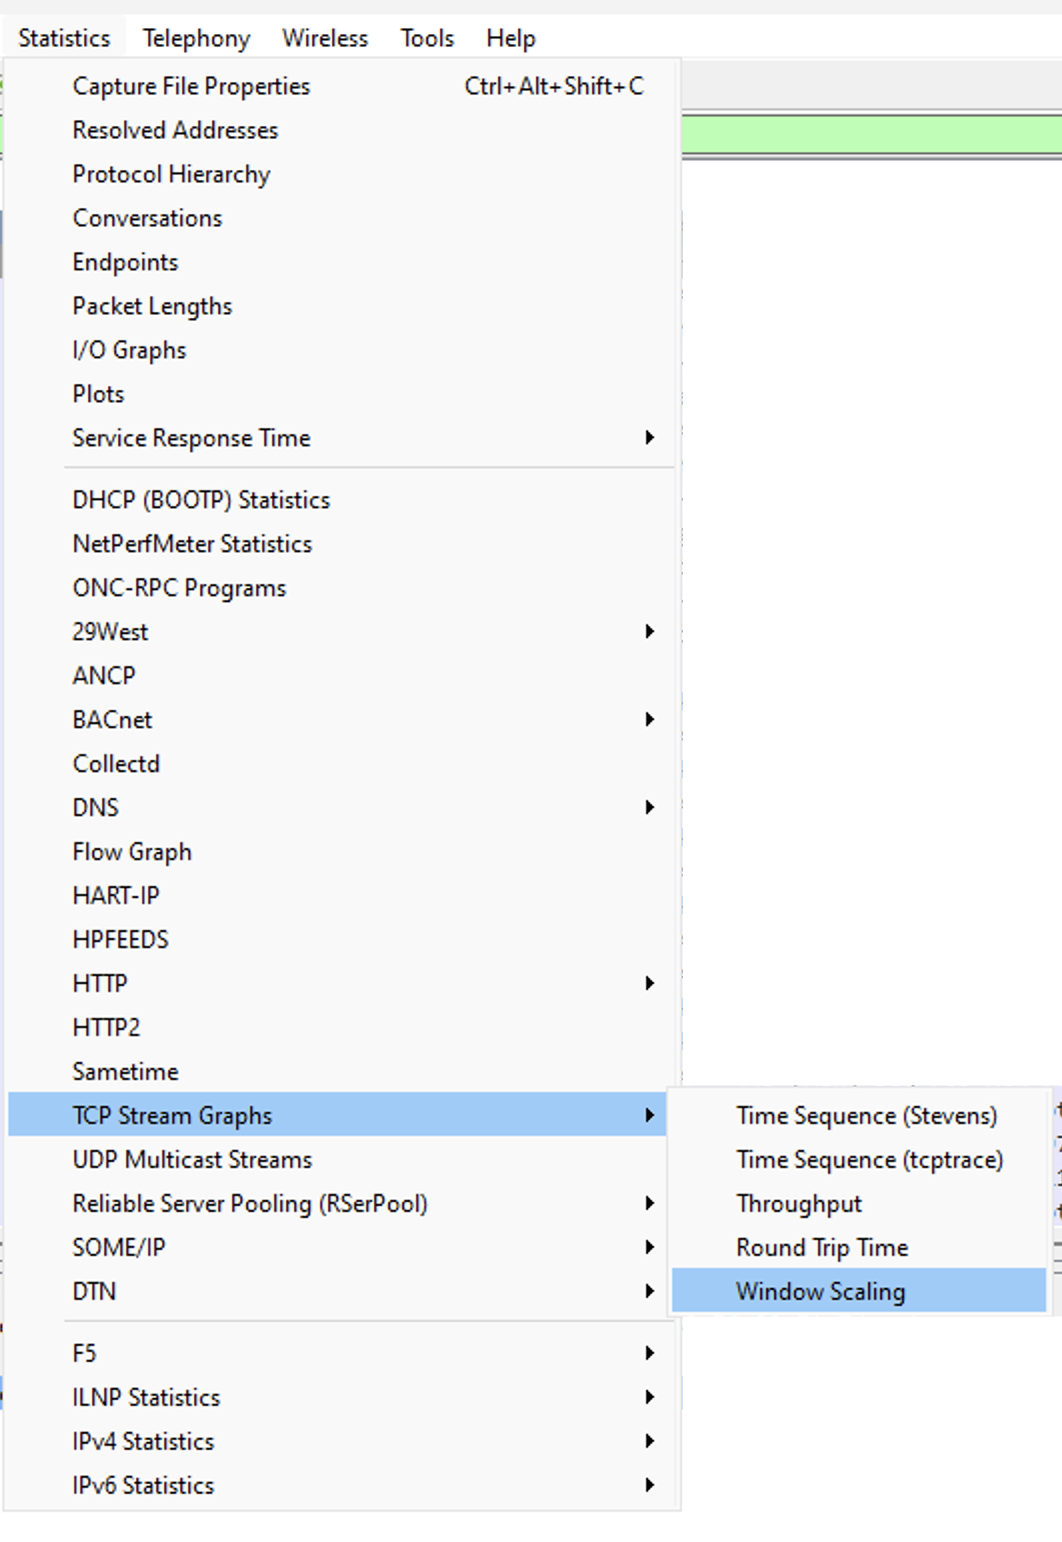
Click Statistics > TCP Stream Graphs > Window Scaling
This sample has the Bytes Out option unchecked to make it easier to see the TCP Window Scale behavior. Bytes Out is also interesting as it shows the in-flight data but the pattern is usually similar to Rcv Win where there are TCP Zero Window packets in the flow.