F5 Analytics and Visibility Solutions > Class 5 - F5 Insight for ADSP (AppWorld 2026 | 2 Hours) Source | Edit on
Ticket 01 – Explore the Top N Dashboard
Title: “What insights can you quickly gather from the Top N view?”
Note
WARNING: This lab uses 3rd party API Keys and these are never to be shared or used outside of the lab, and what it instructs, for any reason.
Ticket Description
The Top N dashboard provides a consolidated view of the most active and resource-intensive objects on a BIG-IP.
This ticket is designed to familiarize you with what information is available and how it can be used to quickly identify busy applications, high resource consumers, and potential availability concerns.
Your goal is to explore the Top N dashboard and understand the types of operational insights it provides.
Tasks
Navigate to:
Dashboards >> BIG-IP Device >> Top N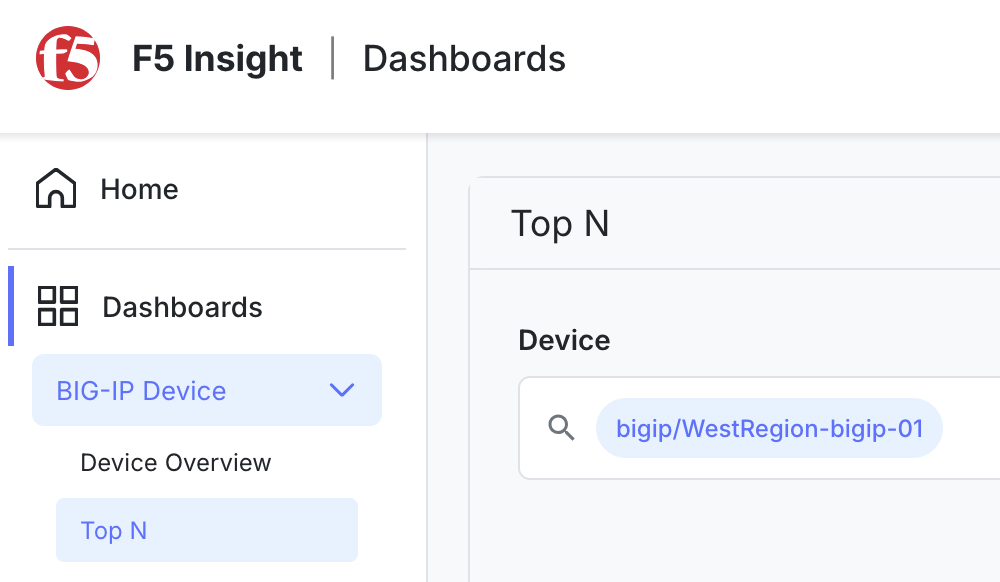
From the Device dropdown at the top of the page, select the BIG-IP specified below.
CentralRegion-bigip-01Change the Time Range (upper-right corner) to:
Last 7 DaysScroll through the page and review the available panels, including but not limited to:
- Top 10 VIPs By CPU Utilization
- Top 10 Process By CPU
- Analysis, Control, Data Plane Utilization
- Top 10 VIPs By WAF CPU Utilization
- Top 10 Pools By Active Connections
- Top 10 VIPs By Bandwidth
- Top 10 VIPs By SSL TPS Utilization
- Top 10 Virtual Servers By Low Availability [14d]
- Top 10 Pools By Low Availability [14d]
As you review each panel, consider:
- Which objects appear repeatedly across panels?
- Which panels show resource usage versus availability?
- Which panels would be useful during an incident?
- Which panels would be useful for capacity planning?
Try adjusting the Time Range to a shorter window (for example, Last 15 Minutes) and observe how the rankings change.
Deliverables
Briefly answer the following:
- Which VIP has the highest WAF CPU Utilization on CentralRegion-bigip-01?
Review the following for additional information and trends:
- Which VIP appears most frequently across Top N panels?
- What types of operational questions could this dashboard help answer?
- Which panel did you find most useful and why?
- Did any objects show degraded availability?
Hints
- Pay specific attention to the Top 10 VIPs By WAF CPU Utilization panel
- You can deselect entries in graph legends to simplify views.
- Compare short time ranges to long time ranges.
- Not every “Top” entry indicates a problem — some reflect normal load.
- Look for patterns, not just single spikes.
This concludes Ticket 1.
Go to Ticket 02 - Analyze Traffic Patterns for an Application
Go to Overview