F5 Analytics and Visibility Solutions > Class 5 - F5 Insight for ADSP (AppWorld 2026 | 2 Hours) Source | Edit on
Ticket 02 – Analyze Traffic Patterns for an Application
Title: “When is our application experiencing peak traffic?”
Ticket Description
The application owner for primary-app-site-1 has requested insight into traffic patterns for their HTTPS virtual server. They would like to understand when traffic volume is highest in order to plan scaling and maintenance windows.
Context
Device Name: CentralRegion-bigip-01
Virtual Server Name: primary-app-site-1-https-vip
Protocol: HTTPS (TCP 443)
Tasks
Determine which times of day and which days of the week show the highest traffic for the virtual server primary-app-site-1-https-vip on CentralRegion-bigip-01.1.
Navigate to:
Dashboards >> BIG-IP Fleet >> Virtual Servers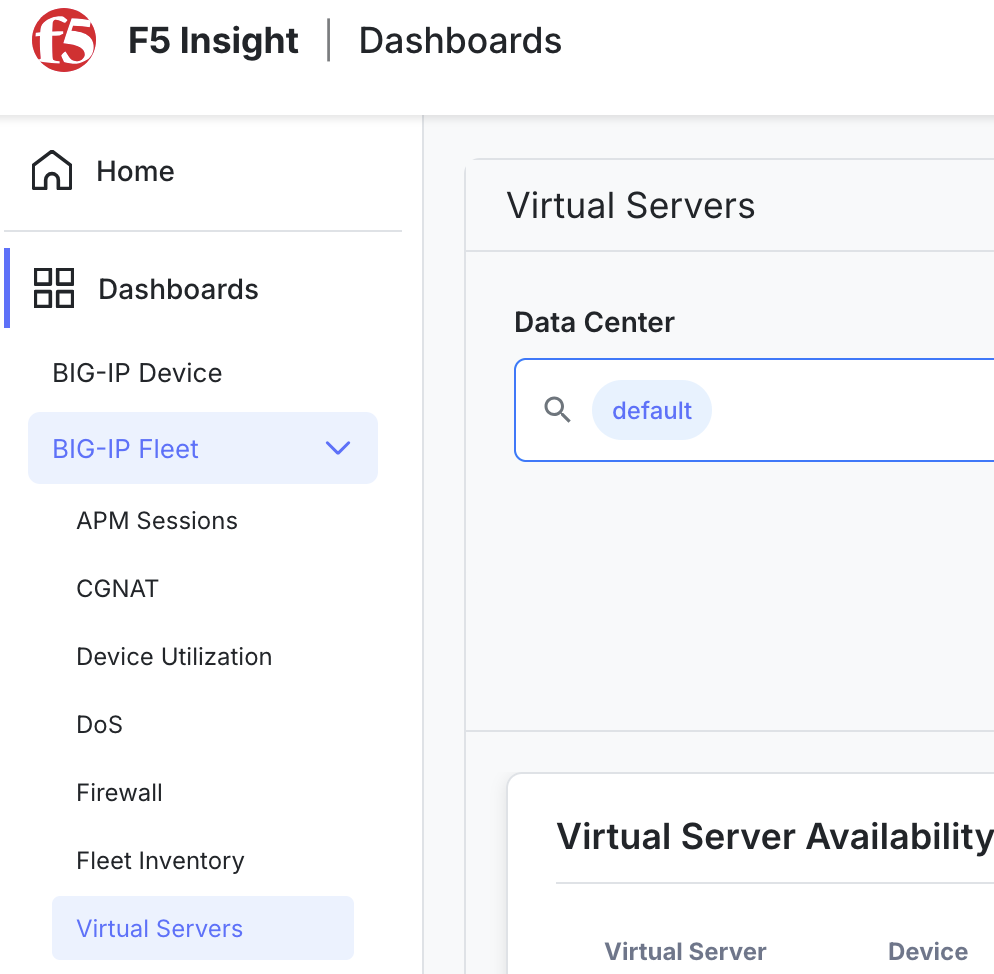
From “Data Center” add the Data Center:
AntarcticaFrom “Devices” leave the default value as:
bigip/CentralRegion-bigip-01From the “Virtual Server” dropdown, verify only below is selected:
primary-app-site-1-https-vipClick the “Apply Filters” button.
Review the following panels:
- VS is Available
- VS Connection Rate
- VS Data Rate
Use the Time Range dropdown in the upper-right corner to expand the view to at least the Last 7 Days.
Deliverables
Briefly answer the following:
- What is the graph telling you about the Virtual Server availability? What percentage has this Virtual Server been up over the last 7 days?
Review the following for additional information and trends:
- Peak time(s) of day
- Peak day(s) of week
- Observed traffic behavior (weekday spikes, weekend drops, steady patterns, etc.)
- Recommended maintenance window based on traffic analysis
Hints
Pay close attention to:
- VS is Available panel
- Request rate trends
- Throughput (bps)
- Connection counts
- Historical time-based views
This concludes Ticket 2.
Go to Ticket 03 - Determine Last Application Outage
Go to Overview