F5 BIG-IQ Centralized Management Lab > BIG-IQ Solo Use Cases Source | Edit on
Lab 2.3: Troubleshooting Application Response Time Browser
Note
Estimated time to complete: 5 minutes
Lab environment access
If you have not yet visited the page Getting Started, please do so.
Tasks
- Login as paula in BIG-IQ.
- Select application service
security_site16_bostonlocated underairport_securityapplication.
The virtual IP address 10.1.10.116 is configured behind site16.example.com FQDN.
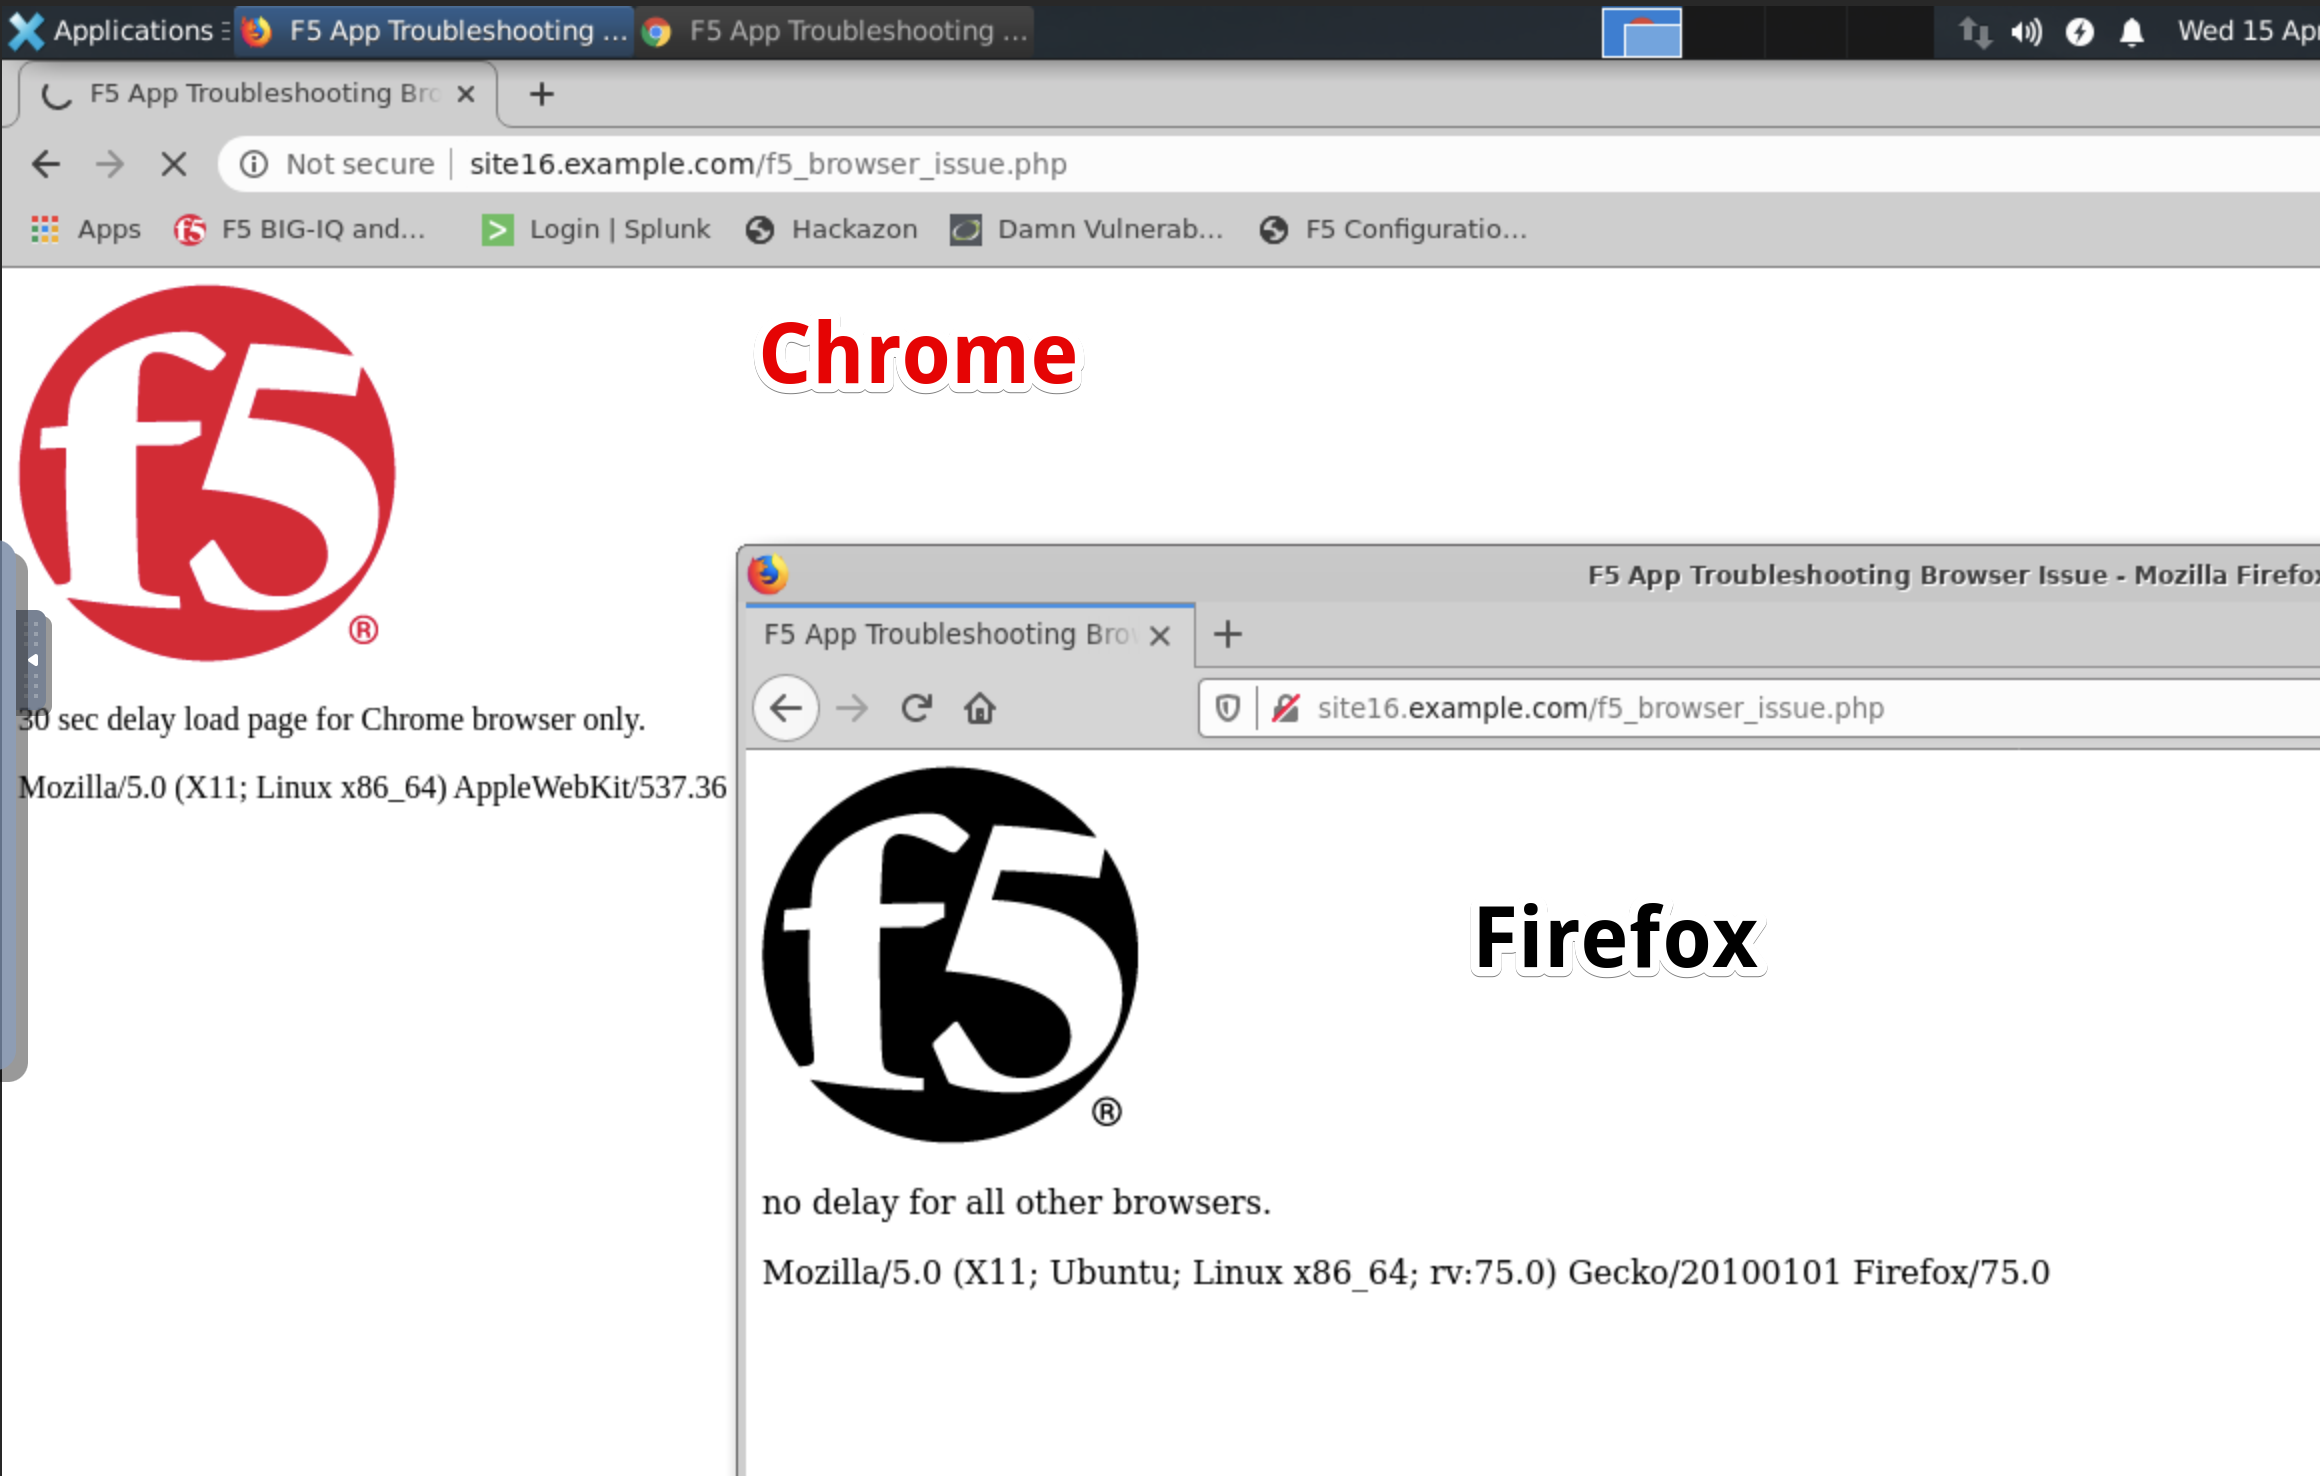
- Open Google Chrome in the Ubuntu Jumphost and navigate on the website
http://site16.example.com/f5_browser_issue.php.
Note
Accept the private certificates.
A page f5_browser_issue.php is behaving differently on Chrome compare to other browsers.
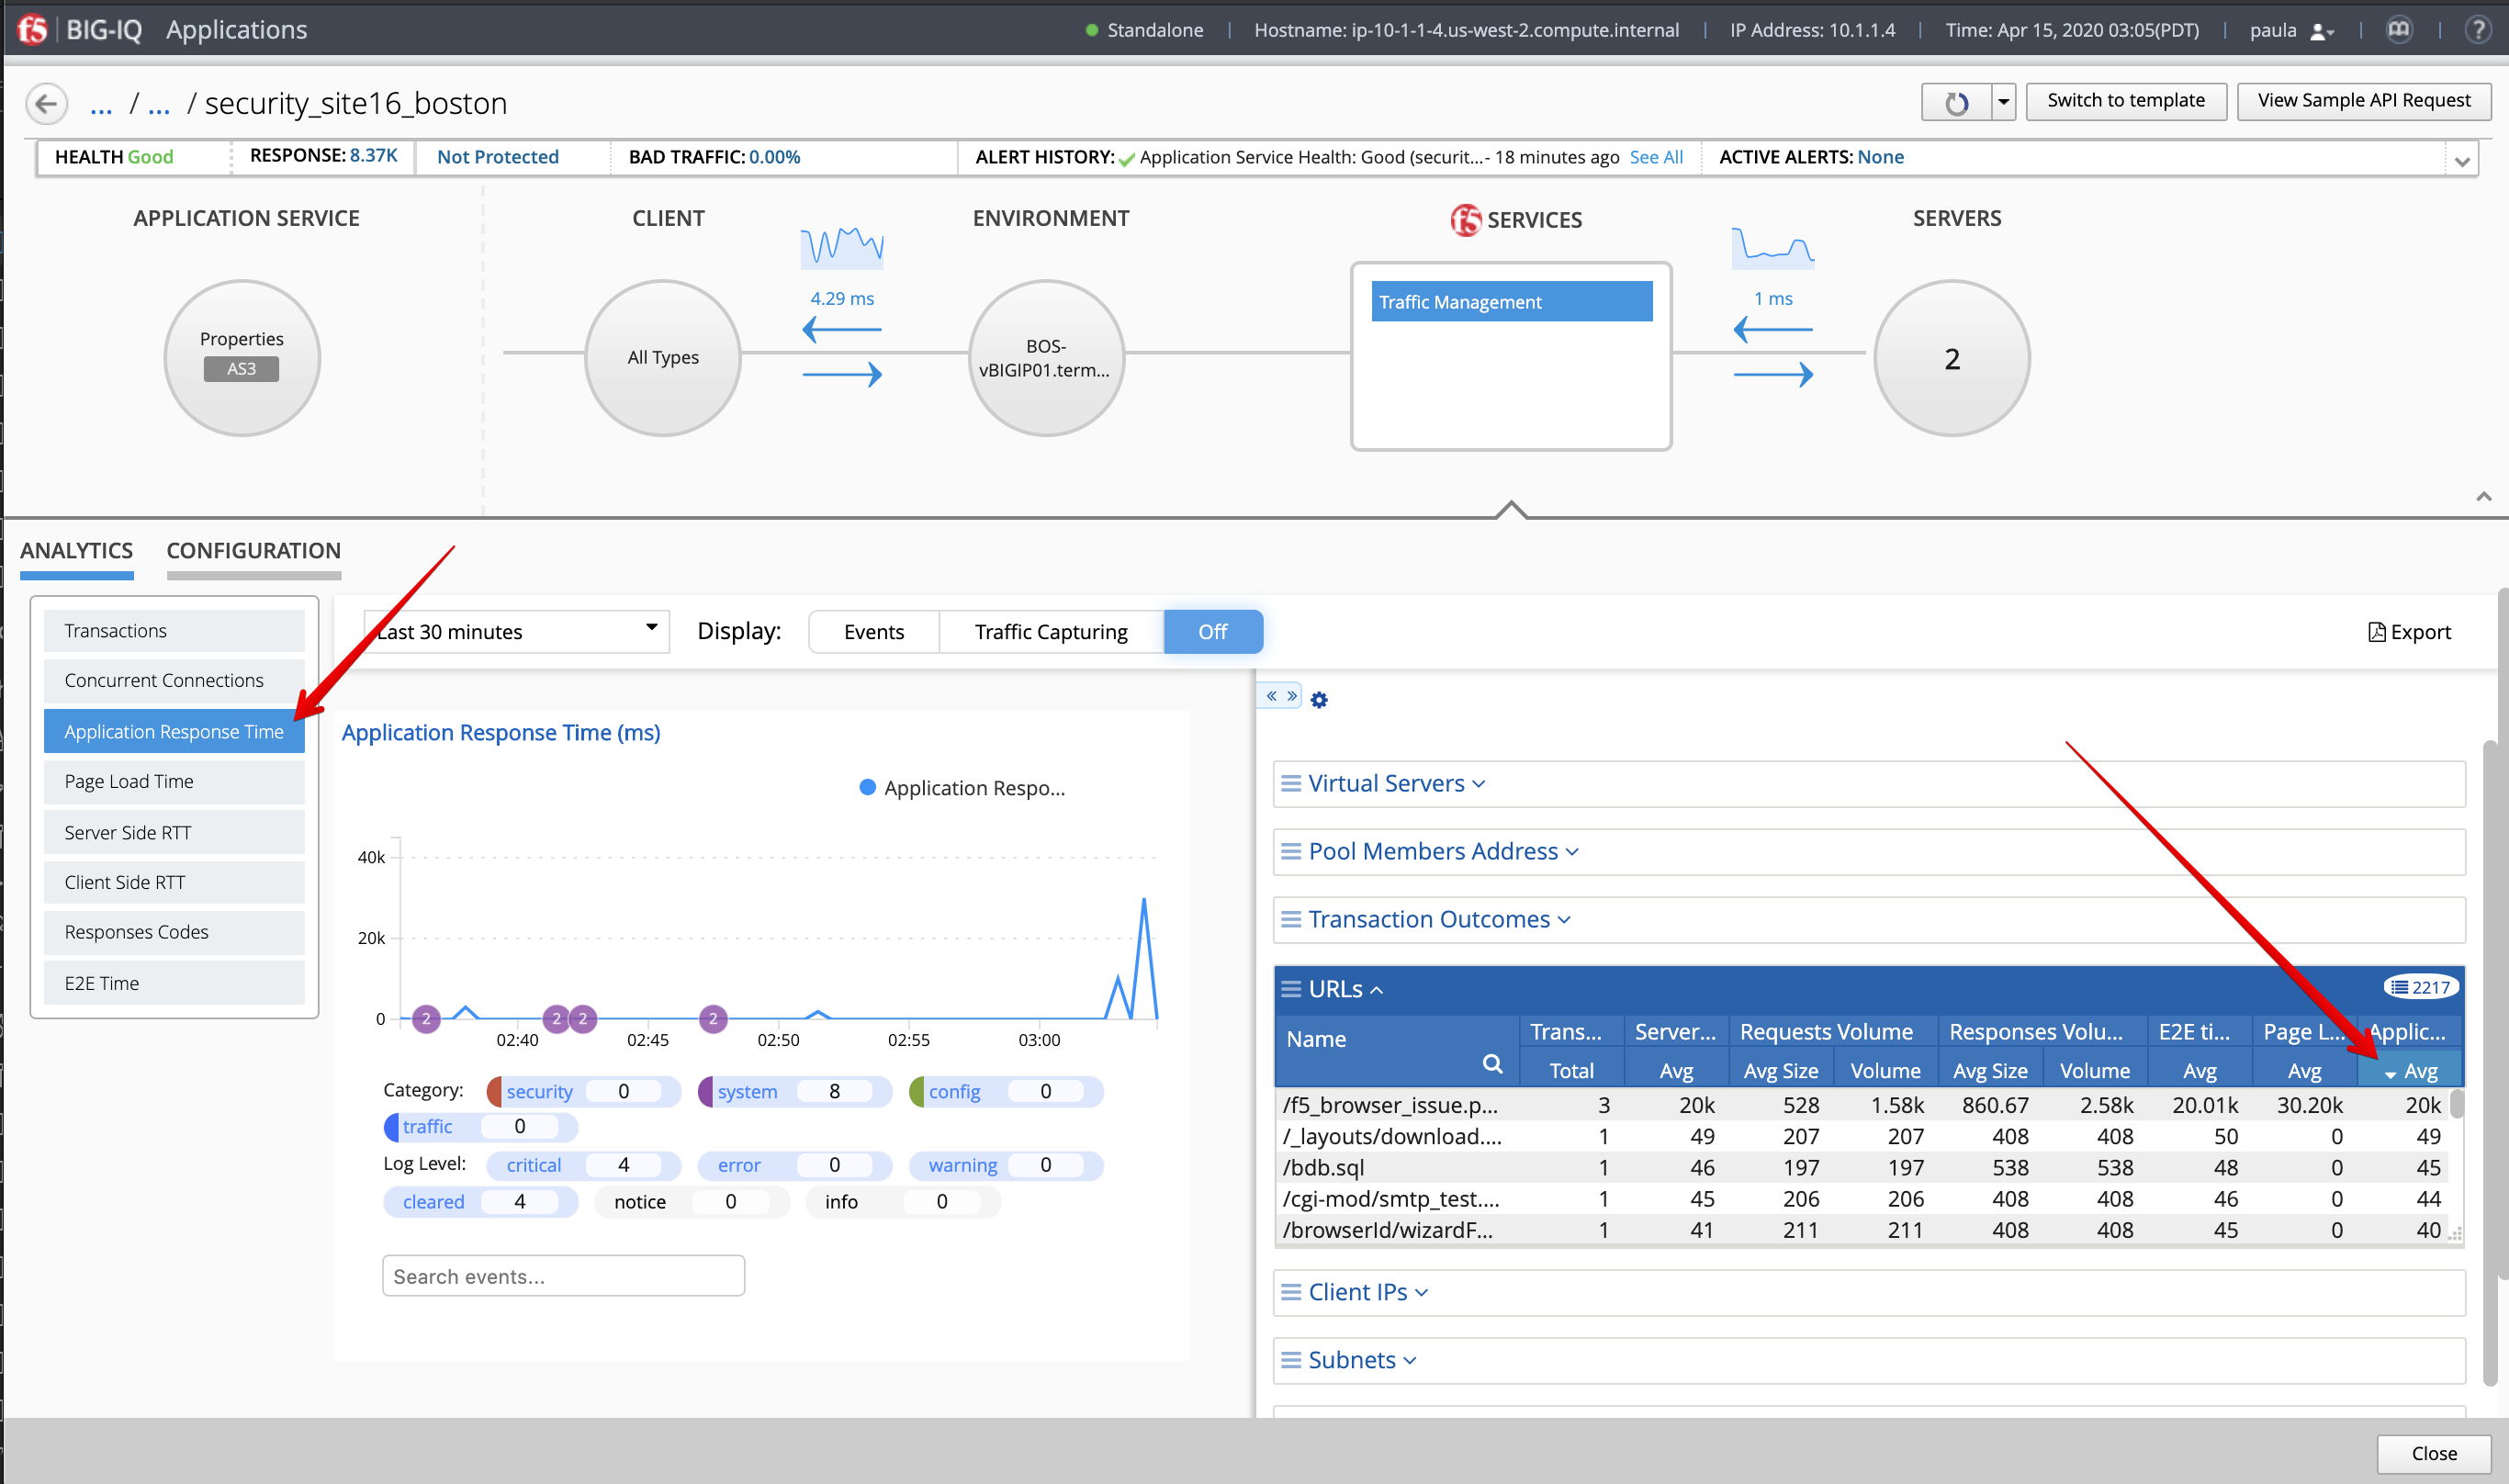
- Back to BIG-IQ Application dashboard, open application
security_site16_bostonand display the Application Response Time Analytics.
Expand the right-edge of the analytics panel to get the URLs and Browser filters. Order the URLs by App Response Time Average.
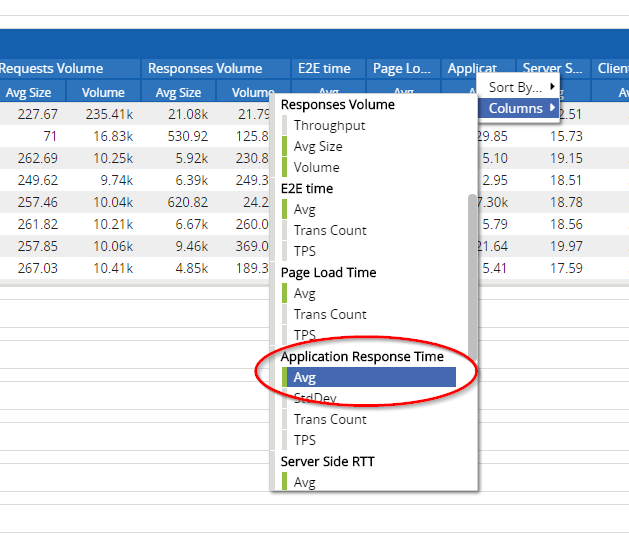
If the Application Response Time column isn’t showing, click right on the blue portion of the table, select Columns, then select Avg under the Application Response Time:
- Select the page f5_browser_issue.php, which has the highest value. Now all the values in all the other tables are about the page previously selected.
In the Browsers filter, notice the 30 seconds Application Response Time for Chrome browser while other browsers show a much lower value.
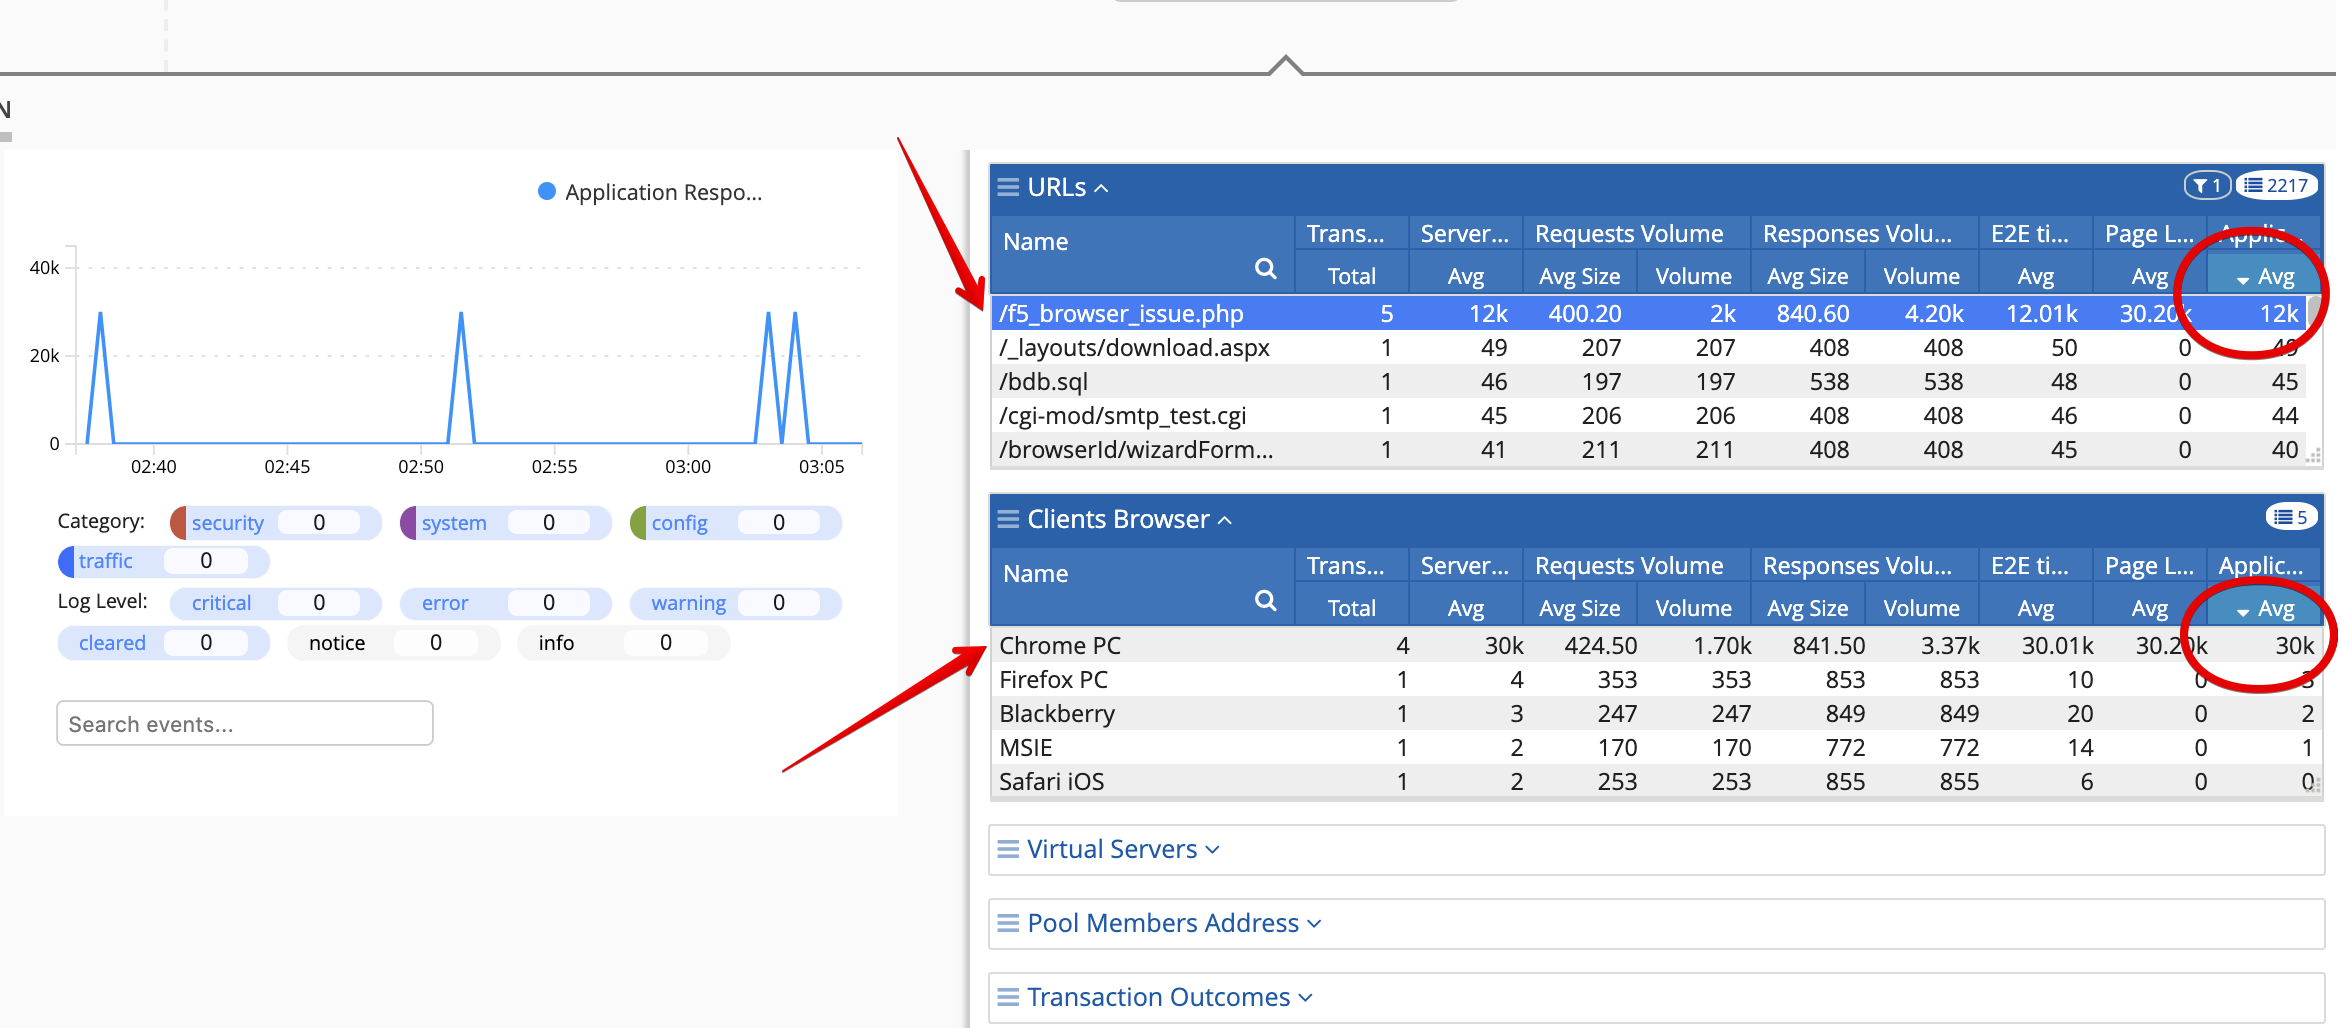
We know now the problem with this web application isn’t realated to F5 but to the application itself.