F5 BIG-IP SSL Orchestrator Training Lab > All SSL Orchestrator Lab Guides > [Archived] SSL Orchestrator v5 (Ravello | 4 hours) > Module 1 - Create a Transparent Forward Proxy SSLO Source | Edit on
Lab 1.12: Test the solution
To test the deployed solution, RDP to the Outbound Win7 Client and do the following:
Hint
Username = student / Password = agility
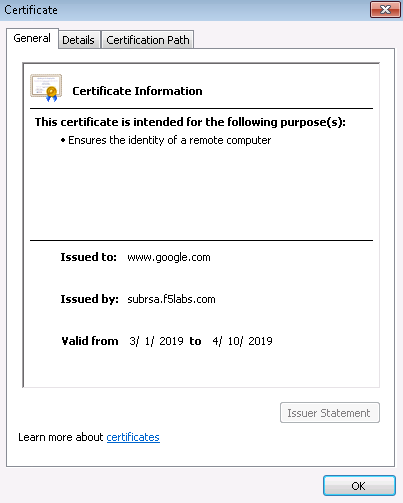
Server certificate test
Open a browser on the client system and navigate to any remote HTTPS site, for example, https://www.google.com. Once the site opens in the browser, check the server certificate of the site and verify that it has been issued by the local CA configured in SSLO. This confirms that the SSL forward proxy functionality enabled by SSL Orchestrator is working correctly.

Decrypted traffic analysis on the F5
Perform a tcpdump on the F5 system to observe the decrypted clear text traffic. This confirms SSL interception by SSLO.
Hint
You can use the RDP session to the test client or directly attach to the BIG-IP CLI via Putty or any SSH client.
tcpdump –lnni [interface or VLAN name] -Xs0
As a function of adding a new service, the UI requires a name for each (source and destination) network. SSL Orchestrator will then create separate source and destination VLANs for inline security devices, and those VLANs will be encapsulated within separate application service paths. For example, given an inline layer 2 service named "FireEye" with its "From BIGIP VLAN" named "FireEye_in", and its "To BIGIP VLAN" named "FireEye_out", its corresponding BIG-IP VLANs would be accessible via the following syntax:
ssloN_ + [network name] + .app/ssloN_ + [network name]

Example:

ssloN_FireEye_in.app/ssloN_FireEye_in
ssloN_FireEye_in.app/ssloN_FireEye_in
The security service VLANs and their corresponding application services are all visible from the BIG-IP UI under Network --> VLANs. A tcpdump on the source side VLAN of this FireEye service would therefore look like this:
tcpdump -lnni ssloN_FireEye_in.app/ssloN_FireEye_in -Xs0
Decrypted traffic analysis on the security services
Depending on the type of security service, it may easier to log into the console shell and run a similar tcpdump capture on the inbound or outbound interface, to tail its capture logs, or to log into its management UI and capture analytics. A tcpdump capture usually requires root or sudo access.
tcpdump -lnni [interface] -Xs0