Creating Dashboards in F5 Beacon
In this section we will take our Mobile_App and add it to a Dashboard to track within the F5 Beacon portal. Dashboards can consist of many Applications, events, insights, and meta-information to add a single view into your environment. For example, when we created our Mobile_App we added a key/value tag to it as Environment = Lab. If we add this tag to all of our Lab Applications then we can group them into a dashboard and view their status as a whole. For this example we are starting with just the Mobile_App application that we created.
In the F5 Beacon portal navigate to Dashboard Management and then select Create.
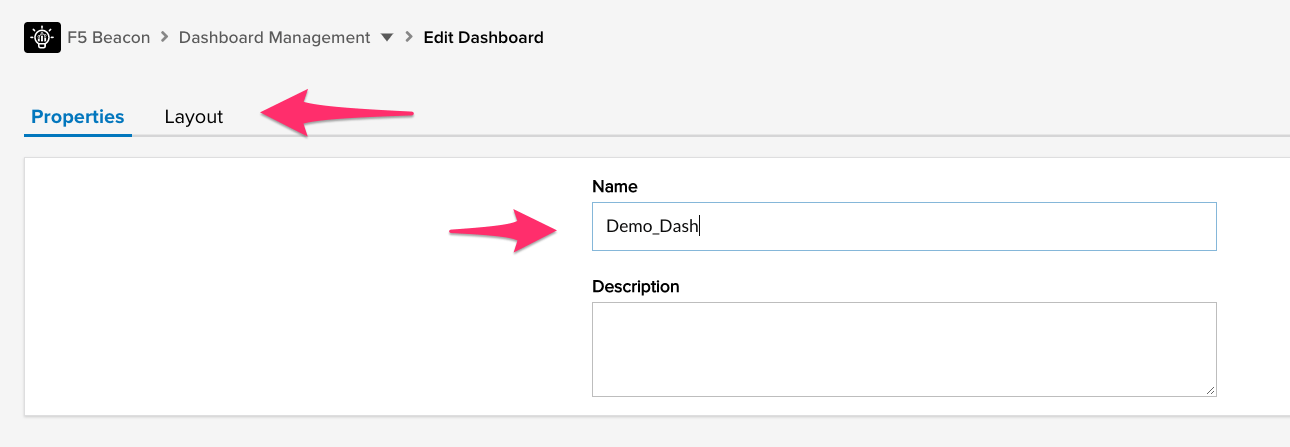
Name the dashboard Demo_Dash and then click the Layout tab.
On the right hand side you will see widgets that can be dragged into the main dashboard and then configured. Start by dragging the Application Map widget over to the dashboard. You will notice that it contains a drop-down menu you choose which Application you would like displayed. Since we have only created 1 app (Mobile_App) it defaults to that one.
You can also expand the size of the widget by dragging the small arrow icon in the bottom right of it.
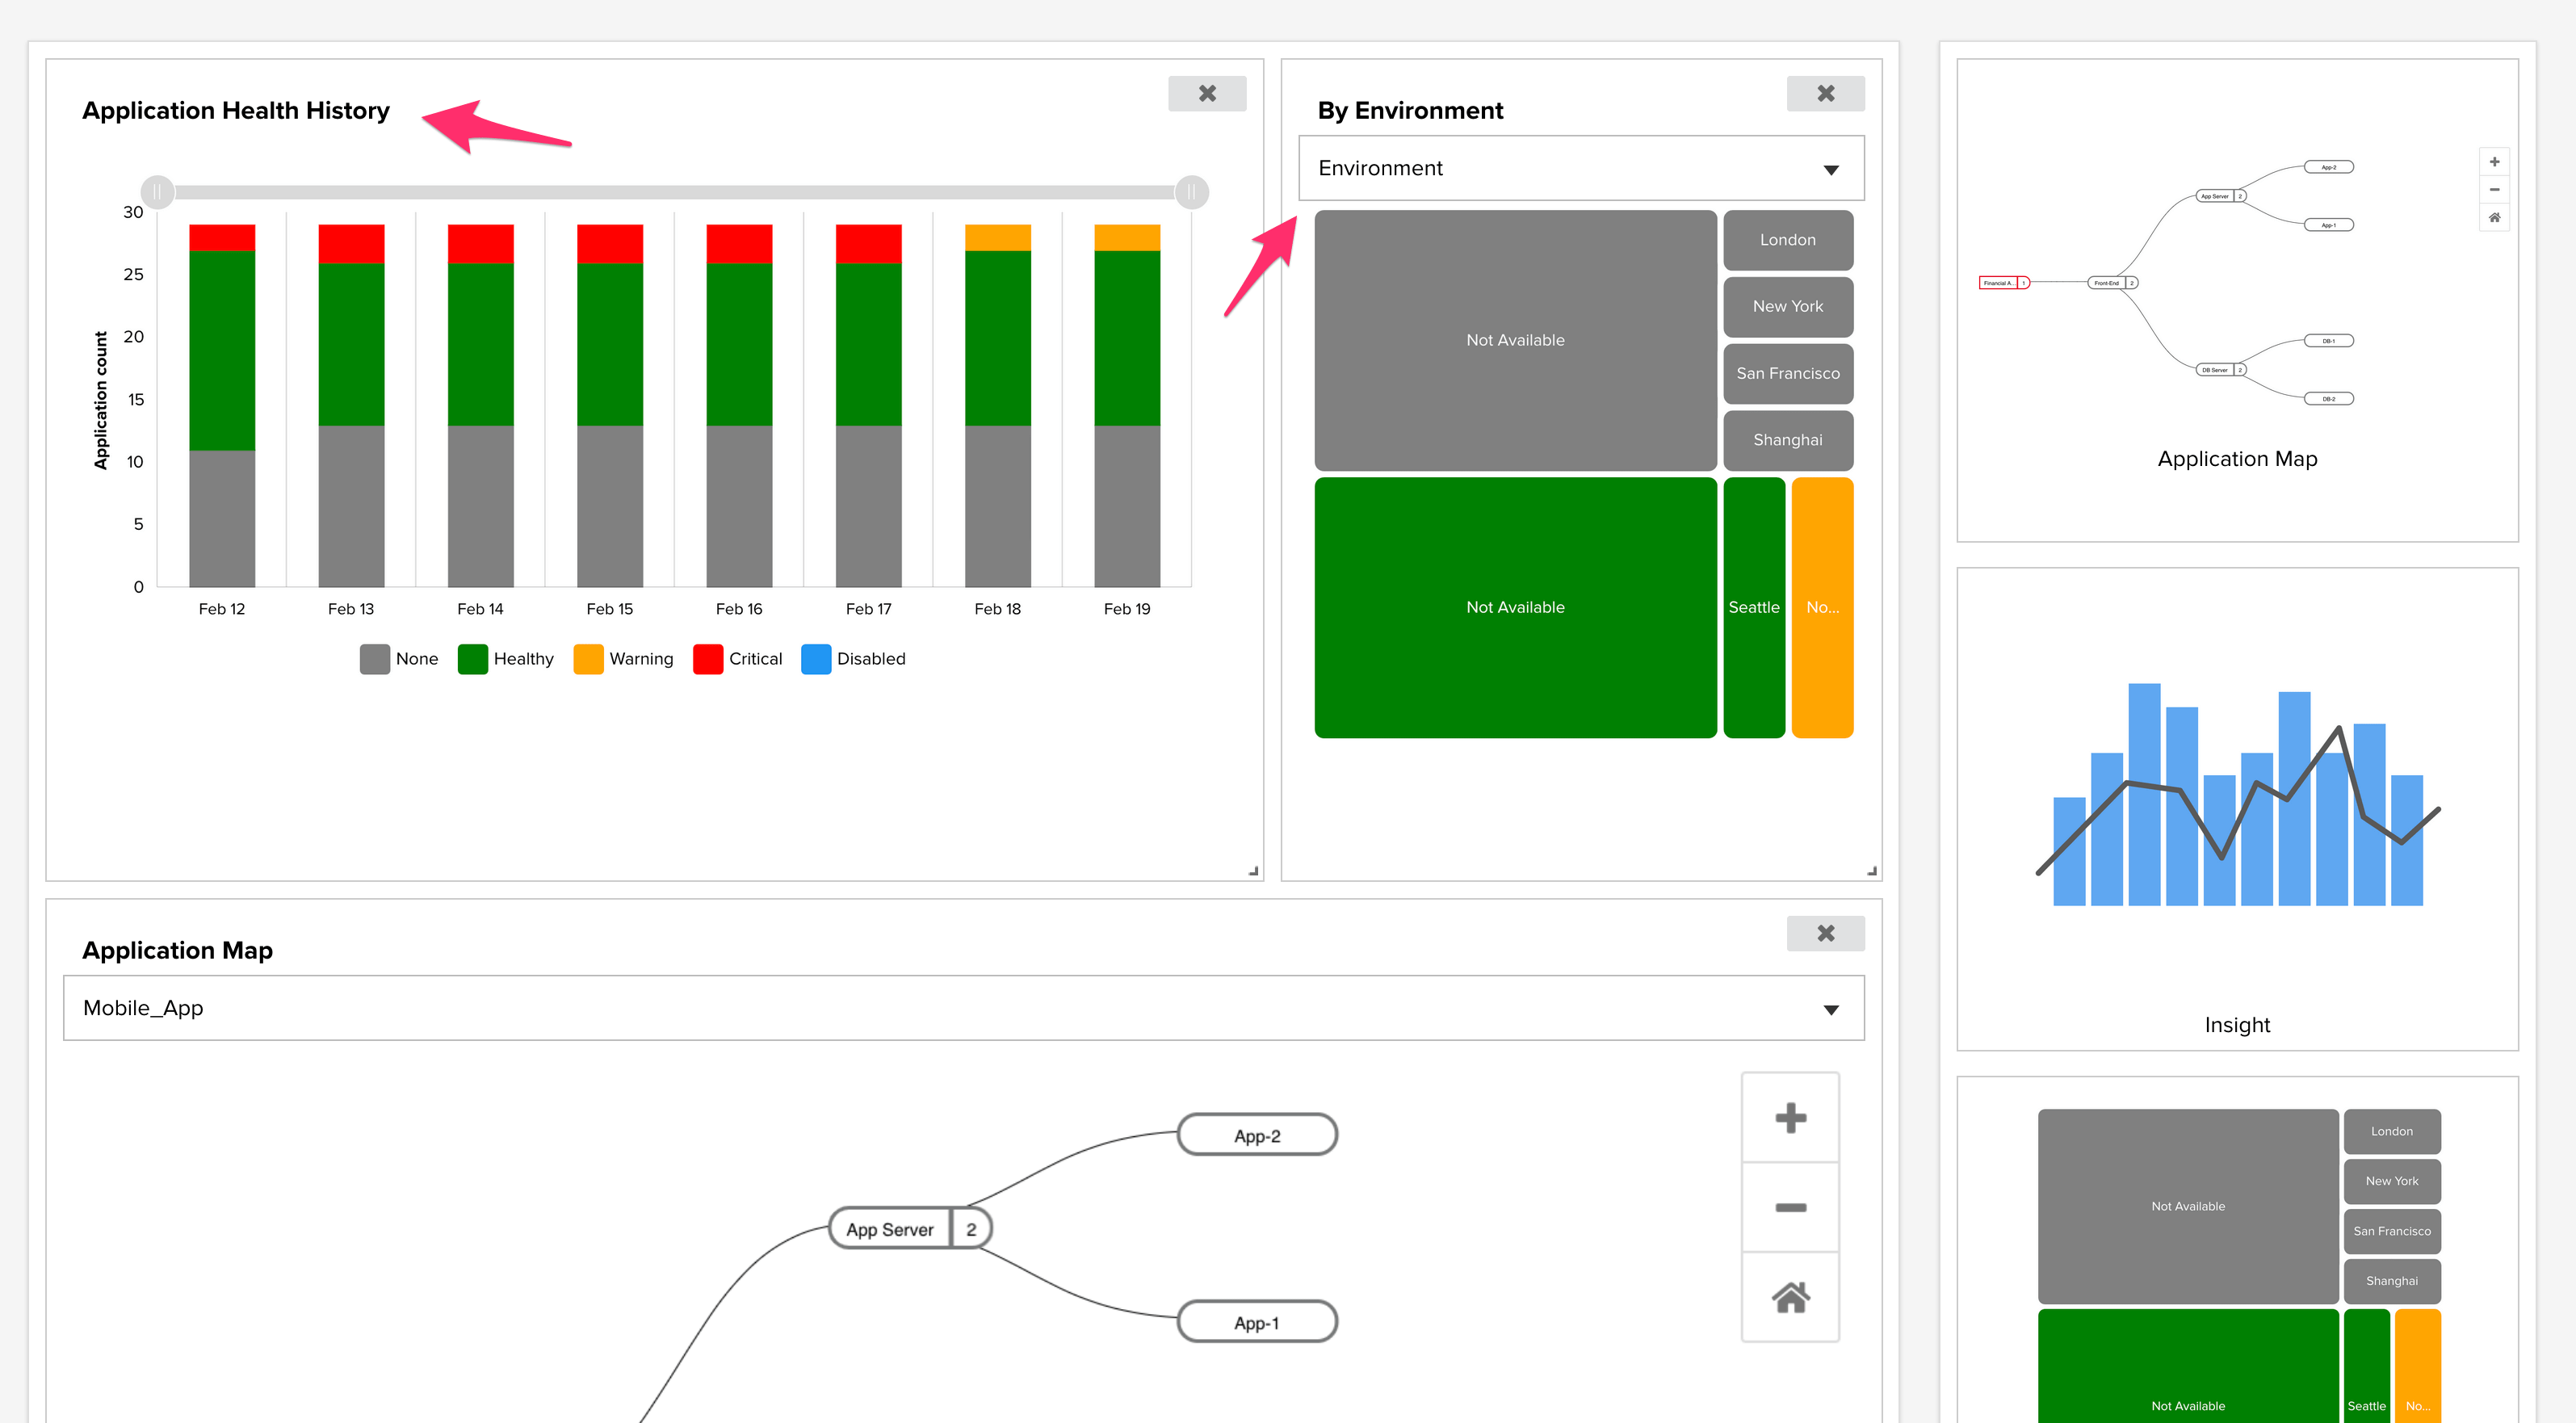
Drag the Application Health History and Application Current Health widgets above the Application Map and then set the Health widget drop-down to Environment. This will make the widget highlight the health of your applications by the Environment label that we set earlier.
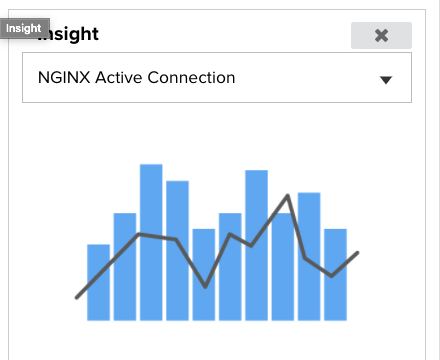
If you created any Insights throughout the data ingestion sections of this guide, you can add them to the dashboard by dragging the Insight widget onto the dashboard. Make sure to click the dropdown to select which Insight you would like to be shown.
In the top right click Save Dashboard
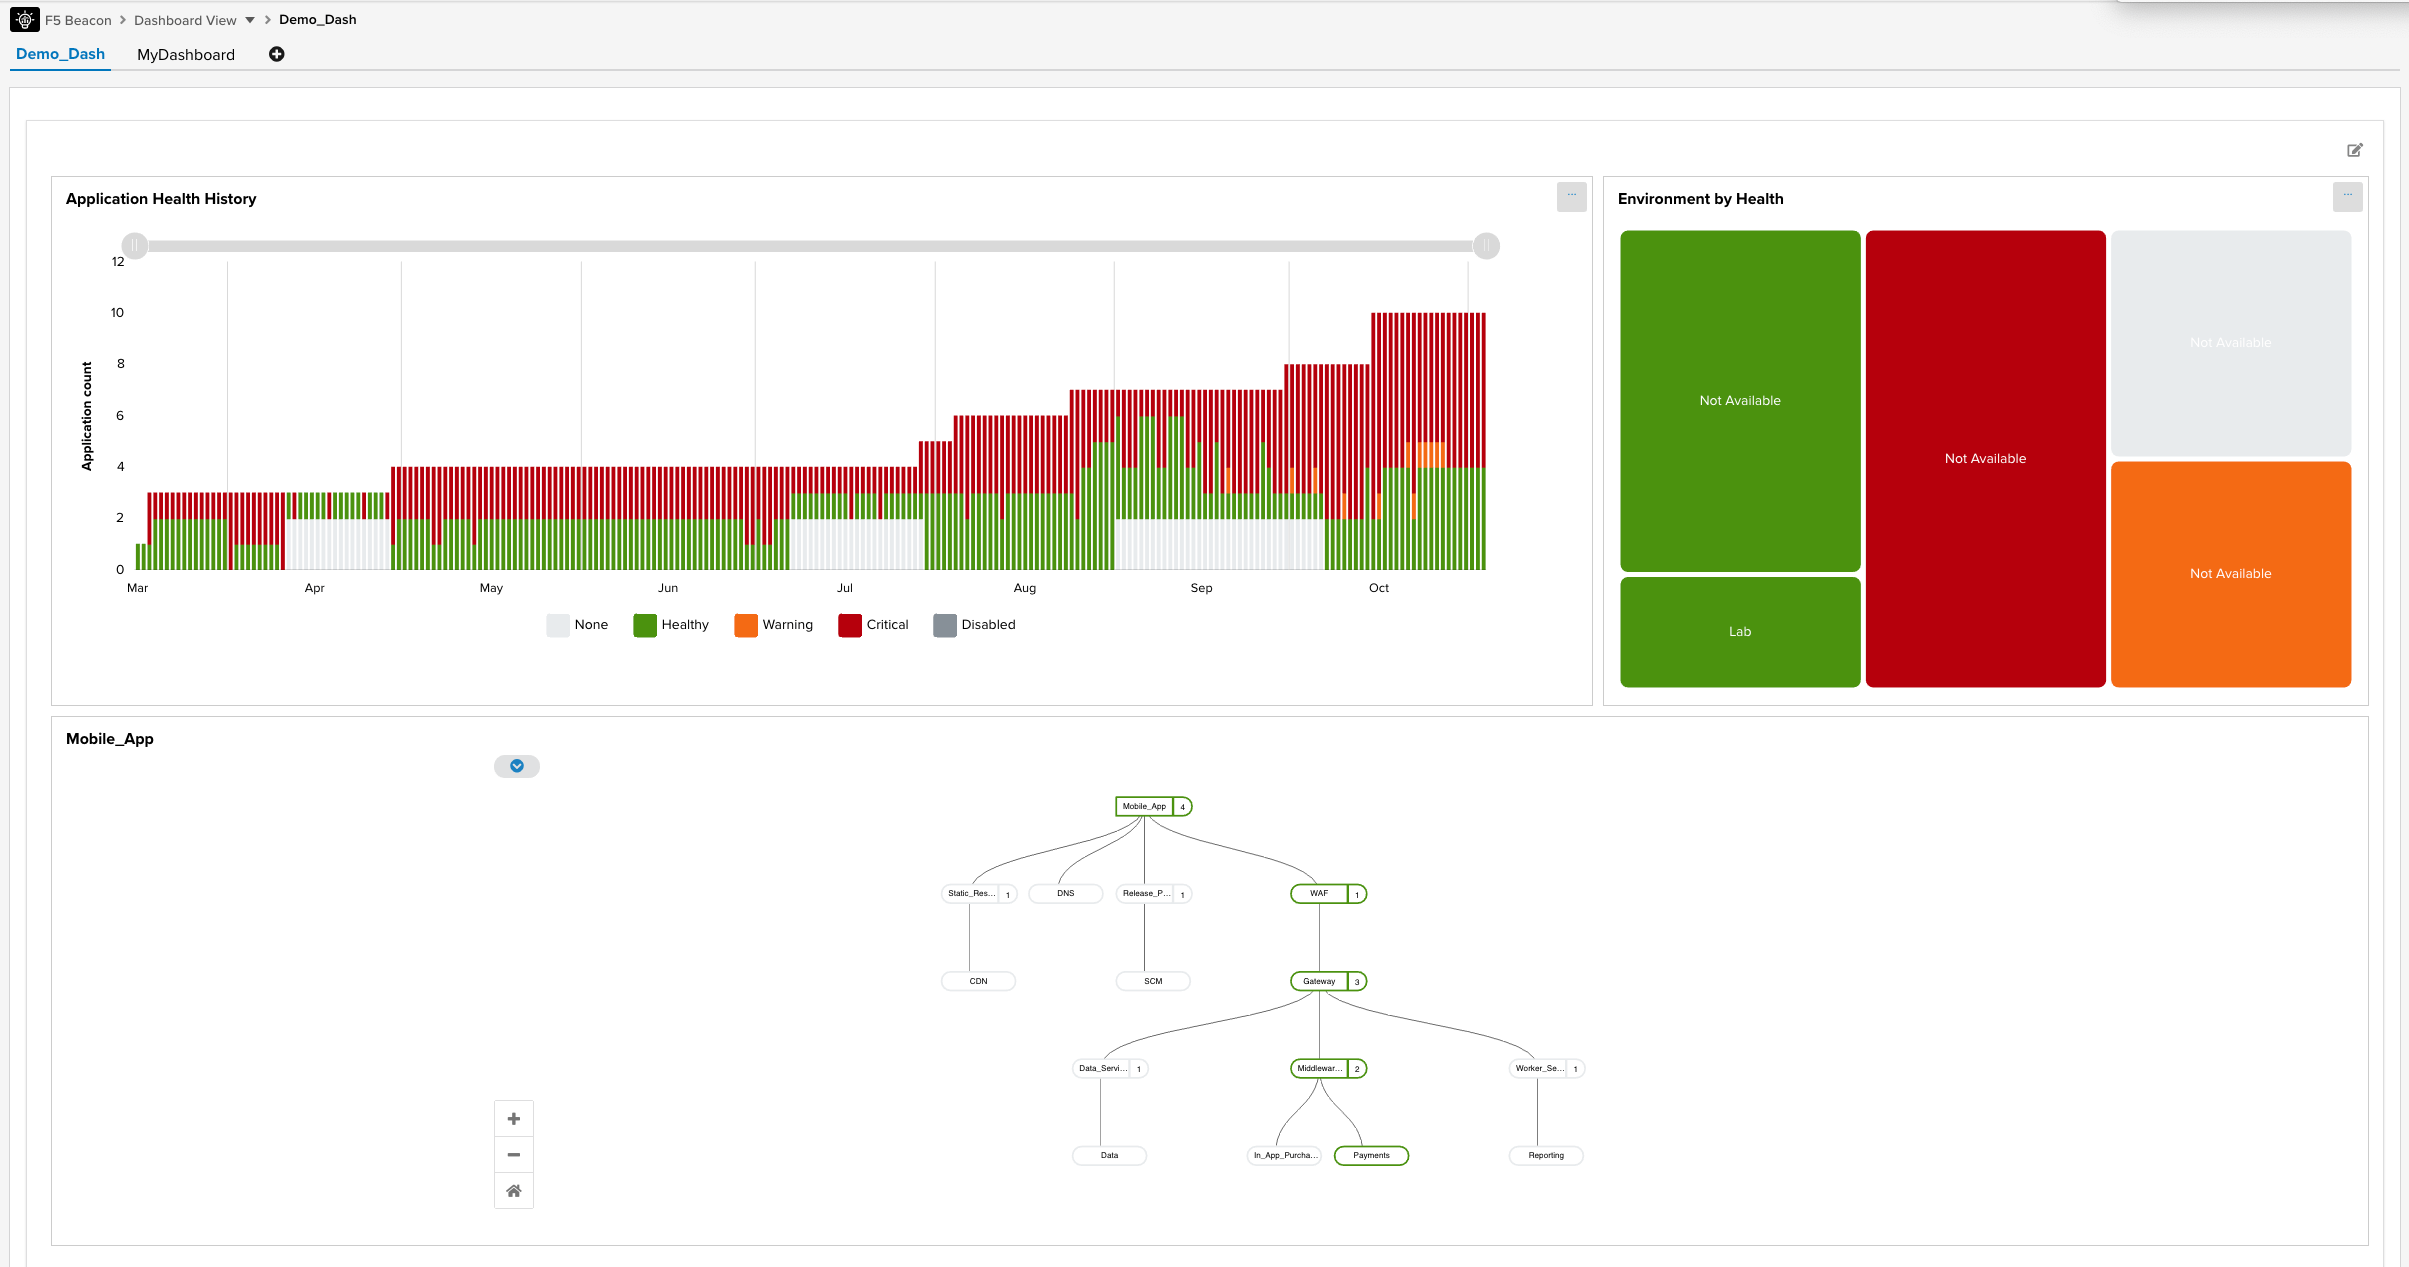
To view our dashboard, navigate to Dashboard View and then select the Demo_Dash. You will see the following objects:
- Health History: This may be red as we were marking some services offline during testing.
- Environment by Health: This shows that our Lab environment has 1 App in good state.
- Application Map: This shows the Mobile_App that we created with the state of the objects we provisioned.
- Application Details: This shows the relevant Applications and allows you to drill into them by clicking on the given rows.
Note
Your status and populated Application Components may look different depending on which data sources you chose to ingest as part of this guide. As you create more Applications and ingest more data the widgets will provide better history of the environment status over time.
Prior to F5 Beacon, the process of viewing the overall health of an entire application would be extremely time consuming and could involve many teams, tools, and processes. Not only can you view your environments and applications in custom made dashboards, but you can begin getting insights provided by F5 Beacon to help you improve and understand how your Applications exist today.