Telegraf Metric Ingestion
Gathering additional metrics to ingest into Beacon is easily accomplished using an open source integration with Telegraf. Telegraf supports 200+ plugins to help collect the metrics that mean the most to your applications. Plugins are modular ways to update Telegraf to tell it what data to collect (input plugin) and where to send it (output plugin). Telegraf’s agent can run directly on the server, VM, or container from which you wish to collect metrics or in a centralized location that polls the desired services. For our example, we will use Telegraf to collect metrics from a Ubuntu VM running NGINX. Telegraf by default will also collect system metrics such as CPU and memory. The guide below will still collect those metrics even if you do not have NGINX installed.
What You Will Do
- Update NGINX with stub_status page (Provides an API endpoint for metric collection)
- Install Telegraf
- Configure Telegraf to collect NGINX metrics
- Configure Telegraf to send metrics to Beacon
- Create an insight with the NGINX metrics ingested
What You Will Need
- A server/VM/container running NGINX (NGINX Installation)
- Must be able to reach Beacon
Note
Some of the commands or directories may be slightly different depending on your instance
Configure NGINX
For our example we are using a fresh install of NGINX. Prior to starting make sure that you can reach the default index page for NGINX. This will allow you to generate metrics at the end of this section by hitting your webserver.
NGINX recommends that you break up your configuration into different files instead of having one large config file within /etc/nginx/nginx.conf. To follow these guidelines, we are going to leave the default config file alone and create a new file just for our NGINX status page called /etc/nginx/conf.d/status.conf. This allows us to have a single place to look for the changes we are making.
Create a new file /etc/nginx/conf.d/status.conf and add the contents below. This will tell NGINX that if it receives a request to /status on port 8485 that it should return status metrics.
/etc/nginx/conf.d/status.conf
server {
    listen 8485;
    location /status {
        stub_status;
        allow 127.0.0.1;
    }
}

Make sure to save the file.
Restart your NGINX service. For Ubuntu use the following command:
sudo systemctl restart nginx
We will verify that our new status page is responding properly by using CURL. Your output should looks similar to below:
curl http://localhost:8485/status
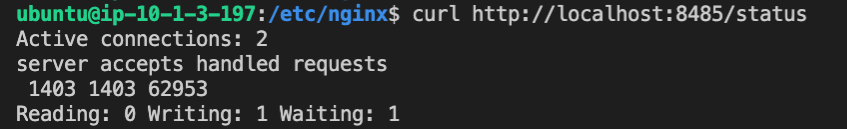
NGINX is now ready for Telegraf to collection metrics from it and forward them to Beacon.
Install Telegraf
If you are using something other than Ubuntu please follow installation instructions here.
Add the InfluxData repository with the following commands (this tells Ubuntu where to find the install files for Telegraf).
wget -qO- https://repos.influxdata.com/influxdb.key | sudo apt-key add -
source /etc/lsb-release
echo "deb https://repos.influxdata.com/${DISTRIB_ID,,} ${DISTRIB_CODENAME} stable" | sudo tee /etc/apt/sources.list.d/influxdb.list
There should be no errors in the output from the commands above.
Install and start the Telegraf service
sudo apt-get update && sudo apt-get install telegraf
sudo systemctl start telegraf
At this point Telegraf is collecting system metrics such as CPU, Memory, Disk, etc from your instance but does not have anywhere to send them. We need to tell Telegraf to gather the NGINX status as well and then forward metrics to Beacon to be used within Insights.
Configure Telegraf
Telegraf recommends breaking up configuration files in the same way that NGINX does. There is a primary configuration file /etc/telegraf/telegraf.conf which then points to additional files within the /etc/telegraf/telegraf.d directory. We will be placing 2 configuration files in this directory. One to tell Telegraf to collect NGINX metrics (input plugin) and one to tell Telegraf to forward metrics to Beacon (output plugin). Feel free to review the default config file to see some of the defaults that Telegraf uses such as how often it polls for metrics. By default Telegraf will use the systems hostname as the source of the traffic it sends as output.
Create a new file /etc/telegraf/telegraf.d/nginx.conf for the NGINX input plugin and save the contents below into it.
[[inputs.nginx]]
  urls = ["http://localhost:8485/status"]
  response_timeout = "5s"
This is the NGINX input plugin telling Telegraf to collect the metrics from page we created in the first part of this section.
Create a new file /etc/telegraf/telegraf.d/beacon.conf for the Beacon output plugin and save the contents below into it. You will need to update the X-F5_Ingestion-Token with the data_ingest Token that you created in the first parts of this guide.
Note
You can retrieve this Token again by navigating to Configuration >> Tokens and selecting the data_ingest token.
[[outputs.http]]
  url = "https://ingestion.ovr.prd.f5aas.com:50443/beacon/v1/ingest-metrics"
  timeout = "120s"
  method = "POST"
  insecure_skip_verify = true
  data_format = "influx"
  content_encoding = "identity"
[outputs.http.headers]
  Content-Type = "text/plain; charset=utf-8"
  X-F5-Ingestion-Token = "<Your_Token>"
This is the Beacon output plugin telling Telegraf to send metrics that it collects to Beacon.
Afterwards your /etc/telegraf/ directory tree should look similar to the following:
.
├── telegraf.conf
└── telegraf.d
    ├── beacon.conf
    └── nginx.conf

1 directory, 3 files
Restart the Telegraf service so it picks up the new changes.
sudo systemctl start telegraf
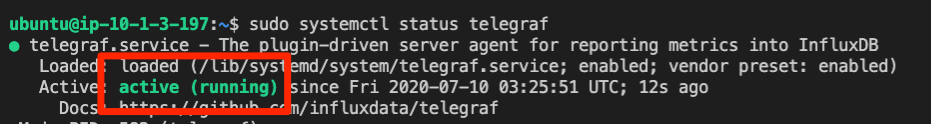
There should be no output from this command. You can verify Telegraf is running properly by running the following command and ensuring it says “active”.
sudo systemctl status telegraf
To verify Beacon is receiving the data, we will next log back into the Beacon Portal. Navigate to Configuration >> Sources. You should see a new entry from the hostname of your server running nginx. For our example our servers hostname was mobileapp-web. You can see the Source hostname along with a Type of Telegraf.
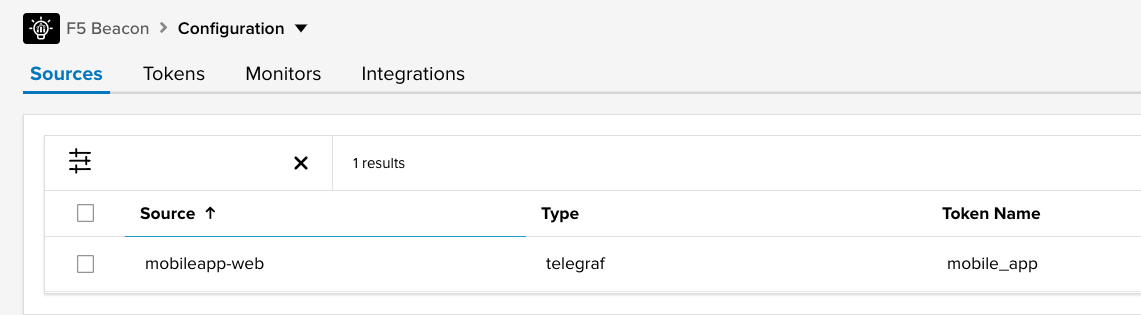
Note that other sources may be listed as well (BIG-IP, Beacon Monitor, etc) depending on which parts of the guide you have completed.
Viewing the Data
Now that Beacon is receiving metrics from Telegraf, let’s create an Insight to help visualize it.
In the portal navigate to Insights and click Create in the top right.
On this page we will build a query to show us data coming from Telegraf. We will keep this example simple as more advanced ones will be covered in the Insights section of this guide. Fill in the forms as below:
- Source Type allows you to select which type of data you would like to see (nginx, BIG-IP, monitor, etc). Find nginx and select it. This tells Beacon that you would like to see metric data coming from the NGINX plugin.
- Metric represents which data point you would like to track. In this example lets use active so we can see active connections.
- Filter is used to filter your data down to the specific host, token, server, port that you would like to see. This will become more helpful when you have multiple servers sending data. For now lets select host as your servers hostname (our servers hostname was “mobilewapp-web”).
- Functions tells Beacon how to treat the large amount of metrics that come in. In our case we will use Mean to find the average.
Select the Run button. At first it may not seem like there is any data, but you may just need to update your time window of the insight. Modify the insight to use Last 1 day and then use the scroll bar to zoom in on the graph. The amount of connections will depend on the use of your NGINX server. You can cause increases in this chart by hitting the index page of your webserver and then checking in Beacon again.
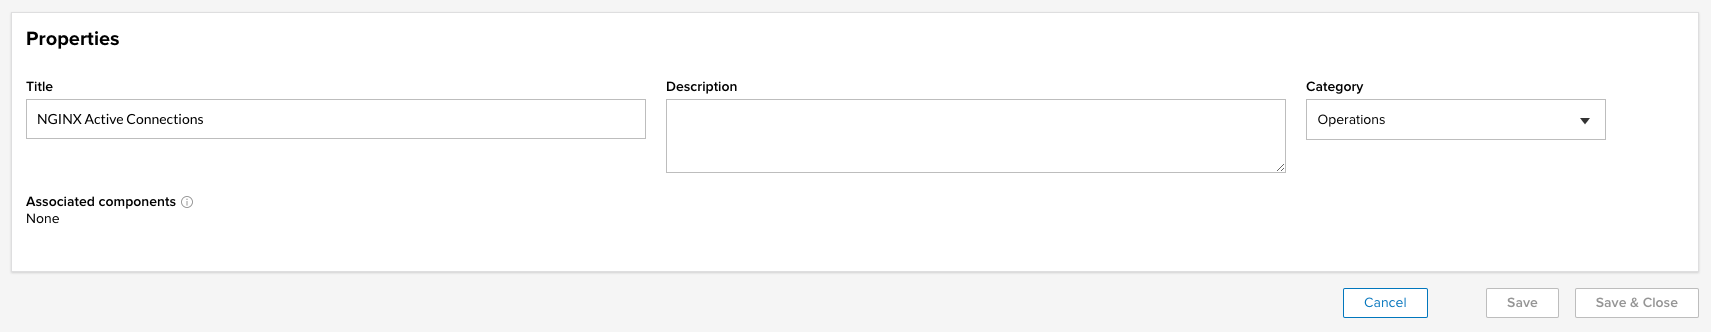
At the bottom of the page under Properties put fill in the blanks as below and click Save to reference this insight in the future.
- Title: “NGINX Active Connections”
- Category: “Operations”
More advanced settings and usage of insights will be covered within a later section of this guide. The primary intent of this section was to ingest NGINX data from Telegraf and visualize it within the portal.
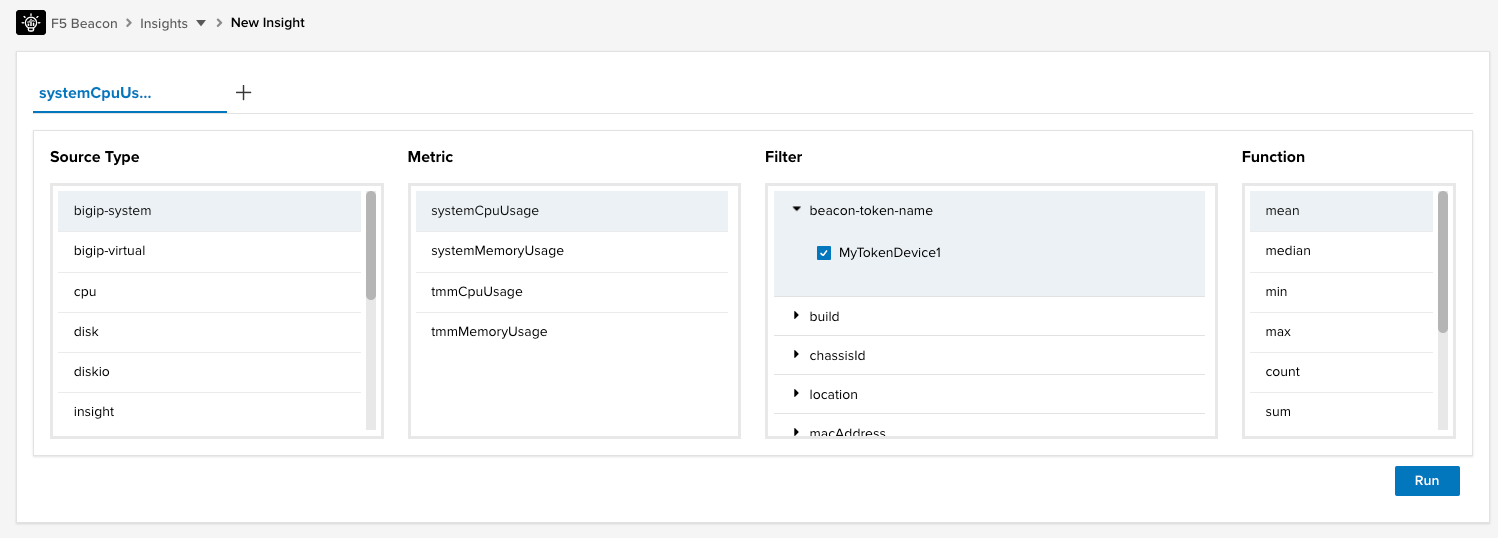
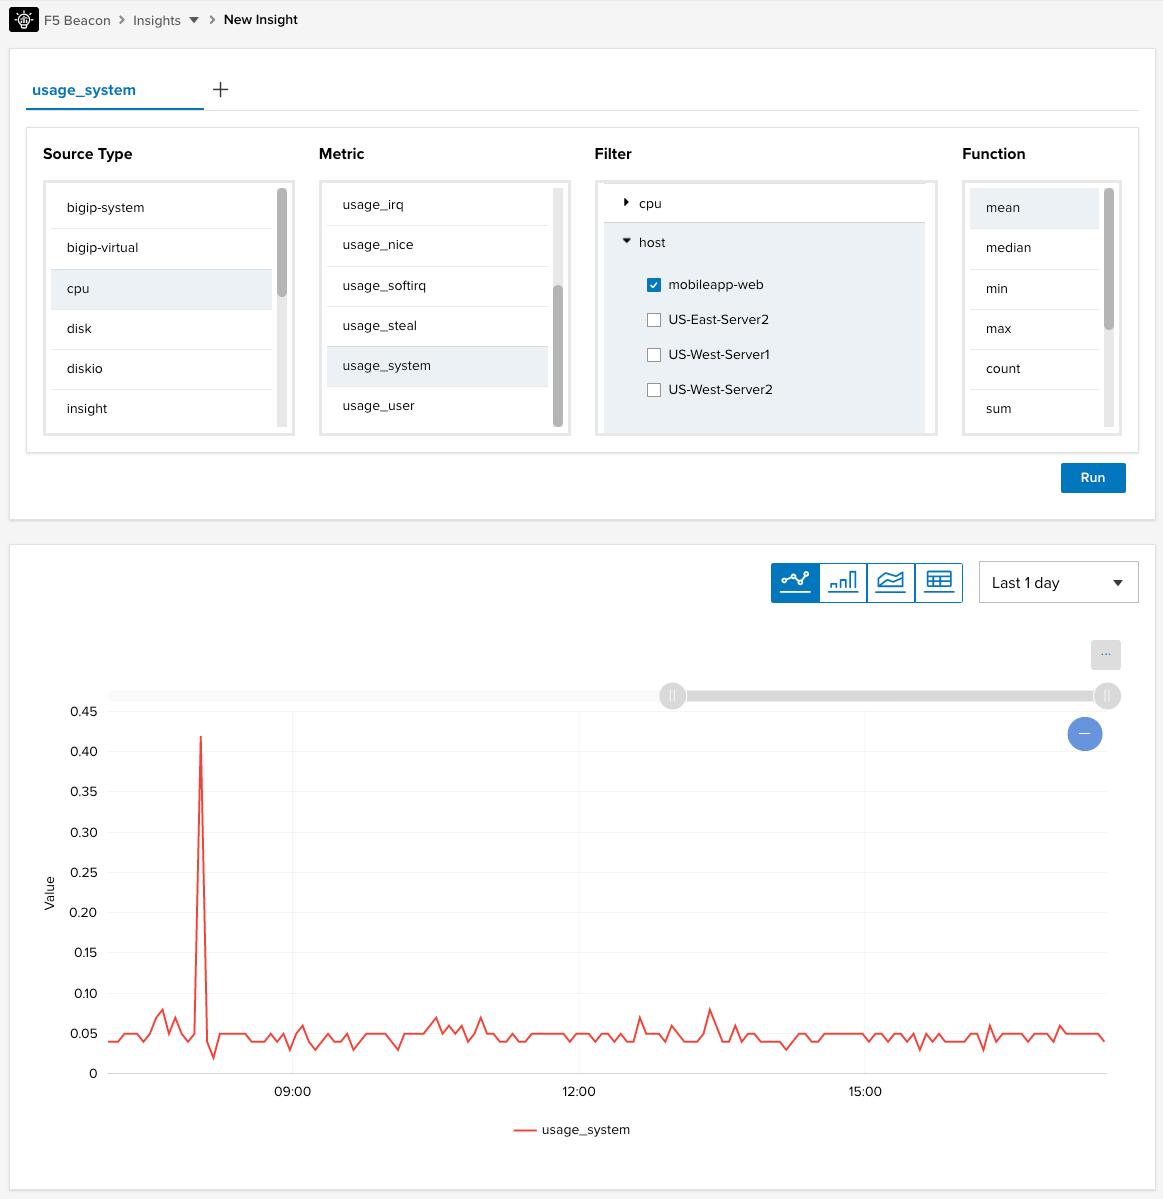
Last we will Create another Insight to view the System CPU of our Ubuntu machine. Within the portal on the Insights page select Create gain. This time use the following fields to see your CPU metrics:
- Source Type : cpu
- Metric usage_system
- Filter host: <your servers hostname>
- Functions: Mean
Make sure to adjust the time range to Last 1 day and zoom in on the timeline if the agent has not been long lived at this point.
At this point you have successfully configured Telegraf to ingest System and NGINX data and send it to Beacon. Telegraf is extremely powerful and can perform data manipulation, aggregation, and more. With minimal effort you are able to leverage the 200+ plugins offered to get the data that truly represents your applications. It is as easy as adding a new input config file to Telegraf and restarting the service. Since you already configured it to send to Beacon, all new metrics added will automatically be sent. Navigate back to the Data Ingestion to F5 Beacon page to add more sources of data to our Mobile_App or proceed to Creating Dashboards in F5 Beacon to put this application into an F5 Beacon Dashboard.