Push Consumers
Use this section to find example declarations and notes for supported push-based consumers. See Pull Consumers for pull-based consumers.
Important
Each of the following examples shows only the Consumer class of a declaration and must be included with the rest of the base declaration (see Components of the declaration).
Use the index on the right to locate a specific consumer.
Default Push Consumer
This example shows how to use the default push consumer. For the default push consumer, the type must be default in the Consumer class as shown.
The primary use case of such type of push consumer is troubleshooting.
Example declaration:
{
    "class": "Telemetry",
    "My_Poller": {
        "class": "Telemetry_System_Poller"
    },
    "My_System": {
        "class": "Telemetry_System",
        "enable": "true",
        "systemPoller": ["My_Poller"]
    },
    "My_Push_Consumer": {
        "class": "Telemetry_Consumer",
        "type": "default"
    }
}
Splunk
![]()
- Required information:
- Host: The address of the Splunk instance that runs the HTTP event collector (HEC).
- Protocol: Check if TLS is enabled within the HEC settings Settings > Data Inputs > HTTP Event Collector.
- Port: Default is 8088, this can be configured within the Global Settings section of the Splunk HEC.
- API Key: An API key must be created and provided in the passphrase object of the declaration, refer to Splunk documentation for the correct way to create an HEC token.
If you want to specify proxy settings for Splunk consumers in BIG-IP TS 1.17 and later, see the Splunk Proxy example.
Note
When using the custom endpoints feature, be sure to include /mgmt/tm/sys/global-settings in your endpoints for BIG-IP Telemetry Streaming to be able to find the hostname.
Additions to the Splunk consumer
The following items have been added to the Splunk consumer since it was introduced.
| Version | Property | Description |
|---|---|---|
| 1.19 | compressionType | Sets the type of compression. Be sure to see Memory usage spikes in the Troubleshooting section for information on the compressionType property. When set to none, this property stops BIG-IP TS from compressing data before sending it to Splunk, which can help reduce memory usage. |
IMPORTANT: The following declaration includes the additional properties shown in the table. If you attempt to use this declaration on a previous version, it will fail. On previous versions, remove the highlighted line(s), and the comma from the previous line.
Example Declaration:
{
    "class": "Telemetry",
    "My_Consumer": {
        "class": "Telemetry_Consumer",
        "type": "Splunk",
        "host": "192.168.2.1",
        "protocol": "https",
        "port": 8088,
        "passphrase": {
            "cipherText": "apikey"
        },
        "compressionType": "gzip"
    }
}
Splunk Legacy format (Deprecated)
Important
The Splunk Legacy format has been deprecated as of BIG-IP Telemetry Streaming 1.17, and has entered maintenance mode. This means there will be no further BIG-IP TS development for the Splunk Legacy format.
We recommend using the Splunk default format, or Splunk multi-metric format.
The format property can be set to legacy for Splunk users who wish to convert the stats output similar to the F5 Analytics App for Splunk. To see more information, see F5 Analytics iApp Template documentation. To see more information about using the HEC, see Splunk HTTP Event Collector documentation. See the following example.
To poll for any data involving tmstats you must have a Splunk consumer with the legacy format as described in this section. This includes GET requests to the SystemPoller API because the data is not pulled unless it is a legacy Splunk consumer.
BIG-IP Telemetry Streaming 1.7.0 and later gathers additional data from tmstats tables to improve compatibility with Splunk Legacy consumers.
In BIG-IP Telemetry Streaming v1.6.0 and later, you must use the facility parameter with the legacy format to specify a Splunk facility in your declarations. The facility parameter is for identification of location/facility in which the BIG-IP is located (such as ‘Main Data Center’, ‘AWS’, or ‘NYC’).
If a Splunk Consumer is configured with the legacy format, then it ignores events from Event Listener.
- Required information for facility:
- The facility parameter must be inside of actions and then setTag as shown in the example.
- The value for facility is arbitrary, but must be a string.
- The locations property must include
"system": true, as that is where facility is expected. - The value for facility is required when the format is legacy (required by the Splunk F5 Dashboard application; a declaration without it will still succeed)
Example Declaration for Legacy (including facility):
{
    "class": "Telemetry",
      "My_System": {
          "class": "Telemetry_System",
          "systemPoller": {
            "interval": 60,
            "actions": [
              {
                "setTag": {
                  "facility": "facilityValue"
                },
                "locations": {
                  "system": true
                }
              }
            ]
          }
      },
      "My_Consumer": {
          "class": "Telemetry_Consumer",
          "type": "Splunk",
          "host": "192.168.2.1",
          "protocol": "https",
          "port": 8088,
          "passphrase": {
              "cipherText": "apikey"
          },
          "format": "legacy"
      }
  }
Splunk multi-metric format
Important
Splunk multi-metric format requires Splunk version 8.0.0 or later.
BIG-IP Telemetry Streaming 1.17 introduced the ability to use Splunk multi-metric format (experimental in BIG-IP TS 1.17-1.24) for Splunk 8.0.0 and later. Splunk multi-metric format allows each JSON object to contain measurements for multiple metrics, which generate multiple-measurement metric data points, taking up less space on disk and improving search performance.
See the Splunk documentation for more information.
Warning
Only canonical (default) system poller output is supported. Custom endpoints are NOT supported with the multi-metric format.
To use this feature, the format of the Splunk Telemetry_Consumer must be set to multiMetric as shown in the example.
Example Declaration for Splunk multi-metric:
{
    "class": "Telemetry",
      "My_System": {
          "class": "Telemetry_System",
          "systemPoller": {
            "interval": 60,
            "actions": [
              {
                "setTag": {
                  "facility": "facilityValue"
                },
                "locations": {
                  "system": true
                }
              }
            ]
          }
      },
      "My_Consumer": {
          "class": "Telemetry_Consumer",
          "type": "Splunk",
          "host": "192.168.2.1",
          "protocol": "https",
          "port": 8088,
          "passphrase": {
              "cipherText": "apikey"
          },
          "format": "multiMetric"
      }
  }
Microsoft Azure Log Analytics
![]()
- Required Information:
- Workspace ID: Navigate to Log Analytics workspace > [your workspace] > Agents Management > Workspace ID.
- Shared Key: Navigate to Log Analytics workspace > [your workspace] > Agents Management > Primary key.
Important
The Azure Log Analytics Consumer only supports sending 500 items. Each configuration item (such as virtual server, pool, node) uses part of this limit.
Additions to the Azure Log Analytics consumer
The following items have been added to the Azure Log Analytics consumer since it was introduced.
| BIG-IP TS Version | Property | Description |
|---|---|---|
| 1.24 | format | This was added to reduce the number of columns in the output which prevents a potential Azure error stating Data of Type F5Telemetry was dropped because number of field is above the limit of 500. The values for format are: |
| default: This is the default value, and does not change the behavior from previous versions. In this mode, each unique item gets a set of columns. With some properties such as Client and Server SSL profiles, the number of columns exceeds the maximum allowed by Azure. For example, with a CA bundle certificate, there may be fields for expirationDate, expirationString, issuer, name, and subject. BIG-IP TS creates a column named ca-bundle_crt_expirationDate and four additional columns for the other four properties. The name value is a prefix for every column. |
||
| propertyBased - This value causes BIG-IP Telemetry Streaming to create fewer columns by using the property name for the column. In the example above, the column (property) name is just expirationDate, and all certificates use this column for the expiration dates. Note this happens only if the property name exists, and it matches the declared object name at the top. Otherwise, the naming mode goes back to default. |
||
| 1.24 | region | The region property for Azure Log Analytics and Application Insights was added in part to support the Azure Government regions. - This optional property is used to determine cloud type (public/commercial, govcloud) so that the correct API URLs can be used (example values: westeurope, japanwest, centralus, usgovvirginia, and so on). - If you do not provide a region, BIG-IP Telemetry Streaming attempts to look it up from the instance metadata. - If it is unable to extract metadata, BIG-IP TS defaults to public/commercial - Check the Azure Products Available by Region for product/region compatibility for Azure Government. - See the Azure documentation for a valid list of regions (resource location), and Region list for example values from the Azure CLI. |
To see more information about sending data to Log Analytics, see HTTP Data Collector API documentation.
Important
The following example has been updated with the useManagedIdentity, region, and format properties. You must be using a BIG-IP TS version that supports these properties (BIG-IP TS 1.24 for format)
See Using Managed Identities following the example for information about using Azure Managed Identities and BIG-IP Telemetry Streaming.
Example Declaration:
{
    "class": "Telemetry",
    "My_Consumer": {
        "class": "Telemetry_Consumer",
        "type": "Azure_Log_Analytics",
        "workspaceId": "workspaceid",
        "passphrase": {
            "cipherText": "sharedkey"
        },
        "useManagedIdentity": false,
        "region": "westus",
        "format": "propertyBased",
        "managementEndpointUrl": "https://custom-management.azure.com",
        "odsOpinsightsEndpointUrl": "https://custom-guid.ods.opinsights.azure.com"
    }
}
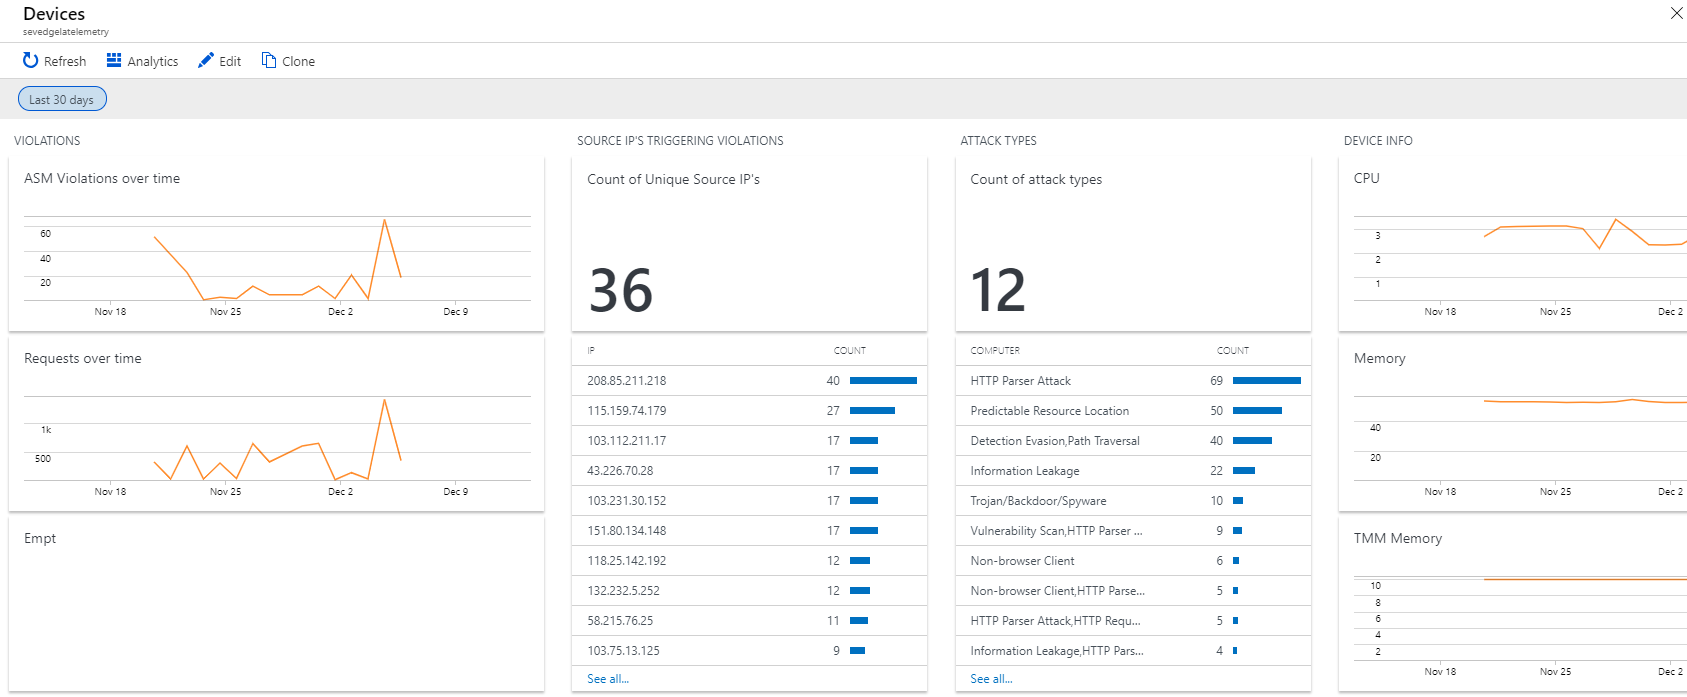
Example Dashboard:
The following is an example of the Azure dashboard with BIG-IP Telemetry Streaming data. To create a similar dashboard, see Azure dashboard. To create custom views using View Designer, see Microsoft documentation.
Using Microsoft Managed Identities for Log Analytics
F5 BIG-IP Telemetry Streaming v1.11 adds support for sending data to Azure Log Analytics with an Azure Managed Identity. For specific information on Managed Identities, see Microsoft documentation.
Important: The managed identity assigned to the VM must have at the minimum, the following permissions (see the Azure documentation for detailed information):
- List subscriptions
- List workspaces for the subscription(s)
- Log Analytics Contributor for the workspace (either at the Workspace resource level or inherited via resource group)
F5 BIG-IP Telemetry Streaming supports Managed Identities using a new useManagedIdentity property, set to true. You cannot specify a passphrase when this property is set to true. You must specify passphrase when this property is omitted or when value is false. If you do not include this property at all, BIG-IP Telemetry Streaming behaves as though the value is false.
Example Declaration:
{
    "class": "Telemetry",
    "My_Consumer": {
        "class": "Telemetry_Consumer",
        "type": "Azure_Log_Analytics",
        "workspaceId": "workspaceid",
        "useManagedIdentity": true
    }
}
Microsoft Azure Application Insights
![]()
Required Information:
- Instrumentation Key: If provided, Use Managed Identity must be false or omitted (default). Navigate to Application Insights > {AppinsightsName} > Overview
- Use Managed Identity: If true, Instrumentation Key must be omitted. See Managed Identities for App Insight.
Optional Properties:
- MaxBatch Size: The maximum number of telemetry items to include in a payload to the ingestion endpoint (default: 250)
- Max Batch Interval Ms: The maximum amount of time to wait in milliseconds to for payload to reach maxBatchSize (default: 5000)
- App Insights Resource Name: Name filter used to determine to which App Insights resource to send metrics. If not provided, BIG-IP TS will send metrics to App Insights in the subscription in which the managed identity has permissions. Note: To be used only when useManagedIdentity is true.
- customOpts: Additional options for use by consumer client library. These are passthrough options (key value pair) to send to the Microsoft node client.
Warning
The customOpts options are not guaranteed to work and may change according to the client library API; you must use these options with caution. Refer to corresponding consumer library documentation for acceptable keys and values.
To see more information about Azure Application Insights, see Microsoft documentation.
Additions to the Application Insights consumer
The following items have been added to the Azure Application Insights consumer since it was introduced.
| BIG-IP TS Version | Property | Description |
|---|---|---|
| 1.24 | region | The region property for Azure Log Analytics and Application Insights was added in part to support the Azure Government regions. - This optional property is used to determine cloud type (public/commercial, govcloud) so that the correct API URLs can be used (example values: westeurope, japanwest, centralus, usgovvirginia, and so on). - If you do not provide a region, BIG-IP Telemetry Streaming attempts to look it up from the instance metadata. - If it is unable to extract metadata, BIG-IP TS defaults to public/commercial - Check the Azure Products Available by Region for product/region compatibility for Azure Government. - See the Azure documentation for a valid list of regions (resource location), and Region list for example values from the Azure CLI. |
IMPORTANT: The following declaration includes the additional properties shown in the table. If you attempt to use this declaration on a previous version, it will fail. On previous versions, remove the highlighted line(s), and the comma from the previous line.
Example Declaration:
{
    "class": "Telemetry",
    "My_Consumer": {
        "class": "Telemetry_Consumer",
        "type": "Azure_Application_Insights",
        "instrumentationKey": "app-insights-resource-guid",
        "maxBatchSize": 125,
        "maxBatchIntervalMs": 30000,
        "customOpts": [
            {
                "name": "samplingPercentage",
                "value": 75
            }
        ],
        "useManagedIdentity": false,
        "region": "usgovarizona",
        "managementEndpointUrl": "https://custom-management.azure.com"
    }
}
Using Microsoft Managed Identities for Application Insights
F5 BIG-IP Telemetry Streaming v1.11 also adds support for sending data to Azure Application Insights with an Azure Managed Identity. For specific information on Managed Identities, see Microsoft documentation.
Important: The managed identity assigned to the VM must have at the minimum, the following permissions (see the Azure documentation for detailed information):
- List Microsoft.Insight components for subscription(s), for example the Monitoring Reader role
- Push metrics to the App Insights resource, for example the Monitoring Metrics Publisher role
F5 BIG-IP Telemetry Streaming supports Managed Identities using a new useManagedIdentity property, set to true. You cannot specify an instrumentationKey when this property is set to true. You must specify instrumentationKey when this property is omitted or when the value is false. If you do not include this property at all, BIG-IP Telemetry Streaming behaves as though the value is false. You can optionally provide an appInsightsResourceName to limit which App Insights resource(s) to send metrics to. Without the filter, metrics will be sent to all App Insights resources to which the managed identity has permissions.
Example Declaration:
{
    "class": "Telemetry",
    "My_Consumer": {
        "class": "Telemetry_Consumer",
        "type": "Azure_Application_Insights",
        "appInsightsResourceName": "app.*insights.*",
        "maxBatchSize": 125,
        "maxBatchIntervalMs": 30000,
        "customOpts": [
            {
                "name": "samplingPercentage",
                "value": 75
            }
        ],
        "useManagedIdentity": true
    }
}
AWS CloudWatch

AWS CloudWatch has two consumers: CloudWatch Logs, and CloudWatch Metrics. If you do not use the new dataType property, the system defaults to CloudWatch Logs.
Important
In BIG-IP TS 1.9.0 and later, the username and passphrase for CloudWatch are optional. This is because a user can send data from a BIG-IP that has an appropriate IAM role in AWS to AWS CloudWatch without a username and passphrase.
In BIG-IP TS 1.18 and later, the root certificates for AWS services are now embedded within F5 BIG-IP Telemetry Streaming and are the only root certificates used in requests made to AWS services per AWS’s move to its own Certificate Authority, noted in https://aws.amazon.com/blogs/security/how-to-prepare-for-aws-move-to-its-own-certificate-authority/.
Additions to the AWS CloudWatch consumer
The following items have been added to the CloudWatch consumer since it was introduced.
| BIG-IP TS Version | Property | Description |
|---|---|---|
| 1.25 | endpointUrl | This optional property for AWS CloudWatch (Logs and Metrics) allows you to specify the full AWS endpoint URL for service requests. In particular, it can be an interface VPC endpoint for AWS Direct Connect. See the following CloudWatch Logs and Metrics examples for usage. |
AWS CloudWatch Logs (default)
- Required information:
- Region: AWS region of the CloudWatch resource.
- Log Group: Navigate to CloudWatch > Logs
- Log Stream: Navigate to CloudWatch > Logs > Your_Log_Group_Name
- Username: Navigate to IAM > Users
- Passphrase: Navigate to IAM > Users
To see more information about creating and using IAM roles, see the AWS Identity and Access Management (IAM) documentation.
IMPORTANT: The following declaration includes the additional properties shown in the Additions to CloudWatch consumer table. If you attempt to use this declaration on a previous version, it will fail. On previous versions, remove the highlighted line(s), and the comma from the previous line.
Example Declaration:
{
    "class": "Telemetry",
    "My_Consumer": {
        "class": "Telemetry_Consumer",
        "type": "AWS_CloudWatch",
        "region": "us-west-1",
        "logGroup": "f5telemetry",
        "logStream": "default",
        "maxAwsLogBatchSize" : 100,
        "username": "accesskey",
        "passphrase": {
            "cipherText": "secretkey"
        },
        "endpointUrl": "https://your_VPC_endpoint_ID.logs.us-west-1.vpce.amazonaws.com"
    }
}
AWS CloudWatch Metrics
F5 BIG-IP Telemetry Streaming 1.14 introduced support for AWS CloudWatch Metrics. To specify CloudWatch Metrics, use the new dataType property with a value of metrics as shown in the example.
- Notes for CloudWatch Metrics:
- It can take up to 15 minutes for metrics to appear if they do not exist and AWS has to create them.
- You must use the dataType property with a value of metrics, if you do not specify metrics, the system defaults to Logs.
- Some properties are restricted so that you cannot use them with the wrong dataType (for example, you cannot use logStream when dataType: “metrics”)
- Required Information:
- Region: AWS region of the CloudWatch resource.
- MetricNamespace: Namespace for the metrics. Navigate to CloudWatch > Metrics > All metrics > Custom Namespaces
- DataType: Value should be metrics
- Username: Navigate to IAM > Users
- Passphrase: Navigate to IAM > Users
IMPORTANT: The following declaration includes the additional properties shown in the Additions to CloudWatch consumer table. If you attempt to use this declaration on a previous version, it will fail. On previous versions, remove the highlighted line(s), and the comma from the previous line.
Example Declaration:
{
    "class": "Telemetry",
    "My_Consumer": {
        "class": "Telemetry_Consumer",
        "type": "AWS_CloudWatch",
        "dataType": "metrics",
        "metricNamespace": "a-custom_namespace",
        "region": "us-west-1",
        "username": "accesskey",
        "passphrase": {
            "cipherText": "secretkey"
        },
        "endpointUrl": "https://your_VPC_endpoint_ID.monitoring.us-west-1.vpce.amazonaws.com"
    }
}
AWS S3
- Required Information:
- Region: AWS region of the S3 bucket.
- Bucket: Navigate to S3 to find the name of the bucket.
- Username: Navigate to IAM > Users
- Passphrase: Navigate to IAM > Users
To see more information about creating and using IAM roles, see the AWS Identity and Access Management (IAM) documentation.
Important
The username and passphrase for S3 are optional. This is because a user can send data from a BIG-IP that has an appropriate IAM role in AWS to AWS S3 without a username and passphrase.
The root certificates for AWS services are embedded within F5 BIG-IP Telemetry Streaming and are the only root certificates used in requests made to AWS services per AWS’s move to its own Certificate Authority, noted in https://aws.amazon.com/blogs/security/how-to-prepare-for-aws-move-to-its-own-certificate-authority/.
Additions to the AWS S3 consumer
The following items have been added to the S3 consumer since it was introduced.
| BIG-IP TS Version | Property | Description |
|---|---|---|
| 1.25 | endpointUrl | This optional property for AWS S3 allows you to specify the full AWS endpoint URL for service requests. In particular, it can be an interface VPC endpoint for AWS Direct Connect. |
IMPORTANT: The following declaration includes the additional properties shown in the table. If you attempt to use this declaration on a previous version, it will fail. On previous versions, remove the highlighted line(s), and the comma from the previous line.
Example Declaration:
{
    "class": "Telemetry",
    "My_Consumer": {
        "class": "Telemetry_Consumer",
        "type": "AWS_S3",
        "region": "us-west-1",
        "bucket": "bucketname",
        "username": "accesskey",
        "passphrase": {
            "cipherText": "secretkey"
        },
        "endpointUrl": "your_VPC_endpoint_ID.s3.us-west-1.vpce.amazonaws.com"
    }
}
Graphite

- Required Information:
- Host: The address of the Graphite system.
- Protocol: Check Graphite documentation for configuration.
- Port: Check Graphite documentation for configuration.
Note
To see more information about installing Graphite, see Installing Graphite documentation. To see more information about Graphite events, see Graphite Events documentation.
Example Declaration:
{
    "class": "Telemetry",
    "My_Consumer": {
        "class": "Telemetry_Consumer",
        "type": "Graphite",
        "host": "192.168.2.1",
        "protocol": "https",
        "port": 443
    }
}
Kafka
![]()
- Required Information:
- Host: The address of the Kafka system.
- Port: The port of the Kafka system.
- Topic: The topic where data should go within the Kafka system
- Protocol: The port of the Kafka system. Options: binaryTcp or binaryTcpTls. Default is binaryTcpTls
- Authentication Protocol: The protocol to use for authentication process. Options: SASL-PLAIN and None, and TLS in TS 1.17 and later. Default is None.
- Username: The username to use for authentication process.
- Password: The password to use for authentication process.
Note
To see more information about installing Kafka, see Installing Kafka documentation.
Additions to the Kafka consumer
The following items have been added to the Kafka consumer since it was introduced.
| BIG-IP TS Version | Property | Description |
|---|---|---|
| 1.17 | privateKey | This and the following properties provide the ability to add TLS client authentication to the Kafka consumer using the TLS authentication protocol. This protocol configures BIG-IP Telemetry Streaming to provide the required private key and certificate(s) when the Kafka broker is configured to use SSL/TLS Client authentication. You can find more information on Kafka’s client authentication on the Confluent pages: https://docs.confluent.io/5.5.0/kafka/authentication_ssl.html. privateKey is the Private Key for the SSL certificate. Must be formatted as a 1-line string, with literal new line characters. |
| clientCertificate | The client certificate chain. Must be formatted as a 1-line string, with literal new line characters. | |
| rootCertificate | The Certificate Authority root certificate, used to validate the client certificate. Certificate verification can be disabled by setting allowSelfSignedCert=true. Must be formatted as a 1-line string, with literal new line characters. |
IMPORTANT: The following declaration includes the additional properties shown in the table. If you attempt to use this declaration on a previous version, it will fail. On previous versions, remove the highlighted line(s), and the comma from the previous line.
Example Declaration:
1 2 3 4 5 6 7 8 9 10 11 12 13 14 15 16 17 18 19 20 21 22 23 24 25 26 27 28 29 30 31 32 33 34 35 36 37 38 39 40 41 42 | { "class": "Telemetry", "My_Consumer": { "class": "Telemetry_Consumer", "type": "Kafka", "host": "192.168.2.1", "protocol": "binaryTcpTls", "port": 9092, "topic": "f5-telemetry" }, "My_Consumer_SASL_PLAIN_auth": { "class": "Telemetry_Consumer", "type": "Kafka", "host": "192.168.2.1", "protocol": "binaryTcpTls", "port": 9092, "topic": "f5-telemetry", "authenticationProtocol": "SASL-PLAIN", "username": "username", "passphrase": { "cipherText": "passphrase" } }, "My_Consumer_TLS_client_auth": { "class": "Telemetry_Consumer", "type": "Kafka", "host": "kafka.example.com", "protocol": "binaryTcpTls", "port": 9092, "topic": "f5-telemetry", "authenticationProtocol": "TLS", "privateKey": { "cipherText": "-----BEGIN KEY-----\nMIIE...\n-----END KEY-----" }, "clientCertificate": { "cipherText": "-----BEGIN CERTIFICATE-----\nMIID...\n-----END CERTIFICATE-----" }, "rootCertificate": { "cipherText": "-----BEGIN CERTIFICATE-----\nMIID...\n-----END CERTIFICATE-----" } } } |
ElasticSearch

Note
BIG-IP TS 1.24 added support for sending data to ElasticSearch 7 and ElasticSearch 8.
- Required Information:
- Host: The address of the ElasticSearch system.
- Index: The index where data should go within the ElasticSearch system.
- Optional Parameters:
- Port: The port of the ElasticSearch system. Default is 9200.
- Protocol: The protocol of the ElasticSearch system. Options: http or https. Default is http.
- Allow Self Signed Cert: allow BIG-IP TS to skip Cert validation. Options: true or false. Default is false.
- Path: The path to use when sending data to the ElasticSearch system.
- Data Type: The type of data posted to the ElasticSearch system.
- API Version: The API version of the ElasticSearch system. Options: Any version string matching the ElasticSearch node(s) version. The default is 6.0.
- Username: The username to use when sending data to the ElasticSearch system.
- Passphrase: The secret/password to use when sending data to the ElasticSearch system.
Important
BIG-IP Telemetry Streaming 1.24 and later use the API Version value to determine the appropriate defaults to use for the Data Type parameter.
When the API Version is 6.X or earlier, f5.telemetry is used as the default Data Type.
When the API Version is 7.0 until the last 7.X version, _doc is used as the default Data Type.
In API Version 8.0 and later, the Data Type value is not supported, and will not be accepted in the BIG-IP Telemetry Streaming declaration.
To see more information about installing ElasticSearch, see Installing ElasticSearch documentation.
Example Declaration:
{
    "class": "Telemetry",
    "My_Consumer": {
        "class": "Telemetry_Consumer",
        "type": "ElasticSearch",
        "host": "10.145.92.42",
        "index": "testindex",
        "port": 9200,
        "protocol": "https",
        "dataType": "f5.telemetry",
        "apiVersion": "6.7.2"
    }
}
Sumo Logic

- Required Information:
- Host: The address of the Sumo Logic collector.
- Protocol: The protocol of the Sumo Logic collector.
- Port: The port of the Sumo Logic collector.
- Path: The HTTP path of the Sumo Logic collector (without the secret).
- Secret: The protected portion of the HTTP path (the final portion of the path, sometimes called a system tenant).
Note
To see more information about installing Sumo Logic, see Installing Sumo Logic documentation.
Example Declaration:
{
    "class": "Telemetry",
    "My_Consumer": {
        "class": "Telemetry_Consumer",
        "type": "Sumo_Logic",
        "host": "192.168.2.1",
        "protocol": "https",
        "port": 443,
        "path": "/receiver/v1/http/",
        "passphrase": {
            "cipherText": "secret"
        }
    }
}
StatsD
![]()
- Required Information:
- Host: The address of the StatsD instance.
- Protocol: The protocol of the StatsD instance. Options: TCP (BIG-IP TS 1.12+) or UDP. The default is UDP.
- Port: The port of the StatsD instance
Important
In BIG-IP TS v1.15 and later, if BIG-IP Telemetry Streaming is unable to locate the hostname in the systemPoller data, it sends the metric with hostname value host.unknown. This gets transformed to hostname-unknown as required by StatsD. This is because StatsD uses a . as a delimiter, and BIG-IP TS automatically replaces it with a -. For example:
{
metricName: ‘f5telemetry.hostname-unknown.customStats.clientSideTraffic-bitsIn’,
metricValue: 111111030
}
Note
When using the custom endpoints feature, be sure to include /mgmt/tm/sys/global-settings in your endpoints for BIG-IP Telemetry Streaming to be able to find the hostname.
For more information about installing StatsD, see StatsD documentation on GitHub.
Additions to the StatsD consumer
The following items have been added to the StatsD consumer since it was introduced.
| BIG-IP TS Version | Property | Description |
|---|---|---|
| 1.21 | addTags | This feature (experimental in BIG-IP TS 1.21-1.24) causes BIG-IP Telemetry Streaming to parse the incoming payload for values to automatically add as tags. Currently only the sibling method is supported. To see an example and the output from addTags, see addTags example. |
| 1.25 | convertBooleansToMetrics | This property allows you to choose whether or not to convert boolean values to metrics (true becomes 1, false (default0) becomes 0). By default, BIG-IP Telemetry Streaming uses Boolean values as tag values that are attached to individual metrics. If convertBooleansToMetrics is set to true, any Boolean values are instead converted to numeric values, which are then sent to the consumer(s) as a metric. Note: BIG-IP Telemetry Streaming does not send a Boolean as both a tag and a metric; a Boolean value is sent to the consumer(s) as either a tag or as a metric. |
IMPORTANT: The following declaration includes the additional properties shown in the table. If you attempt to use this declaration on a previous version, it will fail. On previous versions, remove the highlighted line(s), and the comma from the previous line.
{
    "class": "Telemetry",
    "My_Consumer": {
        "class": "Telemetry_Consumer",
        "type": "Statsd",
        "host": "192.168.2.1",
        "protocol": "udp",
        "port": 8125,
        "convertBooleansToMetrics": false
    },
    "My_Consumer_with_AutoTagging": {
        "class": "Telemetry_Consumer",
        "type": "Statsd",
        "host": "192.168.2.1",
        "protocol": "udp",
        "port": 8125,
        "addTags": {
            "method": "sibling"
        }
    }
}
Generic HTTP
- Required Information:
- Host: The address of the system.
- Optional Properties:
- Protocol: The protocol of the system. Options:
httpsorhttp. Default ishttps. - Port: The port of the system. Default is
443. - Path: The path of the system. Default is
/. - Method: The method of the system. Options:
POST,PUT,GET. Default isPOST. - Headers: The headers of the system.
- Passphrase: The secret to use when sending data to the system, for example an API key to be used in an HTTP header.
- fallbackHosts: List FQDNs or IP addresses to be used as fallback hosts
- proxy: Proxy server configuration
- Protocol: The protocol of the system. Options:
Note
Since this consumer is designed to be generic and flexible, how authentication is performed is left up to the web service. To ensure the secrets are encrypted within BIG-IP Telemetry Streaming please note the use of JSON pointers. The secret to protect should be stored inside passphrase and referenced in the desired destination property, such as an API token in a header as shown in this example.
Additions to the Generic HTTP consumer
The following items have been added to the Generic HTTP consumer since it was introduced.
| BIG-IP TS Version | Property | Description |
|---|---|---|
| 1.18 | privateKey | This and the following properties provide the ability to add TLS client authentication to the Generic HTTP consumer using the TLS authentication protocol. This protocol configures BIG-IP Telemetry Streaming to provide the required private key and certificate(s) when the Generic HTTP consumer is configured to use SSL/TLS Client authentication. privateKey is the Private Key for the SSL certificate. Must be formatted as a 1-line string, with literal new line characters. |
| clientCertificate | The client certificate chain. Must be formatted as a 1-line string, with literal new line characters. | |
| rootCertificate | The Certificate Authority root certificate, used to validate the client certificate. Certificate verification can be disabled by setting allowSelfSignedCert=true. Must be formatted as a 1-line string, with literal new line characters. | |
| 1.29 | outputMode | Possible values: raw, processed. OutputMode provides the options to send data with the Generic HTTP consumer in an “as-is” (raw) format instead of the generated JSON payload (processed) allowing the data to be sent in Line Protocol format to a raw event listener and have it forwarded through the Generic HTTP consumer. |
| 1.31 | compressionType | Sets the type of compression. The acceptable values are none for no compression (the default), or gzip, where the payload will be compressed using gzip. |
| customOpts experimental | This experimental feature relies on Node.js for each value when the user specifies nothing in customOpts. Node.js values may differ based on version used. Refer to node.js documentation for more information. |
IMPORTANT: The following declaration includes the additional properties shown in the table. If you attempt to use this declaration on a previous version, it will fail. On previous versions, remove the highlighted line(s), and the comma from the previous line.
Example Declaration:
{
    "class": "Telemetry",
    "My_Consumer": {
        "class": "Telemetry_Consumer",
        "type": "Generic_HTTP",
        "host": "192.168.2.1",
        "protocol": "https",
        "port": 443,
        "path": "/",
        "method": "POST",
        "headers": [
            {
                "name": "content-type",
                "value": "application/json"
            },
            {
                "name": "x-api-key",
                "value": "`>@/passphrase`"
            }
        ],
        "passphrase": {
            "cipherText": "apikey"
        },
        "outputMode": "processed",
        "compressionType": "gzip",
        "customOpts": [
            { "name": "keepAlive", "value": true },
            { "name": "keepAliveMsecs", "value": 30000 },
            { "name": "maxSockets", "value": 30 },
            { "name": "maxFreeSockets", "value": 30 }
        ]
    }
}
Additional examples for Generic HTTP consumers:
- Generic HTTP with multiple passphrases, see Generic HTTP with multiple passphrases.
- Generic HTTP with proxy settings in BIG-IP TS 1.17 and later, see Specifying proxy settings for Generic HTTP consumers.
- An EXPERIMENTAL feature where you can specify fallback IP address(es) for the Generic HTTP consumer, see Specifying fallback hosts for Generic HTTP consumers.
- Generic HTTP with TLS authentication, see Generic HTTP consumer with TLS Client Authentication.
Fluentd

- Required Information:
- Host: The address of the system.
- Protocol: The protocol of the system. Options:
httpsorhttp. Default ishttps. - Port: The port of the system. Default is
9880. - Path: The path of the system. This parameter corresponds to the tag of the event being sent to Fluentd (see Fluentd documentation for information)
- Method: The method of the system. This must be
POST. - Headers: The headers of the system. Important: The content-type = application/json header as shown in the example is required.
Example Declaration:
{
    "class": "Telemetry",
    "My_Consumer": {
        "class": "Telemetry_Consumer",
        "type": "Generic_HTTP",
        "host": "192.168.2.1",
        "protocol": "https",
        "port": 9880,
        "path": "/fluentd.tag",
        "method": "POST",
        "headers": [
            {
                "name": "content-type",
                "value": "application/json"
            }
        ]
    }
}
Google Cloud Operations Suite’s Cloud Monitoring
![]()
Note
Google recently changed the name of their StackDriver product to Cloud Operations Suite with the monitoring product named Cloud Monitoring.
- Required Information:
- projectId: The ID of the GCP project.
- serviceEmail: The email for the Google Service Account. To check if you have an existing Service Account, from the left menu of GCP, select IAM & admin, and then click Service Accounts. If you do not have a Service Account, you must create one.
- privateKeyId: The ID of the private key that the user created for the Service Account (if you do not have a key, from the account page, click Create Key with a type of JSON. The Private key is in the file that was created when making the account). If you are using IAM roles, introduced in 1.25 do not use this property and see Using IAM roles for Google Cloud Monitoring.
- privateKey: The private key given to the user when a private key was added to the service account. If you are using IAM roles, introduced in 1.25 do not use this property and see Using IAM roles for Google Cloud Monitoring.
For complete information on deploying Google Cloud Operations Suite, see Google Operations suite documentation.
Finding the Data
Once you have configured the Google Cloud Monitoring consumer and sent an F5 BIG-IP Telemetry Streaming declaration, F5 BIG-IP Telemetry Streaming creates custom MetricDescriptors to which it sends metrics. These metrics can be found under a path such as custom/system/cpu. To make it easier to find data that is relevant to a specific device, BIG-IP TS uses the Generic Node resource type, and assigns machine ID to the node_id label to identify which device the data is from.
Important
There is a quota of 500 custom MetricDescriptors for Google Cloud Monitoring. BIG-IP Telemetry Streaming creates these MetricDescriptors, and if this quota is ever reached, you must delete some of these MetricDescriptors.
Additions to the Cloud Monitoring consumer
The following items have been added to the Google Cloud Operations Suite’s Cloud Monitoring consumer since it was introduced.
| BIG-IP TS Version | Property | Description |
|---|---|---|
| 1.22 | reportInstanceMetadata | This property allows you to enable or disable metadata reporting. The default is false. |
IMPORTANT: The following declaration includes the additional properties shown in the table. If you attempt to use this declaration on a previous version, it will fail. On previous versions, remove the highlighted line(s), and the comma from the previous line.
Example Declaration:
{
    "class": "Telemetry",
    "My_Consumer": {
        "class": "Telemetry_Consumer",
        "type": "Google_Cloud_Monitoring",
        "privateKey": {
            "cipherText": "yourPrivateKey"
    	},
        "projectId": "yourGoogleCloudMonitoringProjectId",
        "privateKeyId": "yourPrivateKeyId",
        "serviceEmail": "yourServiceEmail",
        "reportInstanceMetadata": false
    }
}
Using IAM roles for Google Cloud Monitoring
F5 BIG-IP Telemetry Streaming 1.25 added support for using IAM roles for Google Cloud Monitoring. This means the Cloud Monitoring consumer can send data without specifying credentials if IAM roles are properly configured for the BIG-IP instance in GCP.
IAM roles are enabled by using the new useServiceAccountToken property set to true (the default is false). When set to true, the privateKey and privateKeyId properties are not used.
When using this feature, the authentication token is fetched from metadata at ${METADATA_URL}/v1/instance/service-accounts/${serviceAccount.serviceEmail}/token, meaning that serviceEmail in the declaration should match the service account email associated with the VM.
Example Declaration:
{
    "class": "Telemetry",
    "My_Consumer": {
        "class": "Telemetry_Consumer",
        "type": "Google_Cloud_Monitoring",
        "projectId": "yourGoogleCloudMonitoringProjectId",
        "serviceEmail": "yourServiceEmail",
        "reportInstanceMetadata": false,
        "useServiceAccountToken": true
    }
}
Google Cloud Logging
![]()
- Required Information:
- serviceEmail: The email for the Google Service Account. To check if you have an existing Service Account, from the GCP left menu, select IAM & admin, and then click Service Accounts. If you do not have a Service Account, you must create one.
- privateKeyId: The ID of the private key the user created for the Service Account (if you do not have a key, from the Account page, click Create Key with a type of JSON. The Private key is in the file that was created when making the account). If you are using IAM roles introduced in 1.25, do not use this property and see Using IAM roles for Google Cloud Monitoring.
- privateKey: The private key given to the user when a private key was added to the service account. If you are using IAM roles introduced in 1.25, do not use this property and see Using IAM roles for Google Cloud Logging.
- logScopeId: The ID of the scope specified in the logScope property. If using a logScope of projects, this is the ID for your project.
- logId: The Google Cloud logging LOG_ID where log entries will be written.
For complete information, see the Google Cloud Logging documentation.
Finding the Data
Once you have configured the Google Cloud Logging consumer and sent a BIG-IP Telemetry Streaming declaration, BIG-IP Telemetry Streaming sends log entries directly to Google Cloud Logging. Log entries are written to a logName in Google Cloud Logging, where the logName is generated from the properties in the BIG-IP Telemetry Streaming declaration, using the following format: [logScope]/[logScopeId/logs/[logId] (example: “projects/yourProjectId/logs/yourLogId”).
Example Declaration:
{
    "class": "Telemetry",
    "My_Consumer": {
        "class": "Telemetry_Consumer",
        "type": "Google_Cloud_Logging",
        "logScope": "projects",
        "logScopeId": "yourProjectId",
        "logId": "yourLogId",
        "privateKey": {
            "cipherText": "yourPrivateKey"
    	},
        "privateKeyId": "yourPrivateKeyId",
        "serviceEmail": "yourServiceEmail"
    }
}
Using IAM roles for Google Cloud Logging
F5 BIG-IP Telemetry Streaming 1.25 added support for using IAM roles for Google Cloud Logging. This means the Cloud Logging consumer can send data without specifying credentials if IAM roles are properly configured for the BIG-IP instance in GCP.
IAM roles are enabled by using the new useServiceAccountToken property set to true (the default is false). When set to true, the privateKey and privateKeyId properties are not used.
When using this feature, the authentication token is fetched from metadata at ${METADATA_URL}/v1/instance/service-accounts/${serviceAccount.serviceEmail}/token, meaning that serviceEmail in the declaration should match the service account email associated with the VM.
Example Declaration:
{
    "class": "Telemetry",
    "My_Consumer": {
        "class": "Telemetry_Consumer",
        "type": "Google_Cloud_Logging",
        "logScope": "projects",
        "logScopeId": "yourProjectId",
        "logId": "yourLogId",
        "serviceEmail": "yourServiceEmail",
        "useServiceAccountToken": true
    }
}
F5 Cloud Consumer (F5 Internal)
The F5 Cloud Consumer is a part of F5’s internal, digital experience operating system, a cloud-based analytics platform that helps organizations monitor, operate, and protect digital workflows and optimize their customer’s digital experiences.
Important
This F5 Cloud consumer is for F5 internal use only, and its API is subject to change. We are including it on this page of Push consumers because you may see it in a BIG-IP Telemetry Streaming declaration.
Additions to the F5 Cloud consumer
The following items have been added to the F5 Cloud consumer since it was introduced.
| BIG-IP TS Version | Property | Description |
|---|---|---|
| 1.22 | eventSchemaVersion | This allows you to select the appropriate event schema instead of using a hard-coded value. |
IMPORTANT: The following declaration includes the additional properties shown in the table. If you attempt to use this declaration on a previous version, it will fail. On previous versions, remove the highlighted line(s), and the comma from the previous line.
Example Declaration:
{
  "class": "Telemetry",
  "AsmPolicyOWASP_Endpoint": {
    "class": "Telemetry_Endpoints",
    "items": {
      "asmpolicyowasp": {
        "path": "/mgmt/tm/asm/owasp/policy-score?$select=policyId,policyScore,securityRisks"
      },
      "asmpolicy": {
        "path": "/mgmt/tm/asm/policies?$expand=historyRevisionReference&$select=id,name,fullPath,virtualServers,history-revisions/revision,history-revisions/activatedAtDatetime"
      },
      "asmsystem": {
        "path": "/mgmt/tm/sys/global-settings?$select=hostname"
      }

    }
  },
  "AsmPolicyOWASP_Poller": {
    "class": "Telemetry_System_Poller",
    "interval": 65,
    "enable": true,
    "trace": true,
    "endpointList": "AsmPolicyOWASP_Endpoint"
  },
  "SystemVIP_Poller": {
    "class": "Telemetry_System_Poller",
    "interval": 65,
    "enable": false,
    "trace": true,
    "allowSelfSignedCert": false,
    "host": "localhost",
    "port": 8100,
    "protocol": "http",
    "actions": [
      {
        "enable": true,
        "includeData": {},
        "locations": {
          "system": true,
          "virtualServers": true
        }
      }
    ]
  },
  "AsmEvent_Listener": {
    "class": "Telemetry_Listener",
    "port": 6514,
    "enable": true,
    "trace": false
  },
  "AsmIncidents_Endpoint": {
    "class": "Telemetry_Endpoints",
    "items": {
      "asmincidents": {
        "path": "/mgmt/tm/asm/events/incidents?$select=virtualServerName,incidentStatus,clientIp,incidentSeverity,durationInSeconds,requestCount,id,policy/name,policy/fullPath,incidentType,incidentSubtype,lastRequestDatetime&$expand=policyReference,incidentTypeReference&$top=100&$orderby=lastRequestDatetime+desc"
      },
      "asmsystem": {
        "path": "/mgmt/tm/sys/global-settings?$select=hostname"
      }
    }
  },
  "AsmIncidents_Poller": {
    "class": "Telemetry_System_Poller",
    "interval": 60,
    "enable": true,
    "trace": false,
    "endpointList": "AsmIncidents_Endpoint"
  },
  "Cloud_Consumer": {
    "allowSelfSignedCert": true,
    "class": "Telemetry_Consumer",
    "type": "F5_Cloud",
    "enable": true,
    "trace": true,
    "f5csTenantId": "a-blabla-a",
    "f5csSensorId": "12345",
    "payloadSchemaNid": "f5",
    "serviceAccount": {
      "authType": "google-auth",
      "type": "serviceAccount",
      "projectId": "deos-dev",
      "privateKeyId": "11111111111111111111111",
      "privateKey": {
        "cipherText": "-----BEGIN KEY-----\nMIIE...\n-----END KEY-----"
      },
      "clientEmail": "test@deos-dev.iam.gserviceaccount.com",
      "clientId": "1212121212121212121212",
      "authUri": "https://accounts.google.com/o/oauth2/auth",
      "tokenUri": "https://oauth2.googleapis.com/token",
      "authProviderX509CertUrl": "https://www.googleapis.com/oauth2/v1/certs",
      "clientX509CertUrl": "https://www.googleapis.com/robot/v1/metadata/x509/test%40deos-dev.iam.gserviceaccount.com"
    },
    "targetAudience": "deos-ingest",
    "eventSchemaVersion": "5"
  },
  "schemaVersion": "1.15.0"
}
DataDog
![]()
- Required Information:
- apiKey: The DataDog API key required to submit metrics and events to DataDog
- Optional Properties:
- proxy: Proxy server configuration
- Additional examples for HTTP consumers:
- DataDog with proxy settings in BIG-IPTS 1.31 and later, see Specifying proxy settings for Generic HTTP consumers.
Additions to the DataDog consumer
The following items have been added to the DataDog consumer since it was introduced.
Beginning with BIG-IP TS version 1.32, events with metrics will be also sent to the DataDog logging endpoints. The DataDog metrics endpoints will continue to receive metrics as before.
| BIG-IP TS Version | Property | Description |
|---|---|---|
| 1.23 | compressionType | Sets the type of compression. The acceptable values are none for no compression (the default), or gzip, where the payload will be compressed using gzip. |
| 1.24 | region | Sets the region. The acceptable values are US1 (the default), US3, EU1, and US1-FED. |
| service | The name of the service generating telemetry data (string). The default is f5-telemetry. This property exposes the DATA_DOG_SERVICE_FIELD value that is sent to the DataDog API. | |
| 1.25 | metricPrefix | This property allows you to provide a string value to be used as a metric prefix. For example, in the following declaration, the metricPrefix is set to “f5”, “bigip”, which would add f5.bigip as a prefix (i.e. system.cpu would become f5.bigip.system.cpu). |
| convertBooleansToMetrics | This property allows you to choose whether or not to convert boolean values to metrics (true becomes 1, false (default0) becomes 0). By default, BIG-IP Telemetry Streaming uses Boolean values as tag values that are attached to individual metrics. If convertBooleansToMetrics is set to true, any Boolean values are instead converted to numeric values, which are then sent to the consumer(s) as a metric. Note: BIG-IP Telemetry Streaming does not send a Boolean as both a tag and a metric; a Boolean value is sent to the consumer(s) as either a tag or as a metric. |
|
| customTags | This property allows you to add custom tags that are appended to the dynamically generated telemetry tags. You specify tags as an array of name and value pairs. You can set more than one tag in a declaration, but if you use this property, you must specify at least one custom tag. | |
| 1.31 | customOpts experimental | This experimental feature relies on Node.js for each value when the user specifies nothing in customOpts. Node.js values may differ based on version used. Refer to node.js documentation for more information. |
IMPORTANT: The following declaration includes all of the additional properties shown in the table. If you attempt to use this declaration on a previous version, it will fail. On previous versions, remove the lines highlighted in yellow (and the comma from line 7).
Example Declaration:
{
    "class": "Telemetry",
    "DataDog": {
        "class": "Telemetry_Consumer",
        "type": "DataDog",
        "apiKey": "secret",
        "compressionType": "gzip",
        "region": "US1",
        "service": "f5-telemetry",
        "metricPrefix": ["f5", "bigip"],
        "convertBooleansToMetrics": true,
        "customTags": [
            {
                "name": "instanceId",
                "value": "instance-1"
            }
        ]
    },
    "DataDog_With_Proxy_Minimal": {
        "class": "Telemetry_Consumer",
        "type": "DataDog",
        "apiKey": "secret",
        "compressionType": "gzip",
        "region": "US1",
        "service": "f5-telemetry",
        "metricPrefix": ["f5", "bigip"],
        "convertBooleansToMetrics": true,
        "customTags": [
            {
                "name": "instanceId",
                "value": "instance-1"
            }
        ],
        "proxy": {
            "host": "10.10.14.15",
            "port": 5054,
            "protocol": "http"
        }
    },
    "DataDog_With_Proxy_Full": {
        "class": "Telemetry_Consumer",
        "type": "DataDog",
        "apiKey": "secret",
        "compressionType": "gzip",
        "region": "US1",
        "service": "f5-telemetry",
        "metricPrefix": ["f5", "bigip"],
        "convertBooleansToMetrics": true,
        "customTags": [
            {
                "name": "instanceId",
                "value": "instance-1"
            }
        ],
        "proxy": {
            "host": "10.10.14.14",
            "port": 5053,
            "protocol": "http",
            "username": "test_username",
            "passphrase": {
                "cipherText": "test_passphrase"
            },
            "allowSelfSignedCert": true
        }
    },
    "DataDog_HTTP_tune": {
        "class": "Telemetry_Consumer",
        "type": "DataDog",
        "apiKey": "secret",
        "compressionType": "gzip",
        "region": "US1",
        "service": "f5-telemetry",
        "metricPrefix": ["f5", "bigip"],
        "convertBooleansToMetrics": true,
        "customTags": [
            {
                "name": "instanceId",
                "value": "instance-1"
            }
        ],
        "customOpts": [
            { "name": "keepAlive", "value": true },
            { "name": "keepAliveMsecs", "value": 30000 },
            { "name": "maxSockets", "value": 30 },
            { "name": "maxFreeSockets", "value": 30 }
        ]
    }
}
OpenTelemetry Exporter
![]()
The OpenTelemetry Exporter Consumer exports telemetry data to an OpenTelemetry Collector, or OpenTelemetry Protocol compatible API.
- Required Information:
- Host: The address of the OpenTelemetry Collector, or OpenTelemetry Protocol compatible API
- Port: The port of the OpenTelemetry Collector, or OpenTelemetry Protocol compatible API
- Optional Properties:
- metricsPath: The URL path to send metrics telemetry to
- headers: Any required HTTP headers, required to send metrics telemetry to an OpenTelemetry Protocol compatible API
- Protocol: The protocol of the system. Note: protocol is allowed only when exporter is json or protobuf. When exporter is grpc then useSSL can be specified.
privateKey, clientCertificate, rootCertificate allowed for any exporter but only when protocol is https or useSSL set to
true.
- Note: As of BIG-IP Telemetry Streaming 1.23, this consumer:
- Only exports OpenTelemetry metrics (logs and traces are not supported)
- Exports telemetry data using protobufs over HTTP
- Extracts metrics from Event Listener log messages. Any integer or float values in Event Listener log messages will be converted to an OpenTelemetry metric, and exported as a metric.
Additions to the OpenTelemetry Exporter consumer
The following items have been added to the OpenTelemetry consumer since it was introduced.
| BIG-IP TS Version | Property | Description |
|---|---|---|
| 1.25 | convertBooleansToMetrics | This property allows you to choose whether or not to convert boolean values to metrics (true becomes 1, false (default0) becomes 0). By default, BIG-IP Telemetry Streaming uses Boolean values as tag values that are attached to individual metrics. If convertBooleansToMetrics is set to true, any Boolean values are instead converted to numeric values, which are then sent to the consumer(s) as a metric. Note: BIG-IP Telemetry Streaming does not send a Boolean as both a tag and a metric; a Boolean value is sent to the consumer(s) as either a tag or as a metric. |
| 1.31 | exporter | exporter allowed values: grpc, json and protobuf. Default is protobuf, while grpc is experimental. Note: When exporter is grpc, then useSSL can be specified. |
| privateKey | This and the following properties provide the ability to add TLS client authentication using the TLS authentication protocol. This protocol configures BIG-IP Telemetry Streaming to provide the required private key and certificate(s) when the consumer is configured to use SSL/TLS Client authentication. privateKey is the Private Key for the SSL certificate. Must be formatted as a 1-line string, with literal new line characters. |
|
| clientCertificate | The client certificate chain. Must be formatted as a 1-line string, with literal new line characters. | |
| rootCertificate | The Certificate Authority root certificate, used to validate the client certificate. Certificate verification can be disabled by setting allowSelfSignedCert=true. Must be formatted as a 1-line string, with literal new line characters. | |
| Protocol | The protocol of the system. | |
| useSSL | To ensure the data that is transferred between a client and a server remains private. |
IMPORTANT: The following declaration includes all of the additional properties shown in the table. If you attempt to use this declaration on a previous version, it will fail. On previous versions, remove the highlighted line.
Example Declaration:
{
    "class": "Telemetry",
    "OpenTelemetry_Protobuf_Default": {
        "class": "Telemetry_Consumer",
        "type": "OpenTelemetry_Exporter",
        "host": "192.168.2.1",
        "port": 55681,
        "metricsPath": "/v1/metrics",
        "headers": [
            {
                "name": "x-access-token",
                "value": "YOUR_TOKEN"
            }
        ],
        "convertBooleansToMetrics": false
    },
    "OpenTelemetry_Protobuf": {
        "class": "Telemetry_Consumer",
        "type": "OpenTelemetry_Exporter",
        "host": "192.168.2.1",
        "port": 55681,
        "metricsPath": "/v1/metrics",
        "headers": [
            {
                "name": "x-access-token",
                "value": "YOUR_TOKEN"
            }
        ],
        "convertBooleansToMetrics": false,
        "exporter": "protobuf"
    },
    "OpenTelemetry_Protobuf_secure": {
        "class": "Telemetry_Consumer",
        "type": "OpenTelemetry_Exporter",
        "host": "192.168.2.1",
        "port": 55681,
        "protocol": "https",
        "headers": [
            {
                "name": "x-access-token",
                "value": "YOUR_TOKEN"
            }
        ],
        "convertBooleansToMetrics": false,
        "exporter": "protobuf"
    },
    "OpenTelemetry_Protobuf_secure_withClientCert_and_rootCert": {
        "class": "Telemetry_Consumer",
        "type": "OpenTelemetry_Exporter",
        "host": "192.168.2.1",
        "port": 55681,
        "protocol": "https",
        "headers": [
            {
                "name": "x-access-token",
                "value": "YOUR_TOKEN"
            }
        ],
        "convertBooleansToMetrics": false,
        "exporter": "protobuf",
        "privateKey": {
            "cipherText": "-----BEGIN KEY-----\nMIIE...\n-----END KEY-----"
        },
        "clientCertificate": {
            "cipherText": "-----BEGIN CERTIFICATE-----\nMIID...\n-----END CERTIFICATE-----"
        },
        "rootCertificate": {
            "cipherText": "-----BEGIN CERTIFICATE-----\nMIID...\n-----END CERTIFICATE-----"
        }
    },
    "OpenTelemetry_Json": {
        "class": "Telemetry_Consumer",
        "type": "OpenTelemetry_Exporter",
        "host": "192.168.2.1",
        "port": 55681,
        "metricsPath": "/v1/metrics",
        "headers": [
            {
                "name": "x-access-token",
                "value": "YOUR_TOKEN"
            }
        ],
        "convertBooleansToMetrics": false,
        "exporter": "json"
    },
    "OpenTelemetry_Json_secure": {
        "class": "Telemetry_Consumer",
        "type": "OpenTelemetry_Exporter",
        "host": "192.168.2.1",
        "port": 55681,
        "protocol": "https",
        "headers": [
            {
                "name": "x-access-token",
                "value": "YOUR_TOKEN"
            }
        ],
        "convertBooleansToMetrics": false,
        "exporter": "json"
    },
    "OpenTelemetry_Json_secure_withClientCert_and_rootCert": {
        "class": "Telemetry_Consumer",
        "type": "OpenTelemetry_Exporter",
        "host": "192.168.2.1",
        "port": 55681,
        "protocol": "https",
        "headers": [
            {
                "name": "x-access-token",
                "value": "YOUR_TOKEN"
            }
        ],
        "convertBooleansToMetrics": false,
        "exporter": "json",
        "privateKey": {
            "cipherText": "-----BEGIN KEY-----\nMIIE...\n-----END KEY-----"
        },
        "clientCertificate": {
            "cipherText": "-----BEGIN CERTIFICATE-----\nMIID...\n-----END CERTIFICATE-----"
        },
        "rootCertificate": {
            "cipherText": "-----BEGIN CERTIFICATE-----\nMIID...\n-----END CERTIFICATE-----"
        }
    },
    "OpenTelemetry_gRPC_insecure": {
        "class": "Telemetry_Consumer",
        "type": "OpenTelemetry_Exporter",
        "host": "192.168.2.1",
        "port": 55681,
        "headers": [
            {
                "name": "x-access-token",
                "value": "YOUR_TOKEN"
            }
        ],
        "convertBooleansToMetrics": false,
        "exporter": "grpc",
        "useSSL": false
    },
    "OpenTelemetry_gRPC_secure": {
        "class": "Telemetry_Consumer",
        "type": "OpenTelemetry_Exporter",
        "host": "192.168.2.1",
        "port": 55681,
        "headers": [
            {
                "name": "x-access-token",
                "value": "YOUR_TOKEN"
            }
        ],
        "convertBooleansToMetrics": false,
        "exporter": "grpc",
        "useSSL": true
    },
    "OpenTelemetry_gRPC_secure_withClientCert": {
        "class": "Telemetry_Consumer",
        "type": "OpenTelemetry_Exporter",
        "host": "192.168.2.1",
        "port": 55681,
        "headers": [
            {
                "name": "x-access-token",
                "value": "YOUR_TOKEN"
            }
        ],
        "convertBooleansToMetrics": false,
        "exporter": "grpc",
        "useSSL": true,
        "privateKey": {
            "cipherText": "-----BEGIN KEY-----\nMIIE...\n-----END KEY-----"
        },
        "clientCertificate": {
            "cipherText": "-----BEGIN CERTIFICATE-----\nMIID...\n-----END CERTIFICATE-----"
        }
    },
    "OpenTelemetry_gRPC_secure_withClientCert_and_rootCert": {
        "class": "Telemetry_Consumer",
        "type": "OpenTelemetry_Exporter",
        "host": "192.168.2.1",
        "port": 55681,
        "headers": [
            {
                "name": "x-access-token",
                "value": "YOUR_TOKEN"
            }
        ],
        "convertBooleansToMetrics": false,
        "exporter": "grpc",
        "useSSL": true,
        "privateKey": {
            "cipherText": "-----BEGIN KEY-----\nMIIE...\n-----END KEY-----"
        },
        "clientCertificate": {
            "cipherText": "-----BEGIN CERTIFICATE-----\nMIID...\n-----END CERTIFICATE-----"
        },
        "rootCertificate": {
            "cipherText": "-----BEGIN CERTIFICATE-----\nMIID...\n-----END CERTIFICATE-----"
        }
    }
}
Azure Regions
The following table shows an example table when listing regions from the Azure CLI using the command az account list-locations -o table. Note to list Azure Government Regions, you must use az cloud set --name AzureUsGovernment before running the list-locations command.
Important
This list is just a static example, we strongly recommend running the commands yourself to retrieve the current list.
The Name column on the right is the value to use in your BIG-IP Telemetry Streaming declaration
az account list-locations -o table
| DisplayName | Latitude | Longitude | Name |
|---|---|---|---|
| East Asia | 22.267 | 114.188 | eastasia |
| Southeast Asia | 1.283 | 103.833 | southeastasia |
| Central US | 41.5908 | -93.6208 | centralus |
| East US | 37.3719 | -79.8164 | eastus |
| East US 2 | 36.6681 | -78.3889 | eastus2 |
| West US | 37.783 | -122.417 | westus |
| North Central US | 41.8819 | -87.6278 | northcentralus |
| South Central US | 29.4167 | -98.5 | southcentralus |
| North Europe | 53.3478 | -6.2597 | northeurope |
| West Europe | 52.3667 | 4.9 | westeurope |
| Japan West | 34.6939 | 135.5022 | japanwest |
| Japan East | 35.68 | 139.77 | japaneast |
| Brazil South | -23.55 | -46.633 | brazilsouth |
| Australia East | -33.86 | 151.2094 | australiaeast |
| Australia Southeast | -37.8136 | 144.9631 | australiasoutheast |
| South India | 12.9822 | 80.1636 | southindia |
| Central India | 18.5822 | 73.9197 | centralindia |
| West India | 19.088 | 72.868 | westindia |
| Canada Central | 43.653 | -79.383 | canadacentral |
| Canada East | 46.817 | -71.217 | canadaeast |
| UK South | 50.941 | -0.799 | uksouth |
| UK West | 53.427 | -3.084 | ukwest |
| West Central US | 40.890 | -110.234 | westcentralus |
| West US 2 | 47.233 | -119.852 | westus2 |
| Korea Central | 37.5665 | 126.9780 | koreacentral |
| Korea South | 35.1796 | 129.0756 | koreasouth |
| France Central | 46.3772 | 2.3730 | francecentral |
| France South | 43.8345 | 2.1972 | francesouth |
| Australia Central | -35.3075 | 149.1244 | australiacentral |
| Australia Central 2 | -35.3075 | 149.1244 | australiacentral2 |
| UAE Central | 24.466667 | 54.366669 | uaecentral |
| UAE North | 25.266666 | 55.316666 | uaenorth |
| South Africa North | -25.731340 | 28.218370 | southafricanorth |
| South Africa West | -34.075691 | 18.843266 | southafricawest |
| Switzerland North | 47.451542 | 8.564572 | switzerlandnorth |
| Switzerland West | 46.204391 | 6.143158 | switzerlandwest |
| Germany North | 53.073635 | 8.806422 | germanynorth |
| Germany West Central | 50.110924 | 8.682127 | germanywestcentral |
| Norway West | 58.969975 | 5.733107 | norwaywest |
| Norway East | 59.913868 | 10.752245 | norwayeast |
In the following table, we list the Azure Government regions.
az cloud set --name AzureUsGovernment
az account list-locations -o table
| DisplayName | Latitude | Longitude | Name |
|---|---|---|---|
| USGov Virginia | 37.3719 | -79.8164 | usgovvirginia |
| USGov Iowa | 41.5908 | -93.6208 | usgoviowa |
| USDoD East | 36.6676 | -78.3875 | usdodeast |
| USDoD Central | 41.6005 | -93.6091 | usdodcentral |
| USGov Texas | 29.4241 | -98.4936 | usgovtexas |
| USGov Arizona | 33.4484 | -112.0740 | usgovarizona |