F5 Distributed Cloud > F5 Distributed Cloud: Web Application Security & Scanning Source | Edit on
Lab 1: Deploying and Managing F5 Distributed Cloud Web Application Firewall Configuration
Objective:
Explore and become familiar with the Distributed Cloud Console
Review the F5 Distributed Cloud (XC) Load Balancer that has been provisioned
Create a Web Application Firewall policy and attach to the F5 XC Load Balancer
Narrative:
After consulting with your trusty F5 Solutions Engineer, you decide to adopt security services from F5 Distributed Cloud Web Application and API Protection (WAAP) suite. The lab provisioned for you has already deployed a F5 XC load balancer and been setup to route to your Azure application. The F5 Distributed Cloud Application Delivery Network (ADN) will provide network connectivity for clients to first route to F5’s nearest Regional Edge(RE) location on the ADN utilizing IP Anycast. Once the client is connected to the their nearest F5 RE, security controls can now be applied so that malicous traffic can be dropped at the F5 RE and valid traffic can than be passed to ACME Azure environment. This lab will be deployed in a SaaS only configuration with no on-premises (public or private cloud) elements.
Note
You will not have direct access to the Azure environment where the application is hosted.
Warning
If you are using multiple labs in one course, understand that some steps below may be redundant depending on labs deployed. To gain full benefits from this lab, please delete any objects created in your prior lab and continue with this lab as all necessary objects will be recreated.
Following the tasks in the prior Introduction Section, you should now be able to access the F5 Distributed Cloud Console, having set your Work Domain Roles and Skill levels. If you have not done so already, please login to your tenant for this lab using the Accept Inivitation link from your second email and proceed to Task 1.
Expected Lab Time: 25 minutes
Task 1: Exploring the F5 Distributed Console
The following steps will allow you to review the XC Load Balancer that was deployed and is currently advertising a globally available application. These steps will allow you to review the application, its DNS entry and the Azure target that is configured as the origin.
Following the Introduction section instructions, you should now be the Home page of the F5 Distributed Cloud Console. Let’s first review the F5 Distributed Load Balancer that was configured for you via automation. Select Web App & API Protection.
On the Web App & API Protection page, note the identifier of your namespace. The namespace will be follow a format of adjective-animal. In this guide, the namespace is pet-walrus is an example. Your namespace will be different. In the left-hand navigation expand Manage and click Load Balancers > Origin Pools
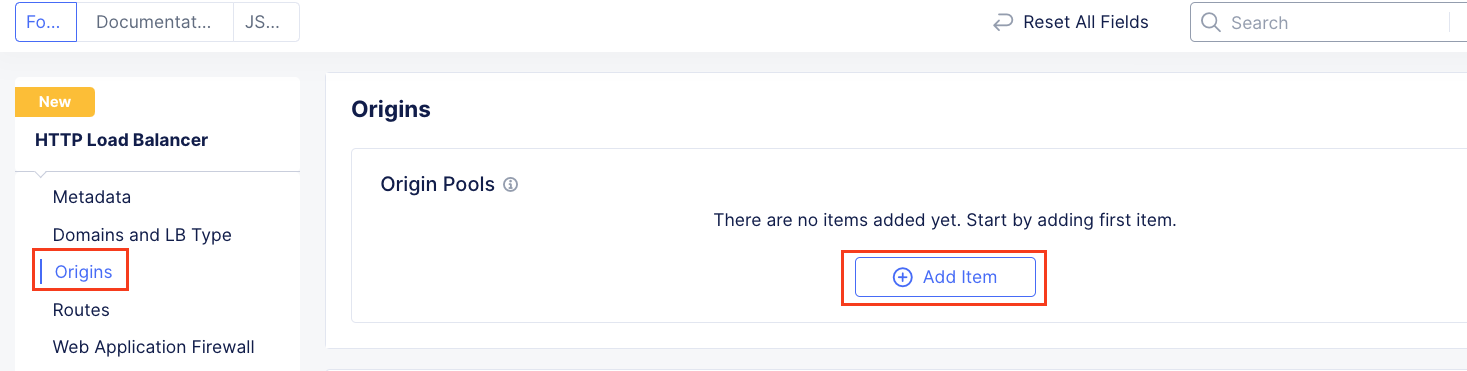
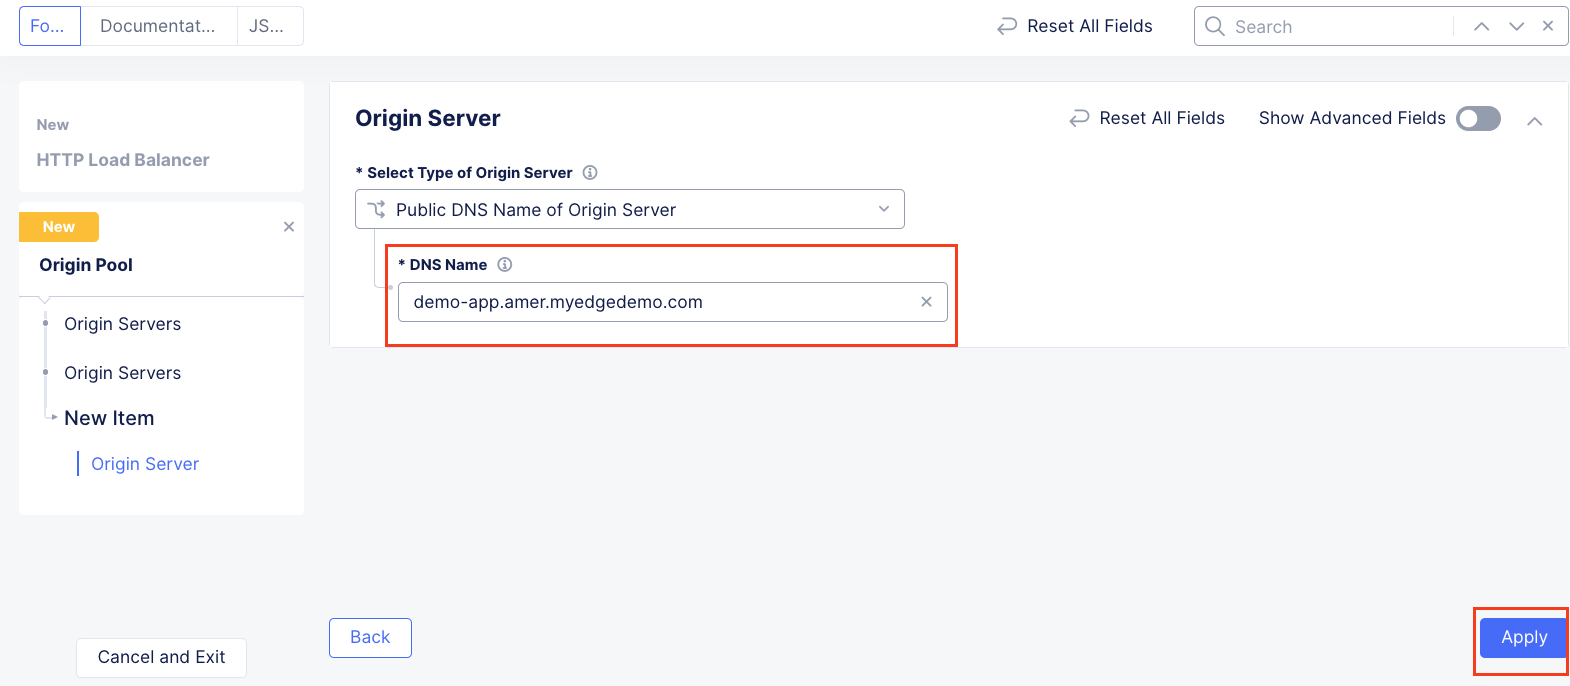
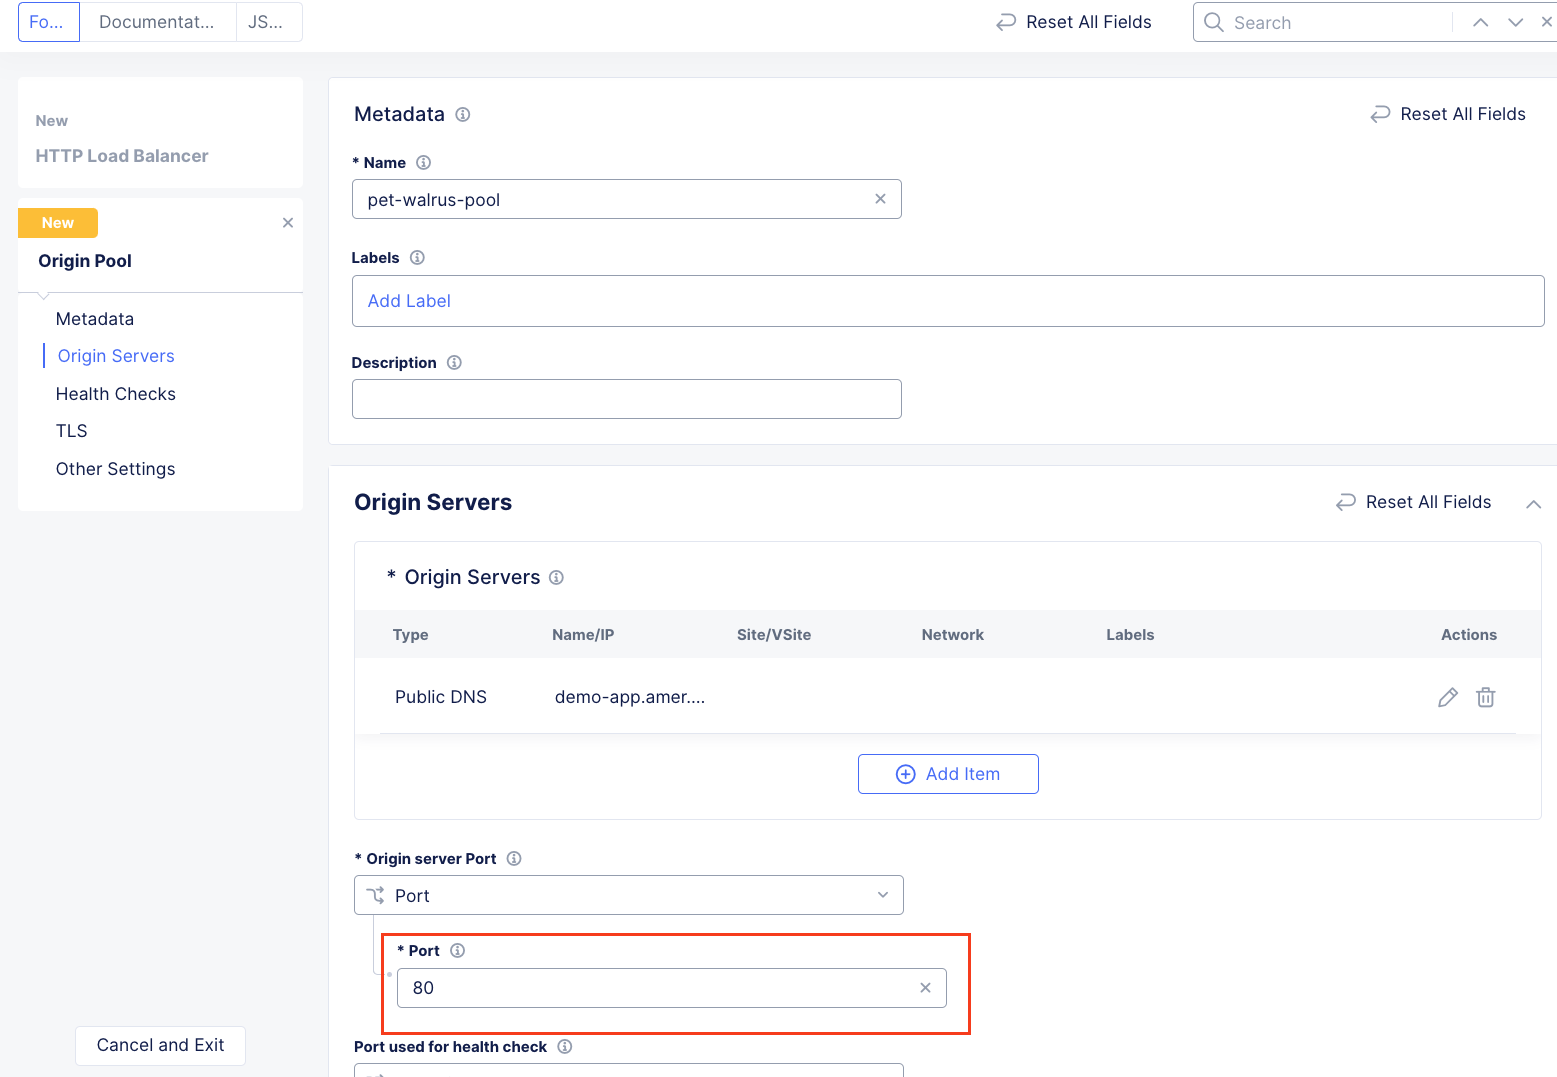
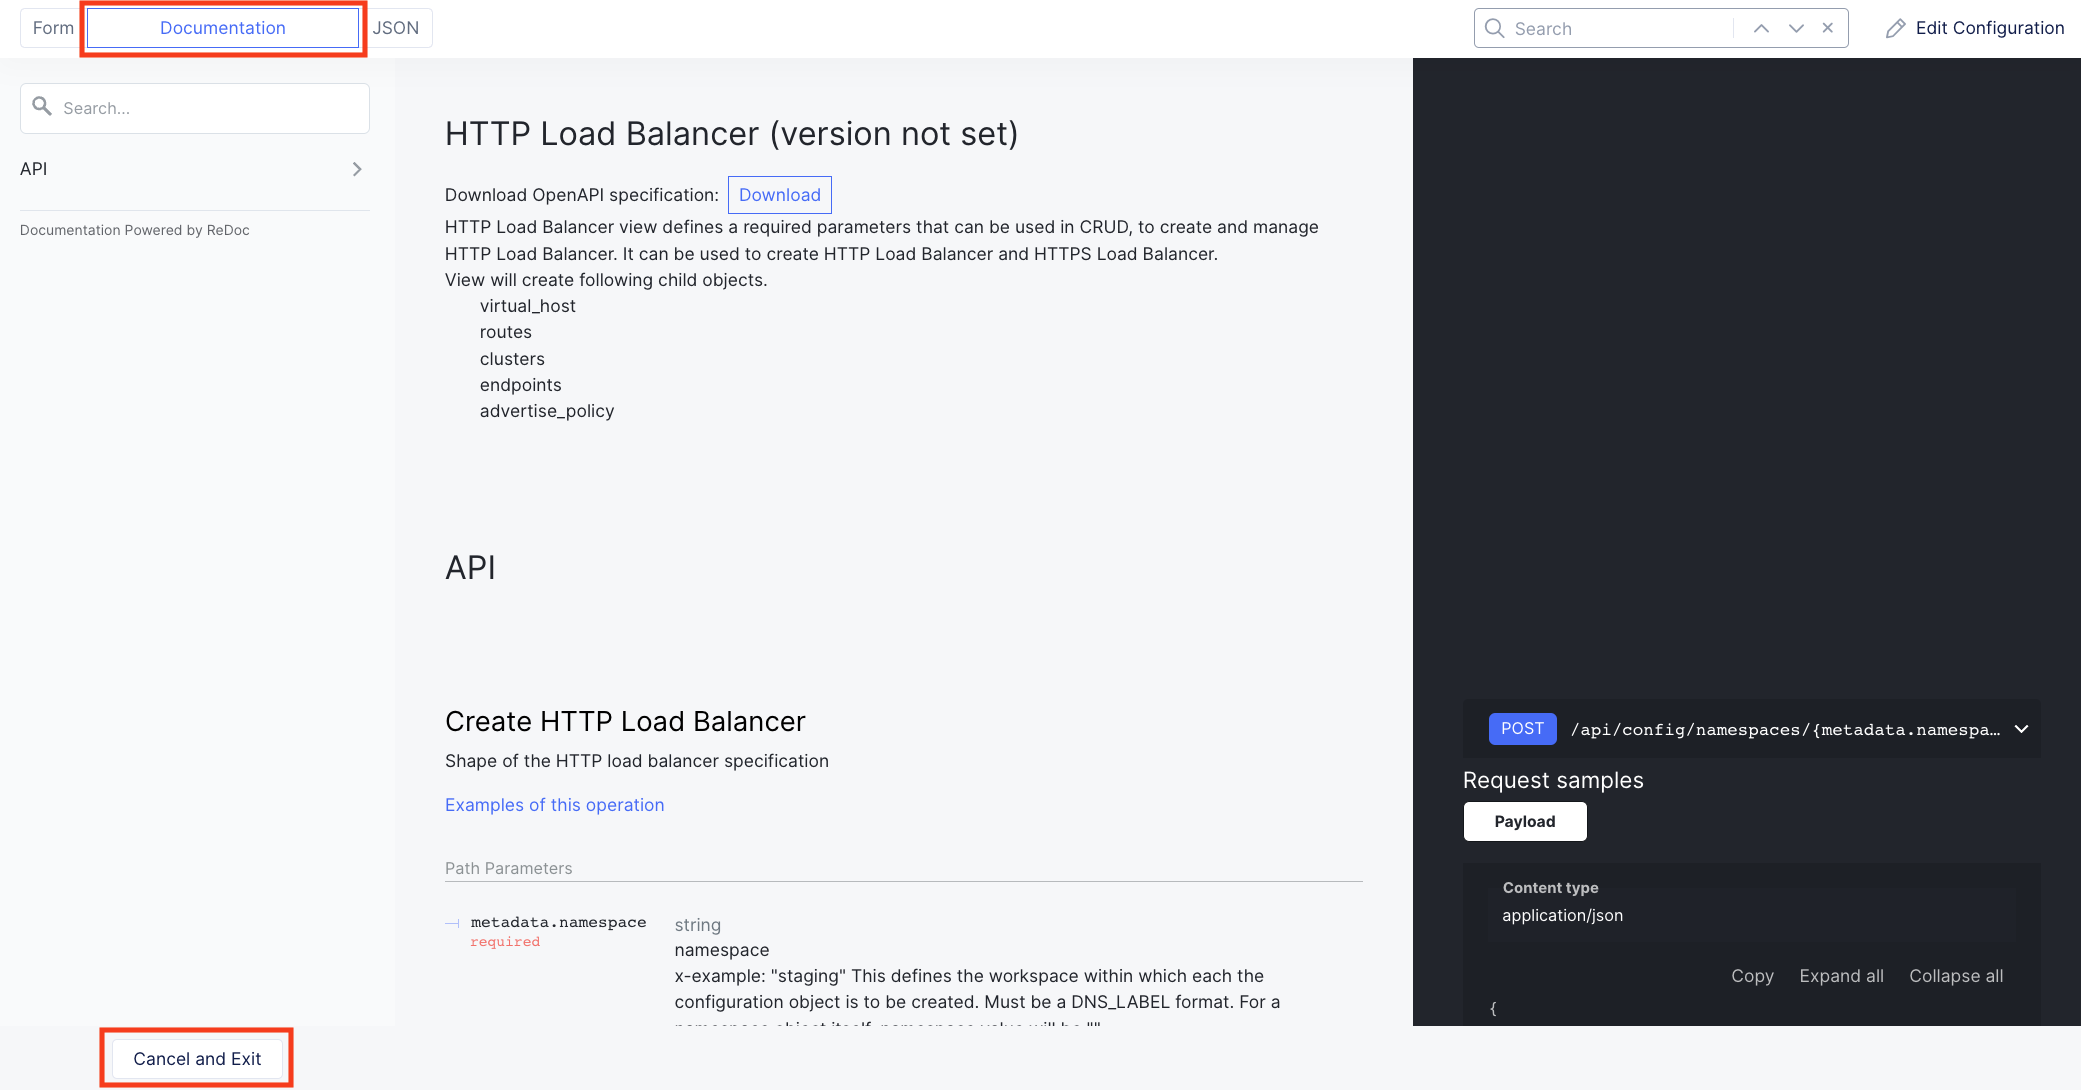
In the resulting screen expand the Actions Menu and click Manage Configuration for the origin pool configured in your namespace. Here you will see the origin server public FQDN of the application running in ACME’s Azure environment. Copy the domain name so you can visit the site directly from your web browser. Click Cancel and Exit to return to the Origin Pools page since you will not need to make any updates to the configuration.
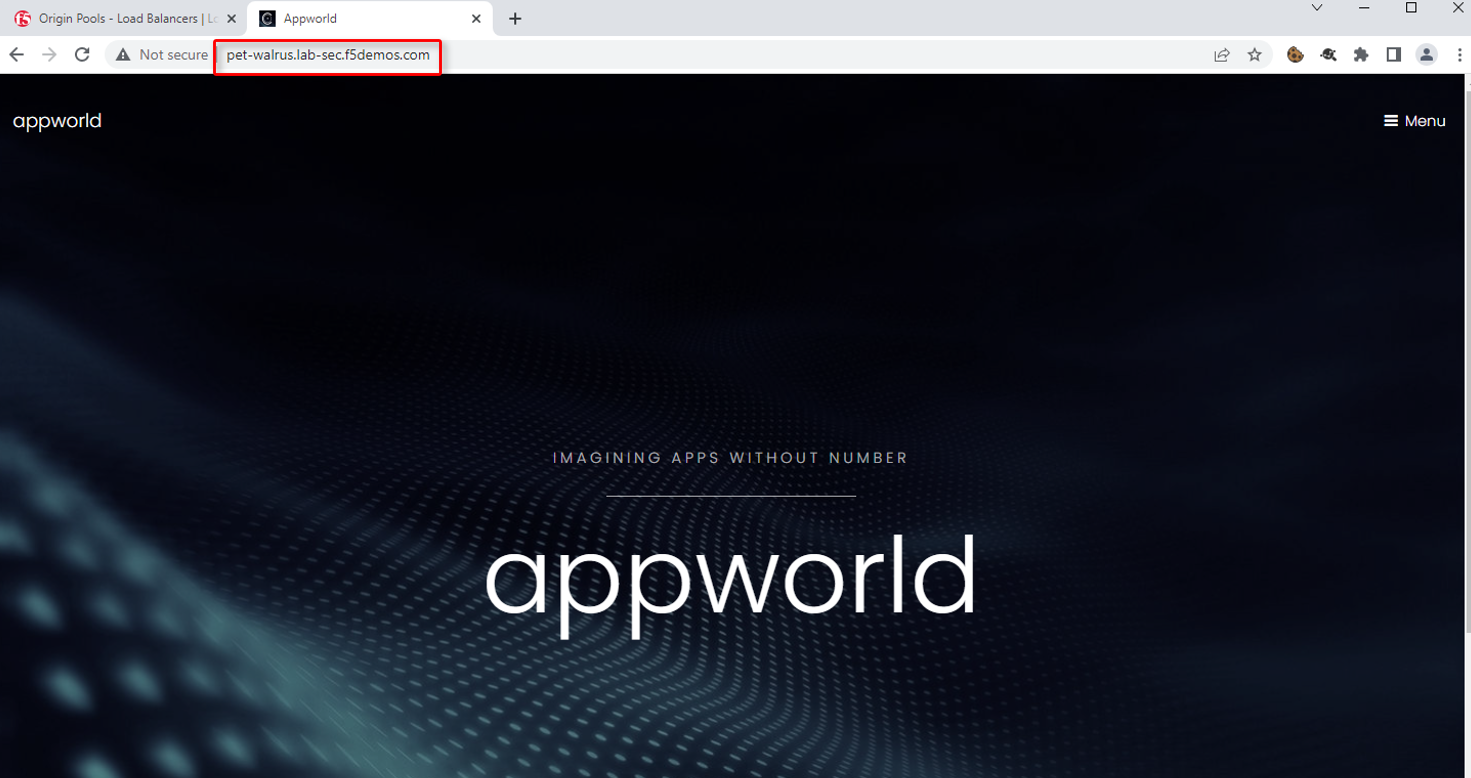
Using your browser, visit this application directly utilizing its public FQDN. Select the Menu on the top right-hand side and select Header.
Note the Remote Address field. This will match the IP address of your endpoint. You can verify that it matches by looking up your IP address at https://ipinfo.io/.
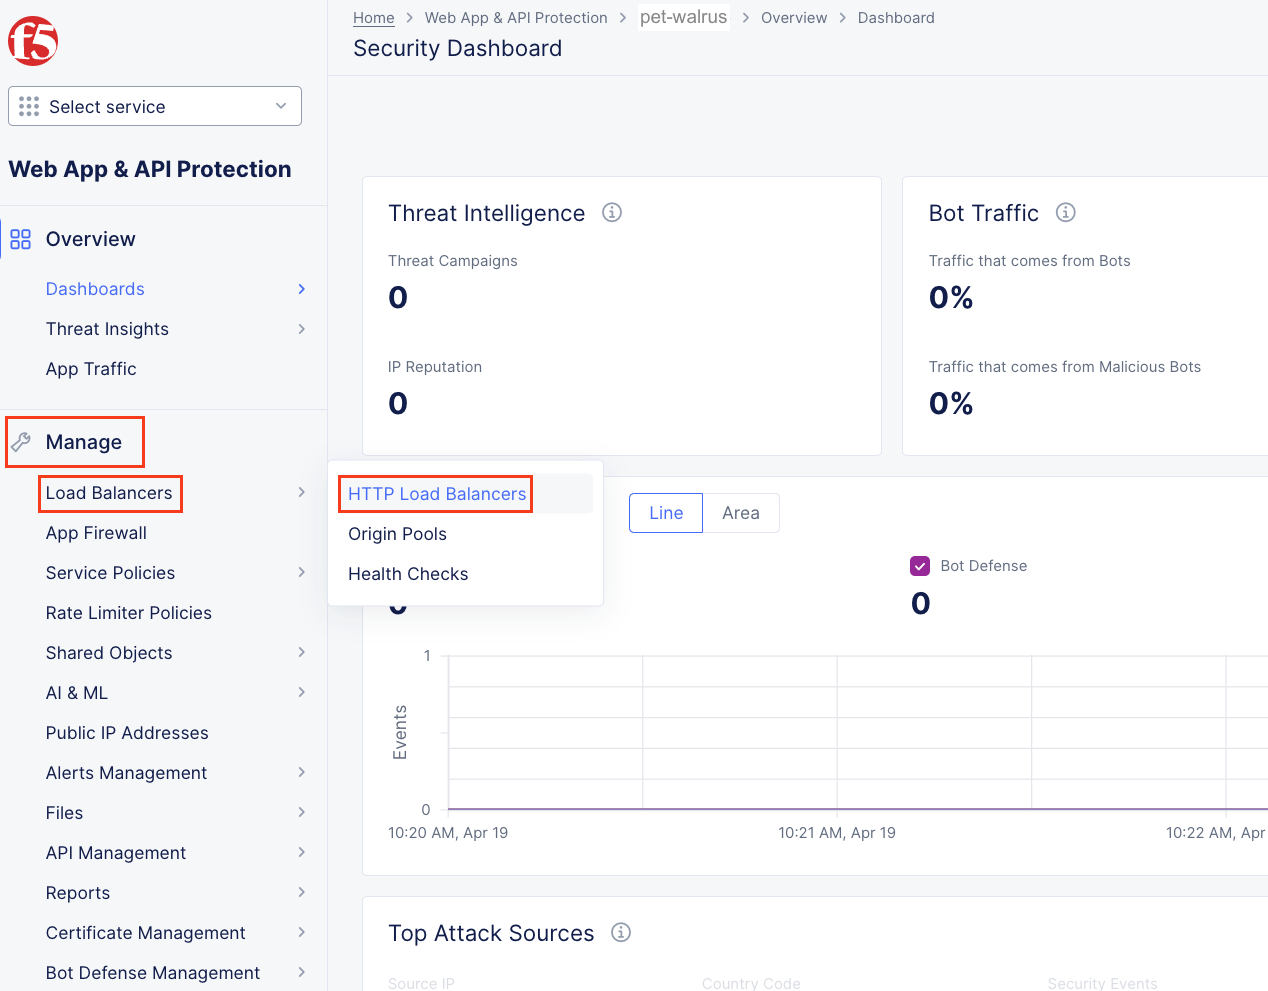
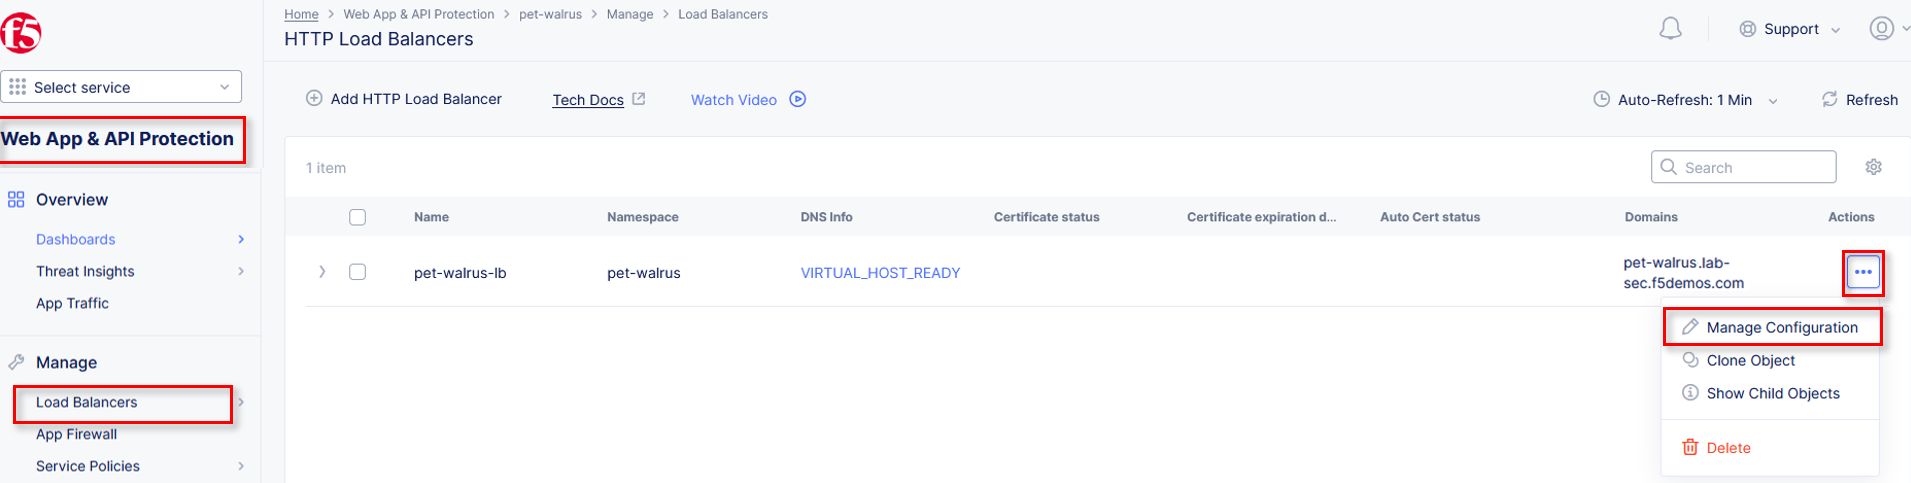
Next, let’s return to the F5 Distributed Cloud console and take a look at the F5 XC load balancer configured for you. In the left-hand navigation expand Manage and click Load Balancers > HTTP Load Balancers
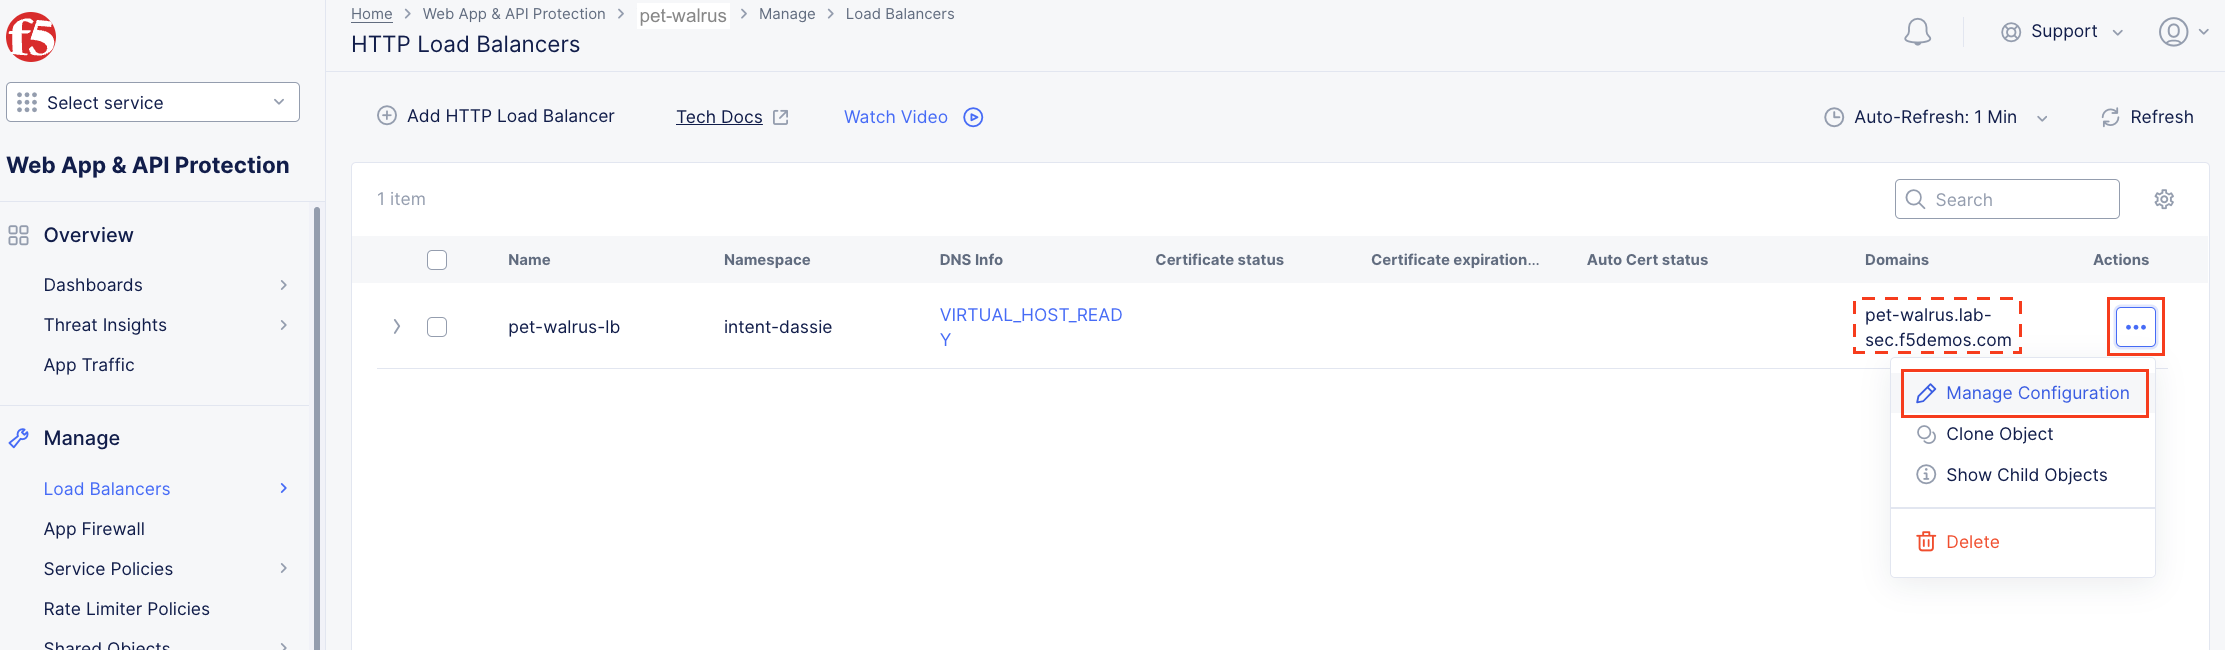
In the resulting screen expand the Actions Menu and click Manage Configuration for the load balancer configured in your namespace. The graphic below is an example. Your environment will have a different load balancer name but it should follow a similar naming convention adjective-animal.
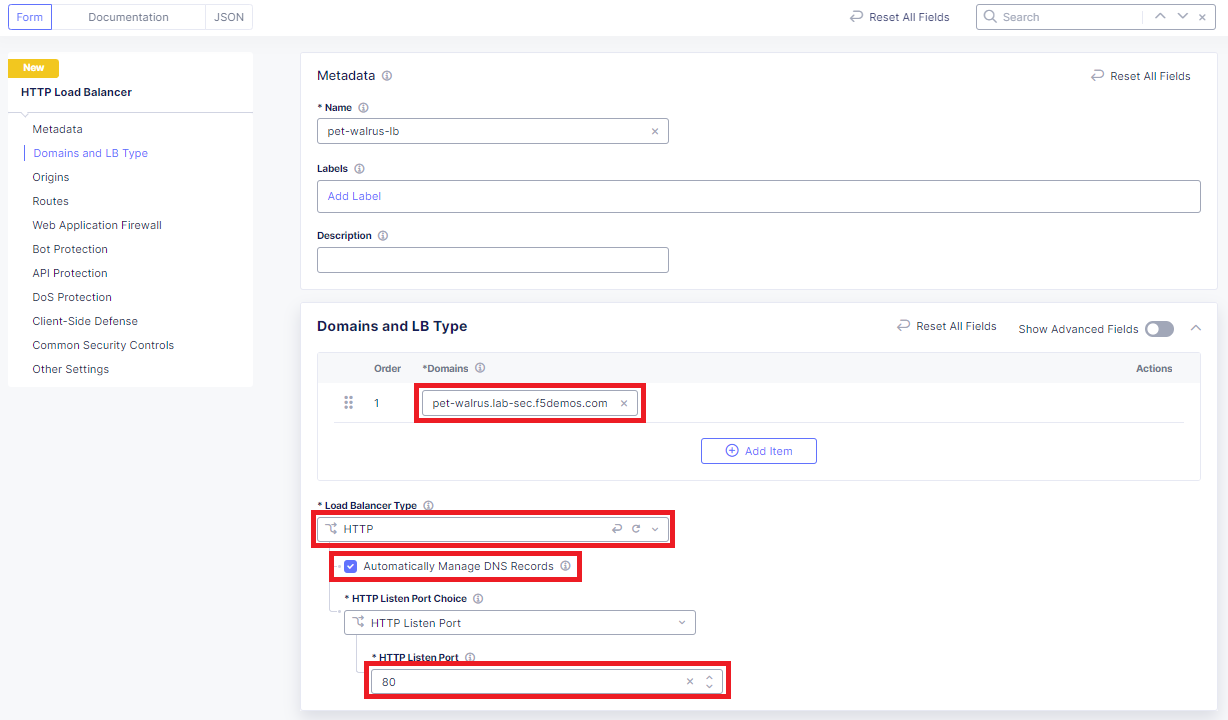
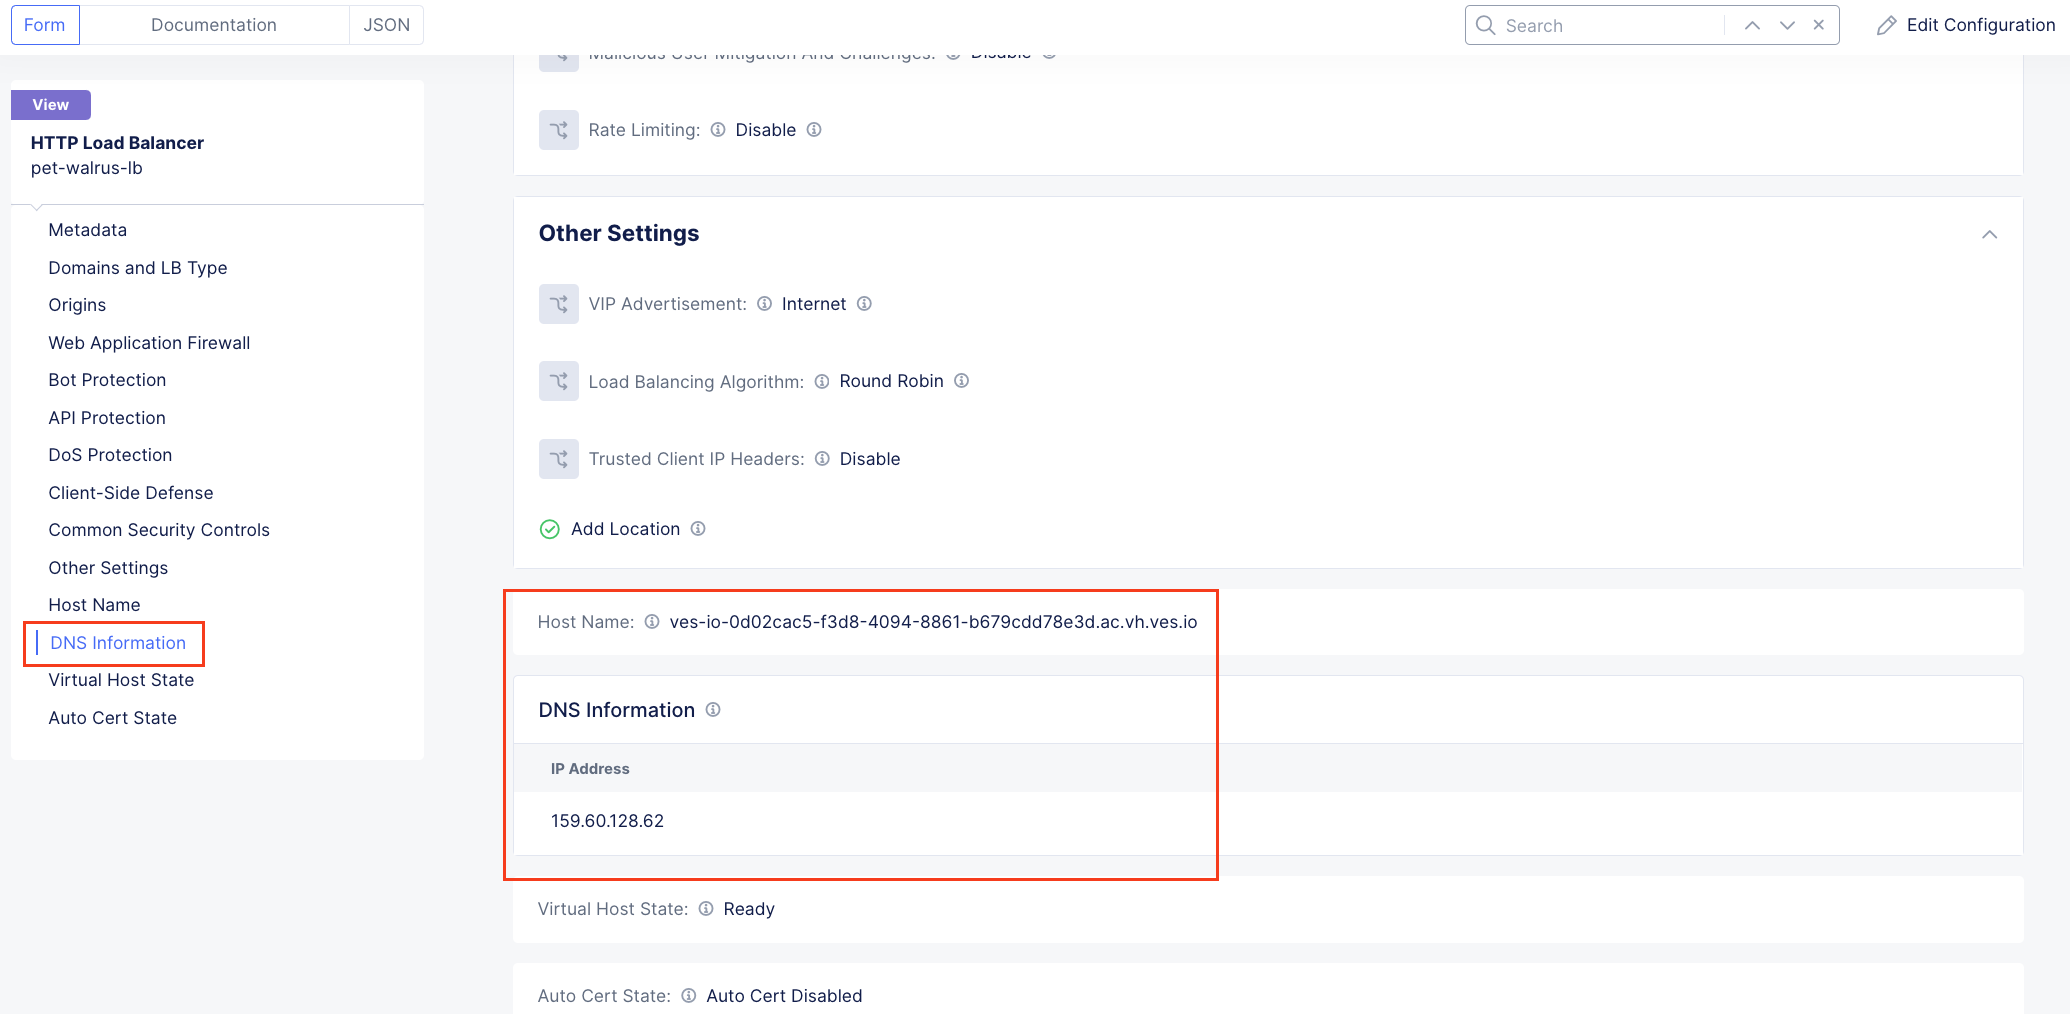
Using the left-hand navigation and in the sections as shown, review the following data. Values where <namespace> adjective-animal is represented, the configuration will be the name of your provisioned namespace. Note the FQDN of the F5 XC load balancer.
Metadata <namespace>-lb
Domains and LB Type <namespace>.lab-sec.f5demos.com
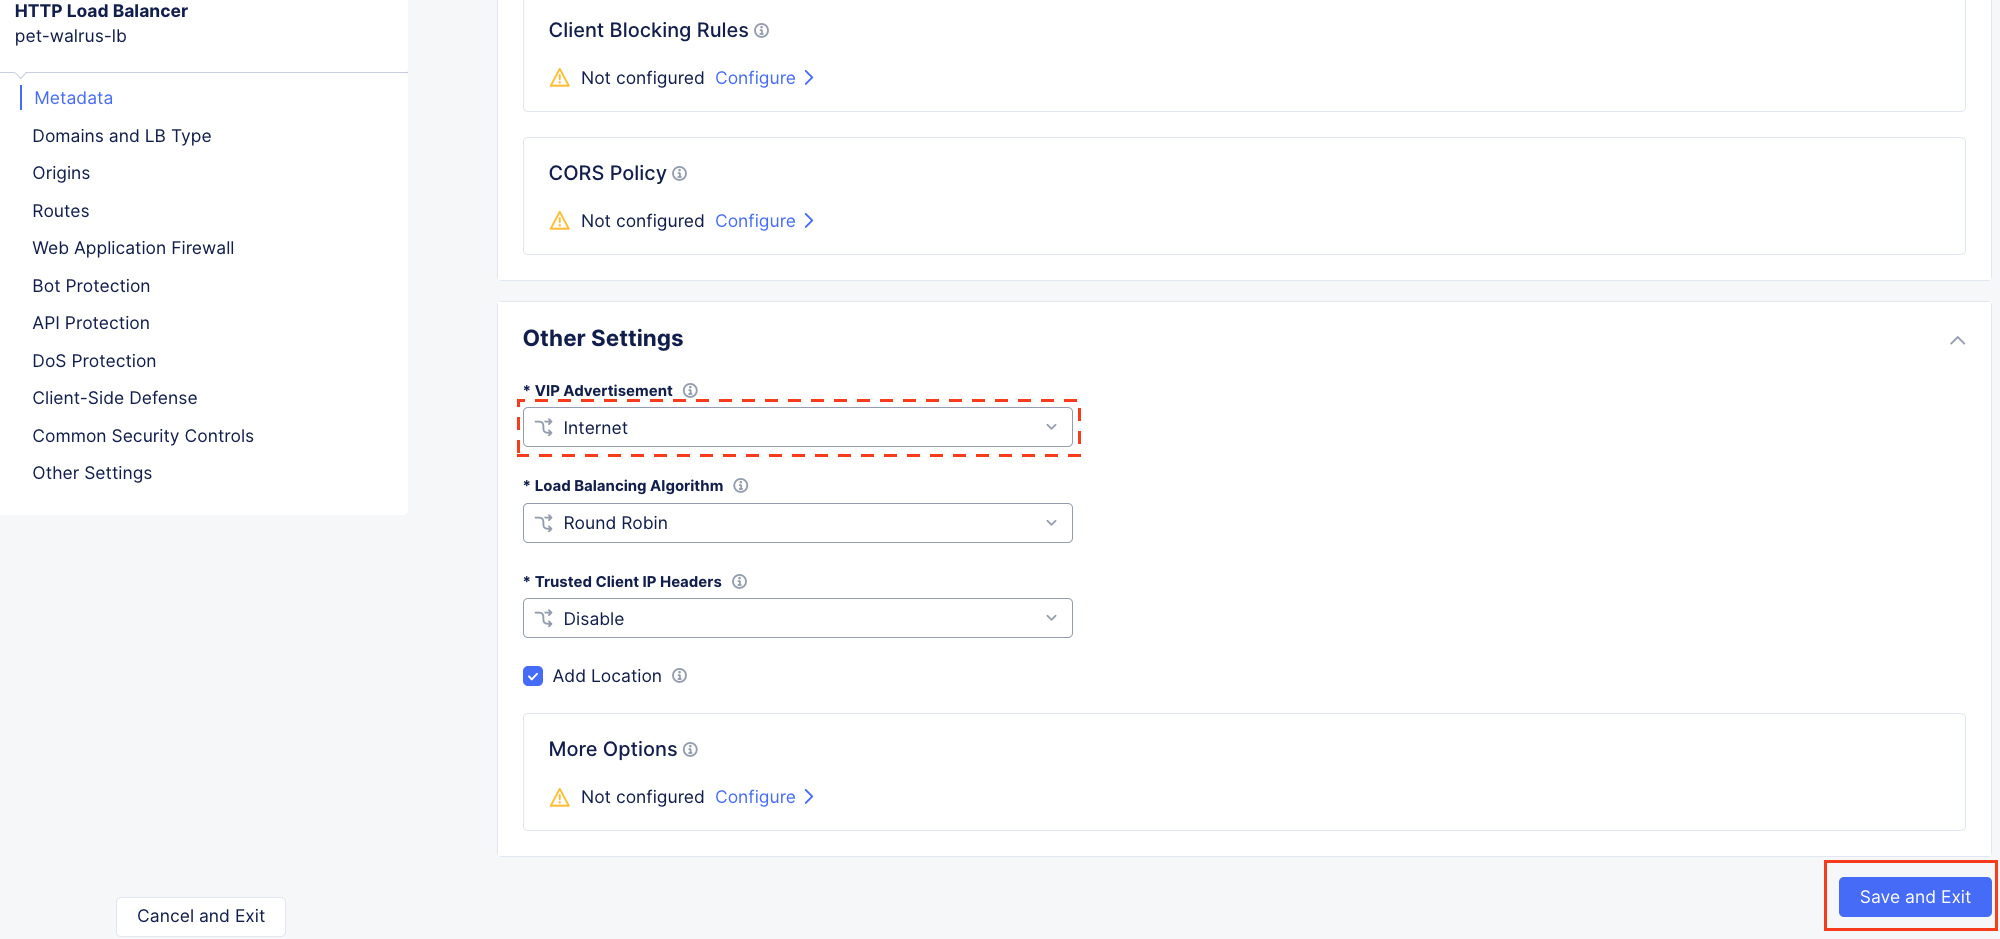
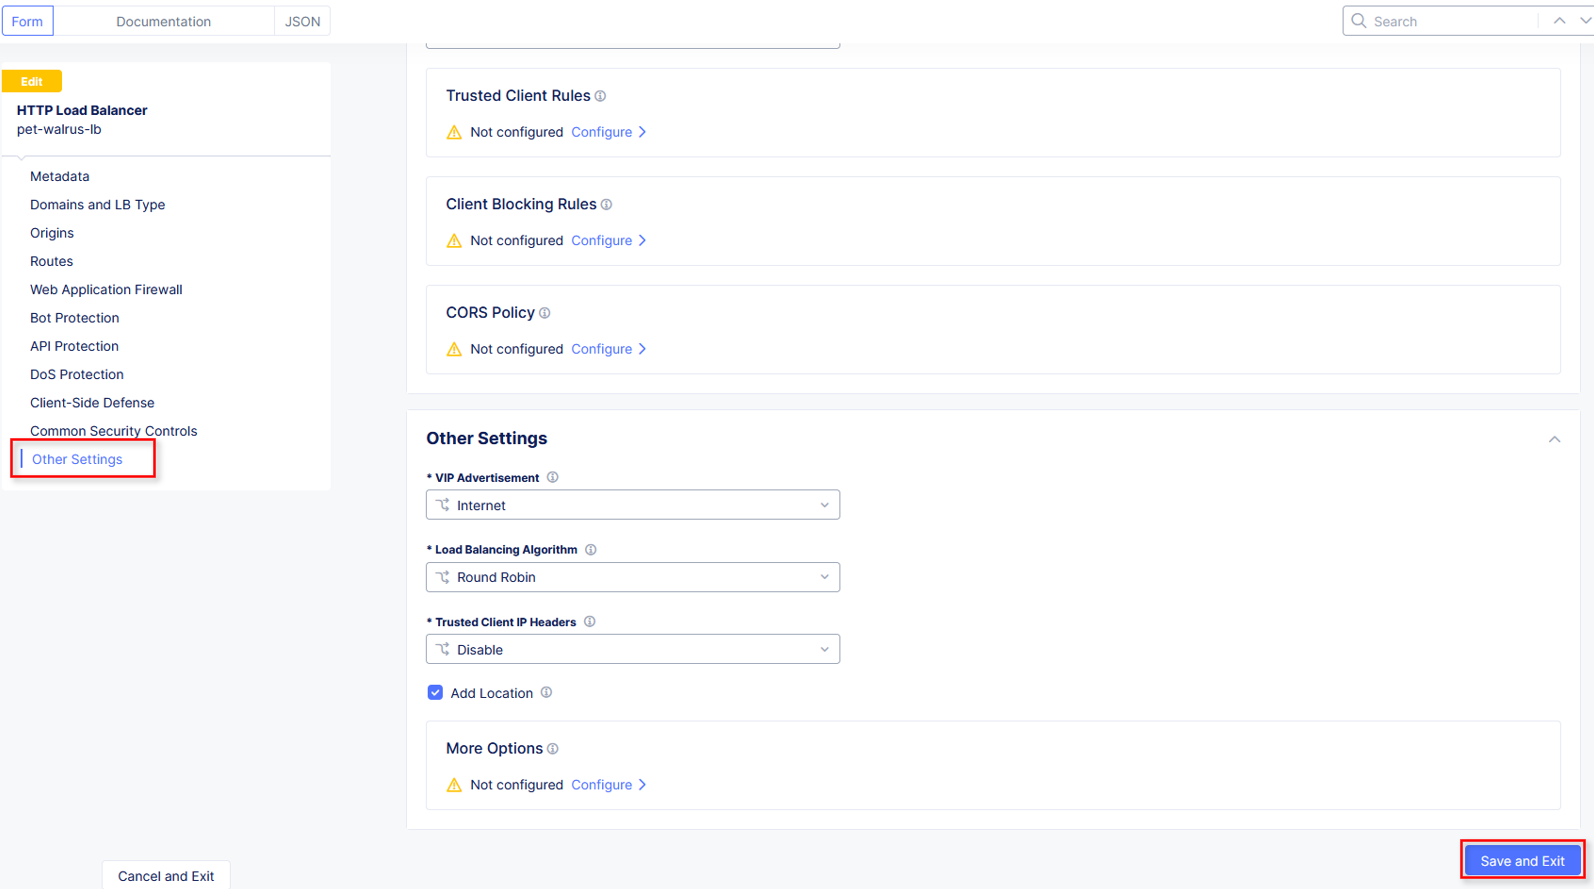
Other Settings VIP Advertisement
Note
The VIP Advertisement selection controls how/where the application is advertised. The “Internet” setting means that this application will be advertised globally from the F5 Distributed Cloud Global Network utilizing Anycast.
Using your web browser, access the application via the F5 XC FQDN. Click on Menu > Header
Note that the Remote Address has changed as well as the presence of a new X-Forwarded-For header. The client information should have changed as you are now connecting first through the F5 ADN Regional Edge before being proxied the the application running the ACME Corp Azure environment. X-Forwarded-For details should match your client IP address.
Task 2: Configure WAF Policy on the Load Balancer
The following steps will guide you through adding a Web Application Firewall (WAF) Policy. These steps will demonstrate various aspects of the configuration.
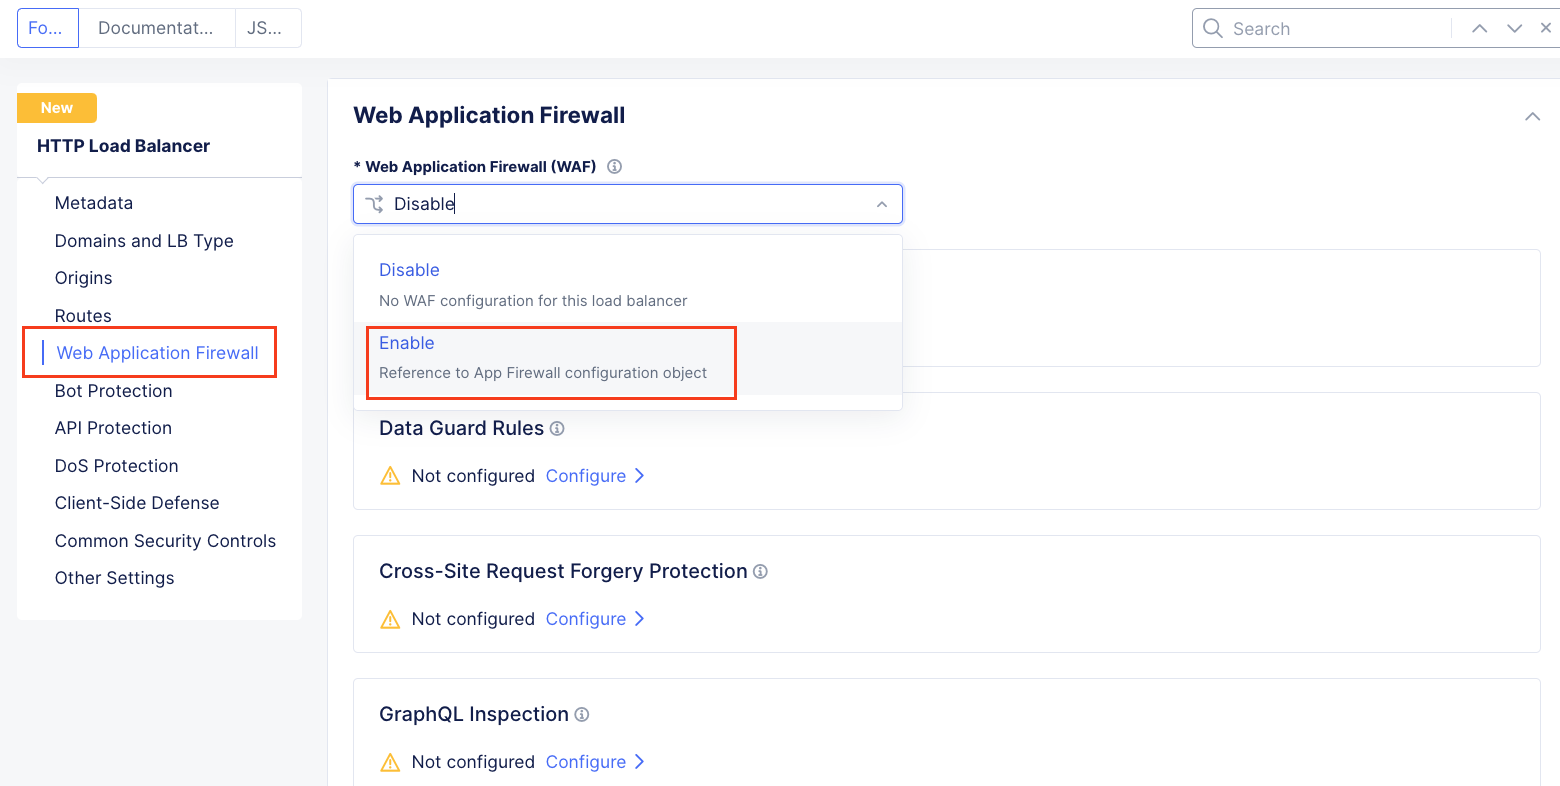
Returning back to the F5 XC console and continuing in the HTTP Load Balancer section, in the upper right hand corner select Edit Configuration and then in the left hand menu click on the Web Application Firewall (WAF) drop down and select Enable.
 ‘’
‘’
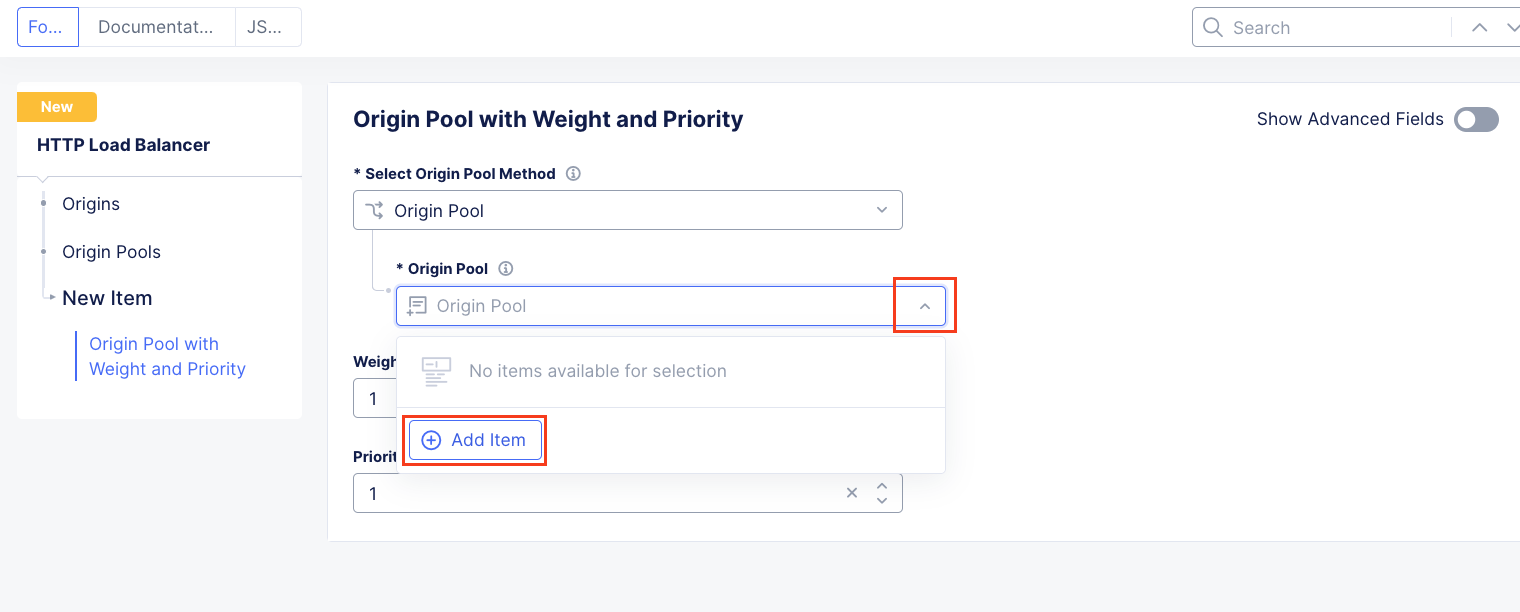
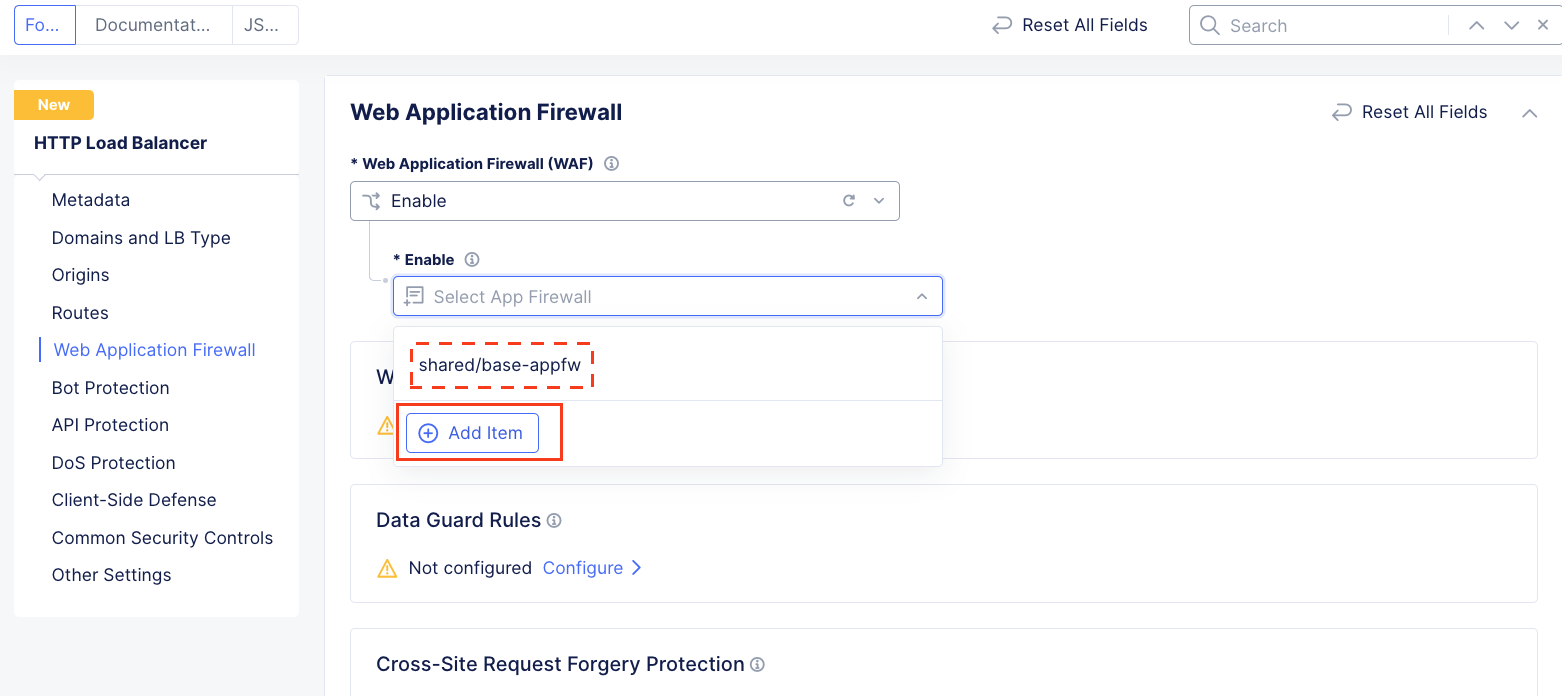
In the resulting Enable field drop down, select Add Item.
Note
The “shared/base-appfw” policy is in the “shared namespace” which can be applied to multiple Load Balancer configurations across namespaces, reducing policy sprawl.
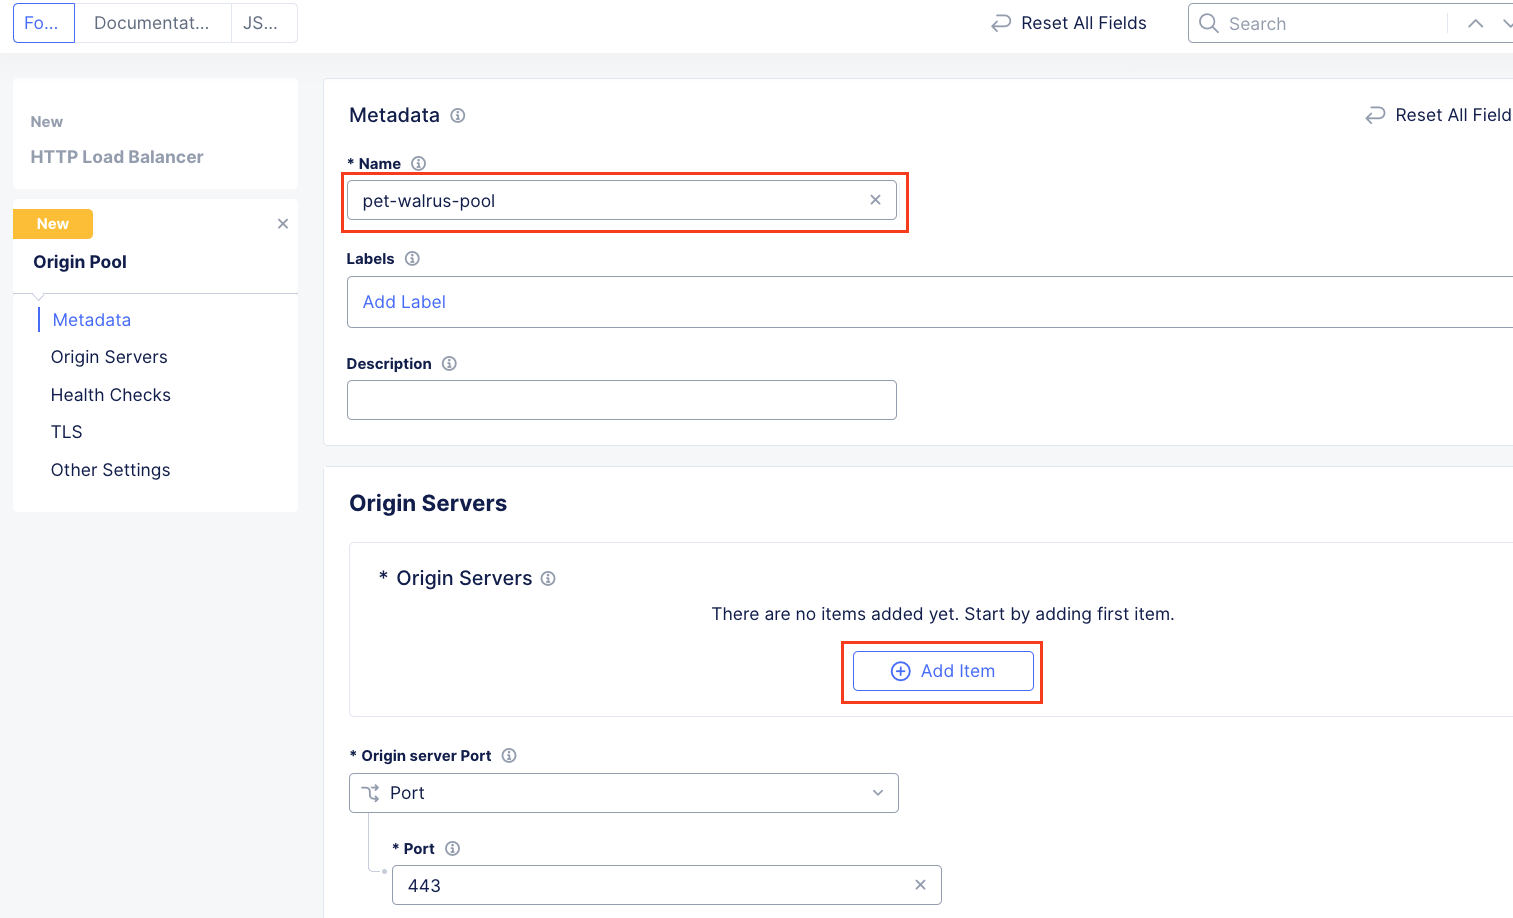
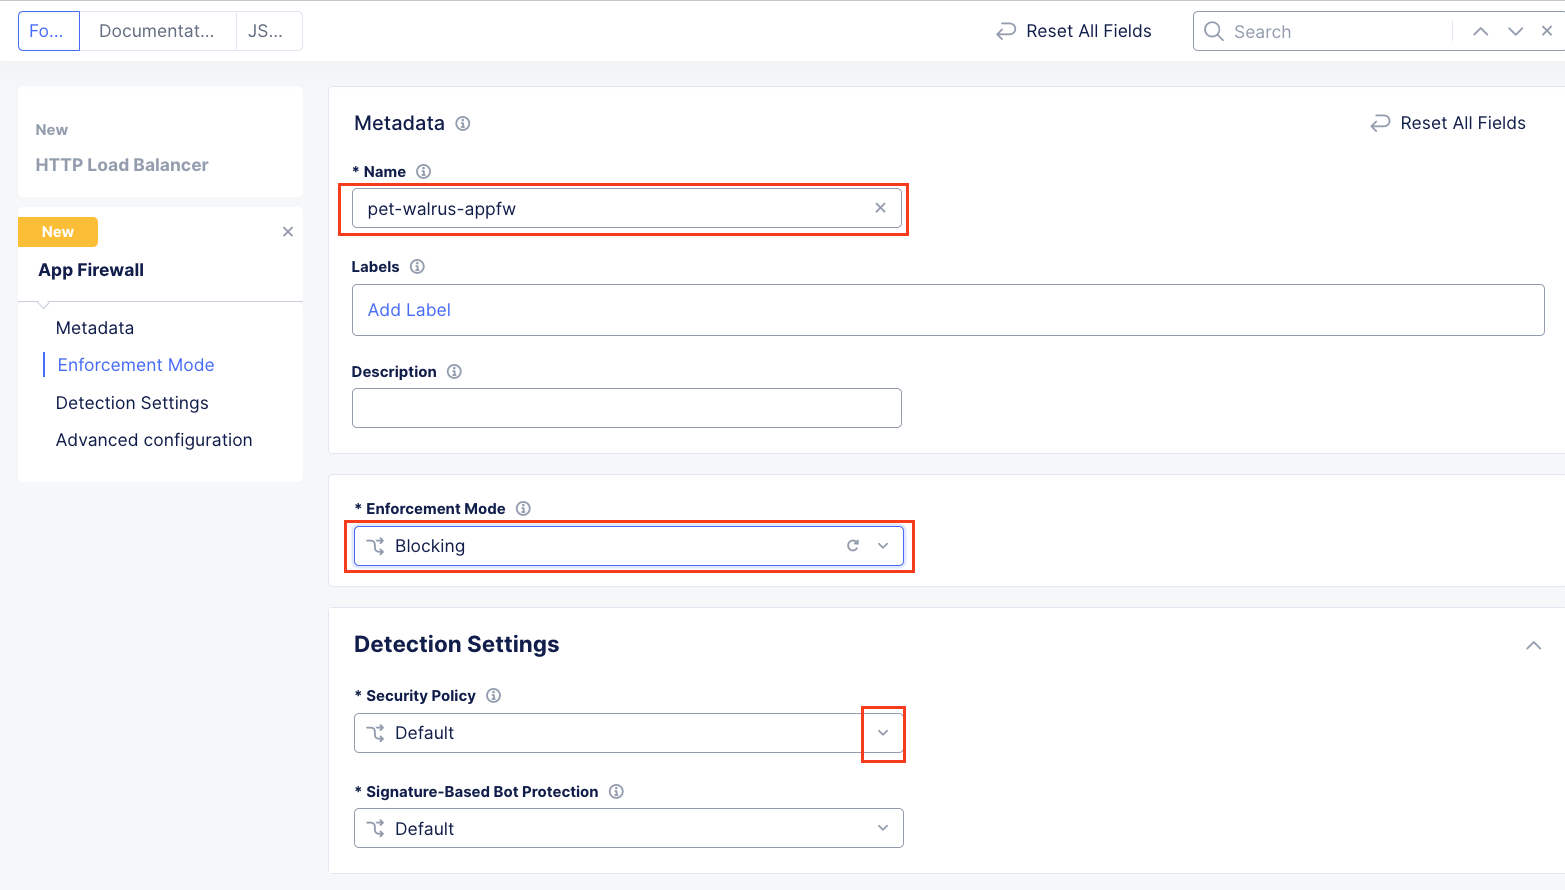
In the new window’s Metadata section enter <namespace>-appfw for the Name.
Under Enforcement Mode, change the mode to Blocking.
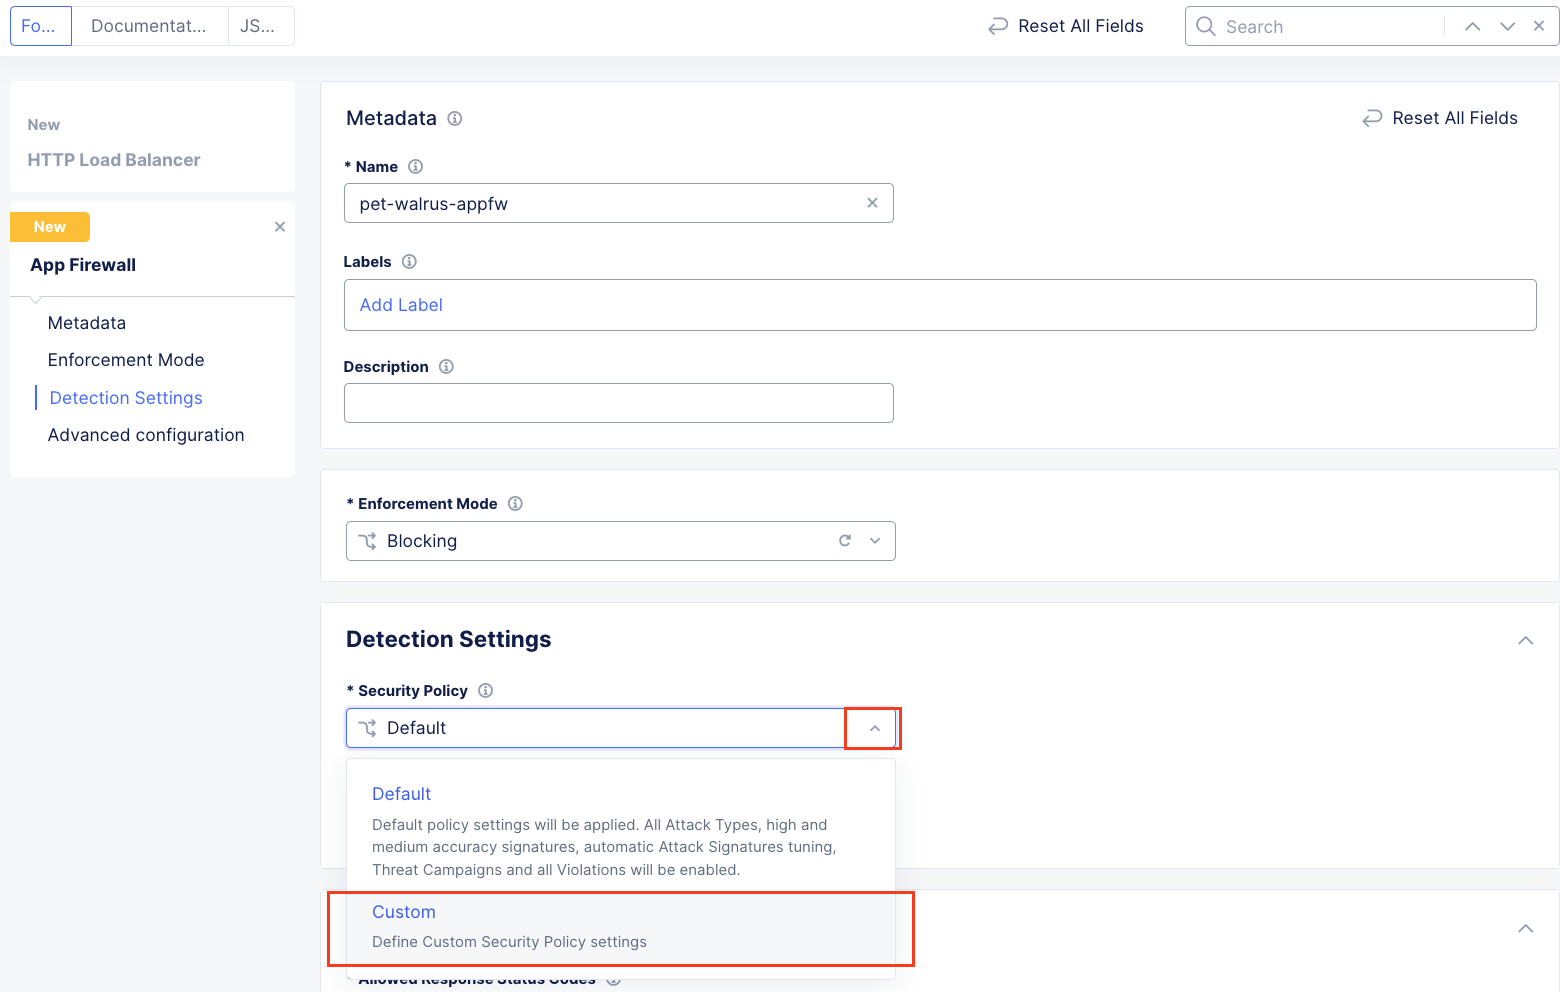
In the Detection Settings section, click the Security Policy dropdown.
Select Custom from the dropdown menu. Additional configurations will become available
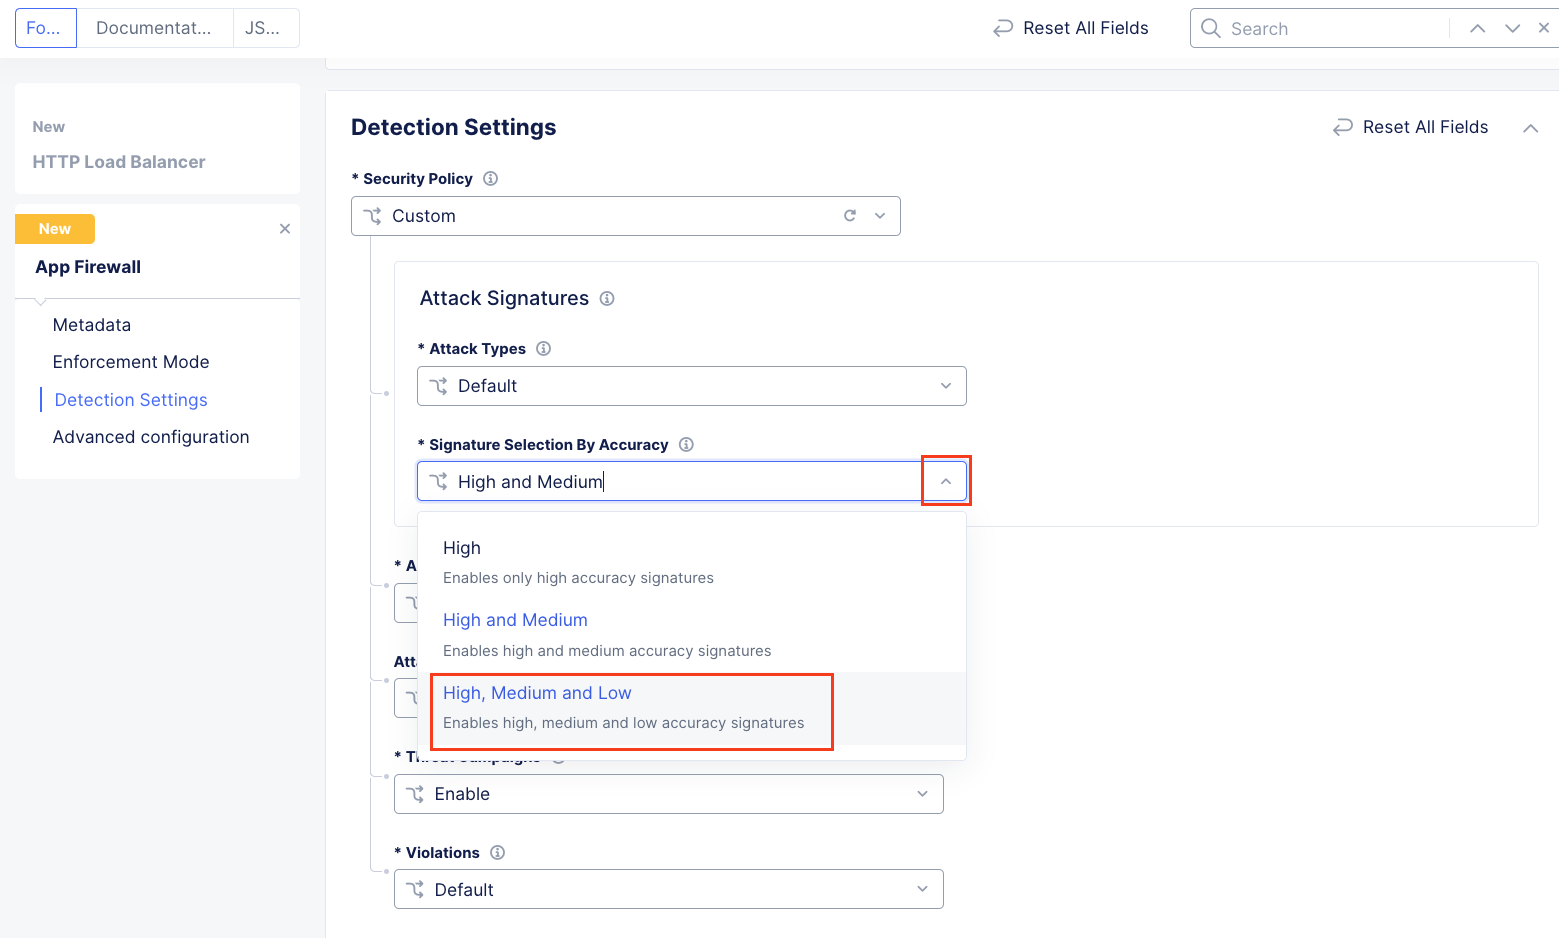
In the expanded configuration, in the Attack Signatures section use the dropdown for Signature Selection by Accuracy and select High, Medium, and Low.
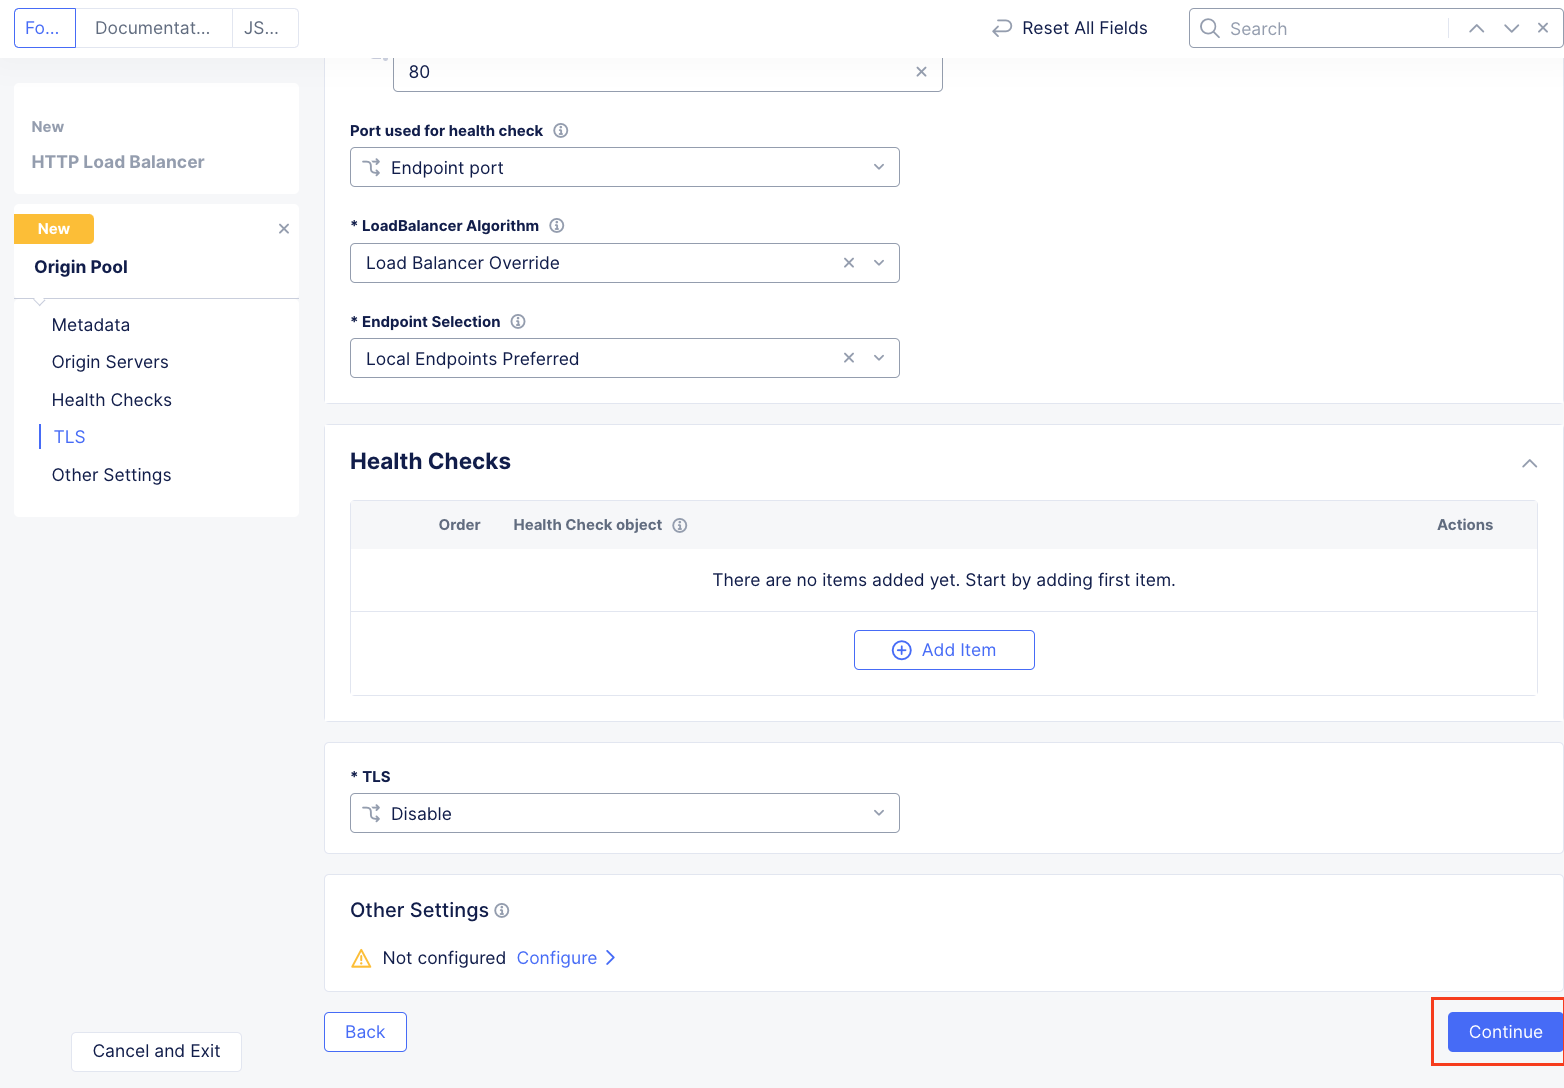
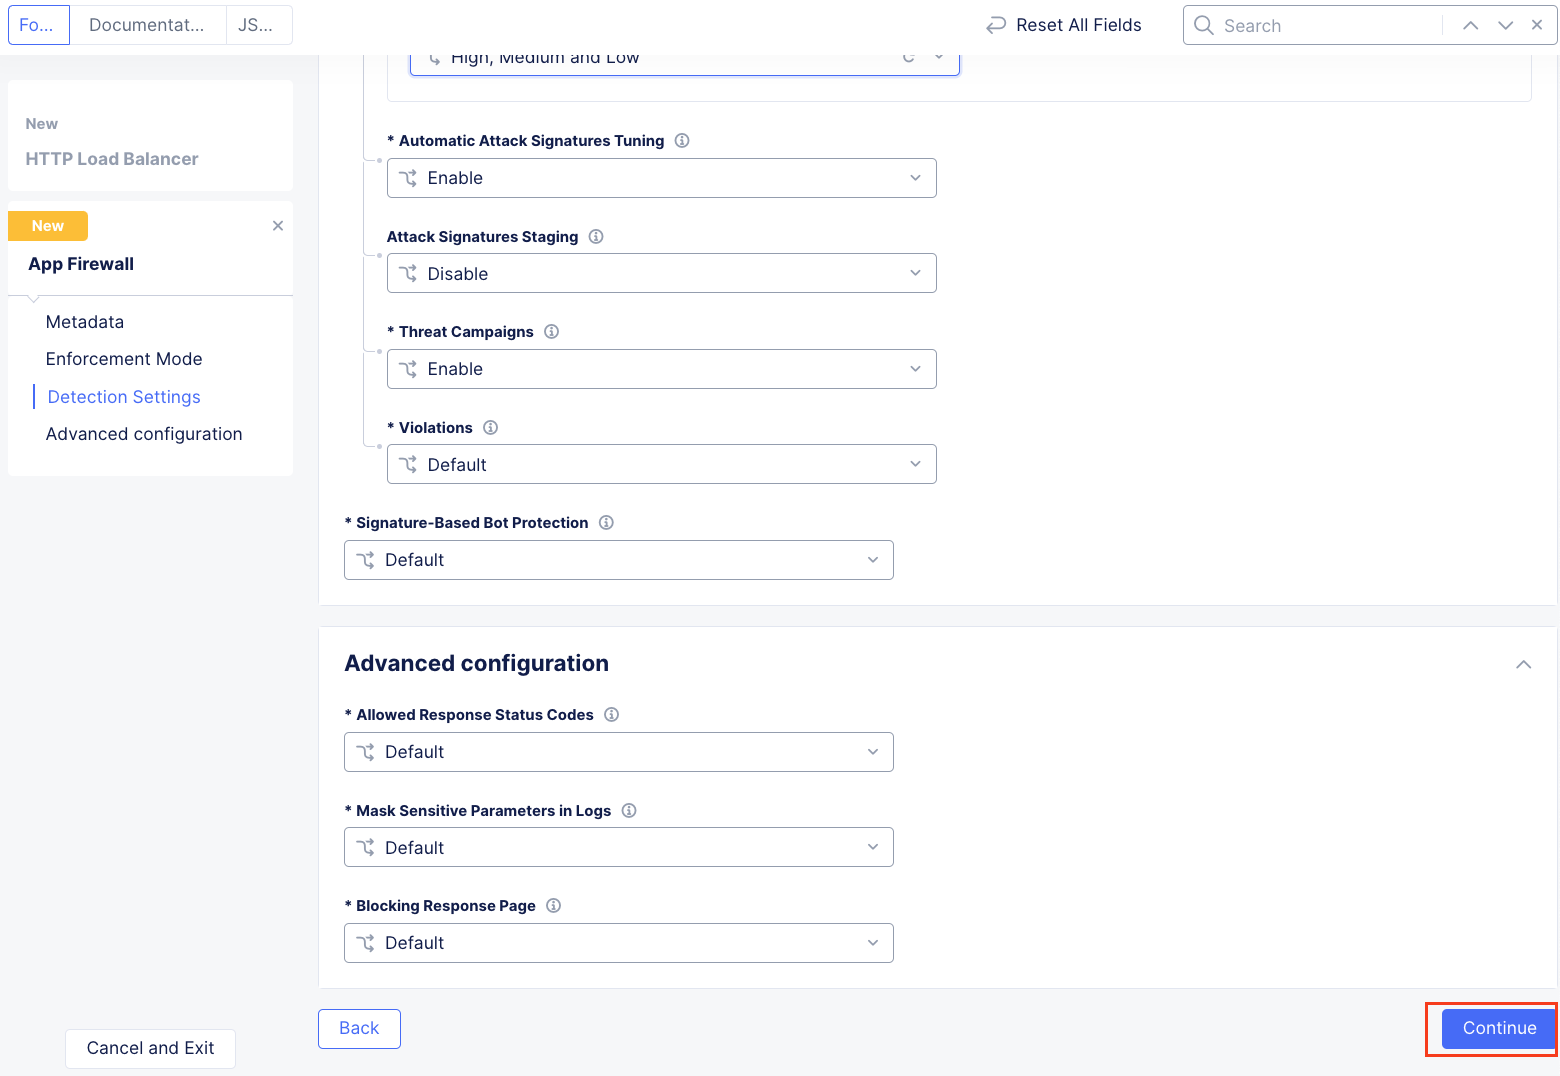
Leaving all other values as default, scroll to the bottom and click Continue.
Note
Automatic Attack Signatures Tuning is enabled which engages an automatic False Positive suppression engine. Any suppressed events are logged within Security Events.
Note
Attack Signatures Staging is disabled. This can be enabled should an Application Firewall with new or updated attack signatures be staged (monitored) for a period of prior to enforcement (blocking).
Returning to the HTTP Load Balancer window, scroll to the bottom and click click Save and Exit at the bottom of the HTTP Load Balancer configuration screen.
Narrative Check
You’ve built your first WAF policy on F5 Distributed Cloud. This WAF policy can be applied to any additional load balancers deployed in this namespace. The F5 XC WAAP suite can be configured to protect applications across your on-prem data center, Azure, AWS, GCP and SAAS environments. This allows your team to uniformly manage application security across all of your public, private and SAAS applications. Now that you are familiar with how to build WAF policies on F5 Distributed Cloud, we can start getting our hands dirty with testing to ensure the ACME Azure application is protected.
Task 3: Testing the WAF Policy & Reviewing Event Data
You will now perform basic testing of the Web Application Firewall (WAF) Policy. You will also review the generated event data to make additional configuration changes.
Open another tab in your browser (Chrome shown), navigate to the newly configured Load Balancer configuration: http://<namespace>.lab-sec.f5demos.com, to confirm it is functional.
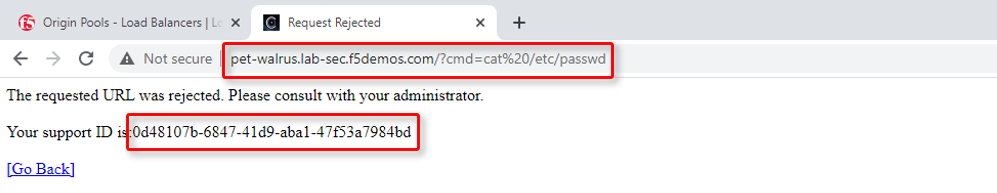
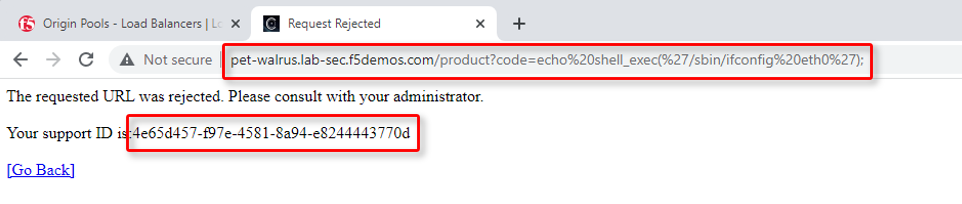
Using some of the sample attacks below, add the URI path & variables to your application to generate security event data.
/?cmd=cat%20/etc/passwd/product?id=4%20OR%201=1/../../../../etc/shadow/product?code=echo%20shell_exec(%27/sbin/ifconfig%20eth0%27);/cart?search=aaa'><script>prompt('Please+enter+your+password');</script>
In the resulting block screens, note the URL and the Support ID. (copy and paste to a notepad or note resource).
Narrative Check
The ACME Azure application is now being successfully protected by F5 Distributed Cloud.
Returning to the F5 Distributed Cloud Console, use the left-hand menu to select Overview > Performance section. This dashboard will provide a summary view for all of the configured Load Balancers.
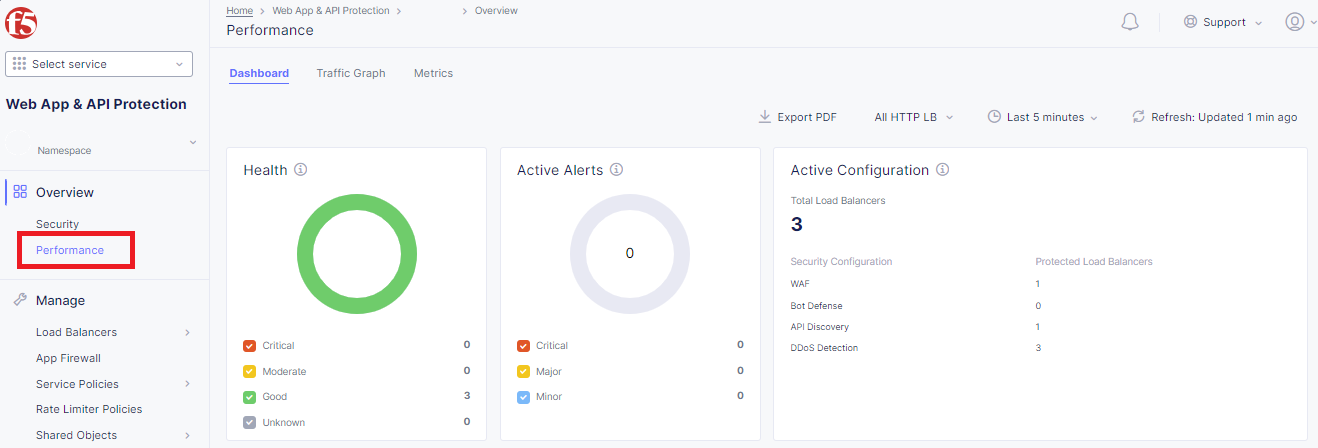
Note
As you have not run many requests, summary analytics may not be available in the dashboard view yet.
Scroll to the bottom and select your load balancer.
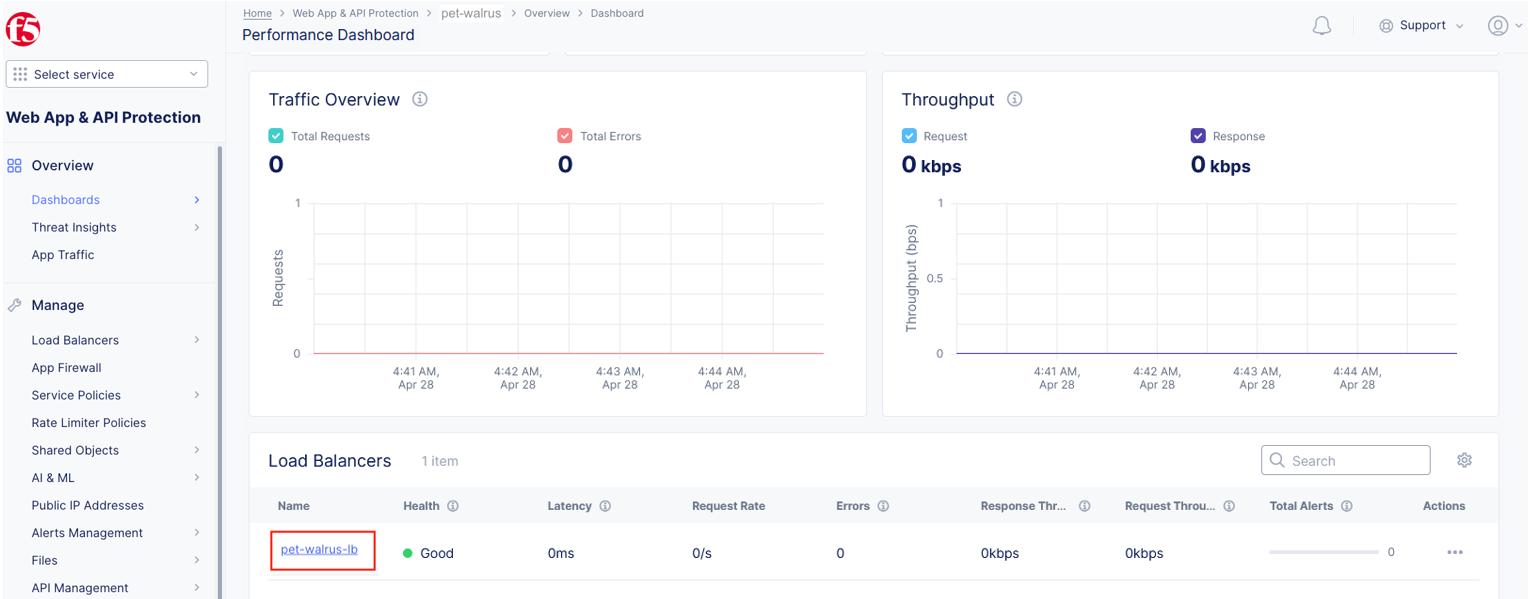
From the Performance Dashboard view, using the horizontal navigation, click Requests.
Change the viewable time period from 5 minutes (default) to 1 hour by selecting the dropdown shown, click Last 1 hour then click Apply.
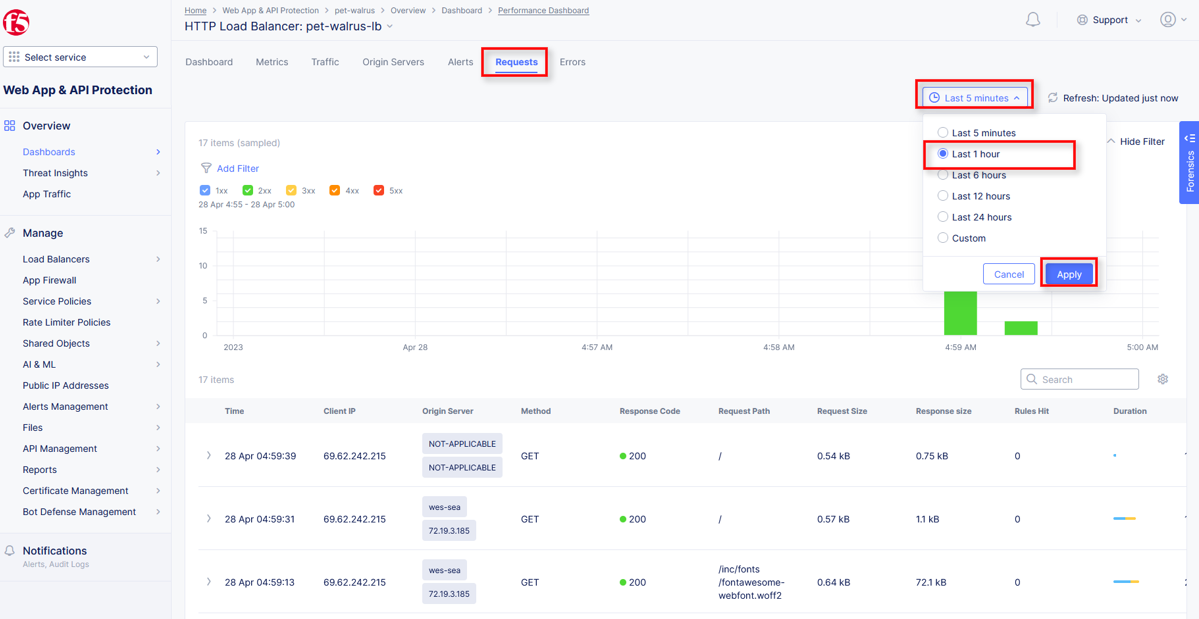
Note
Security Event data may take 15-20 seconds to populate in the Console. Please force a refresh using the Refresh icon next to the Time Period selection in step 6.
Expand one of the requests and note the Information tab link. This summarizes request details and provides request duration timing.
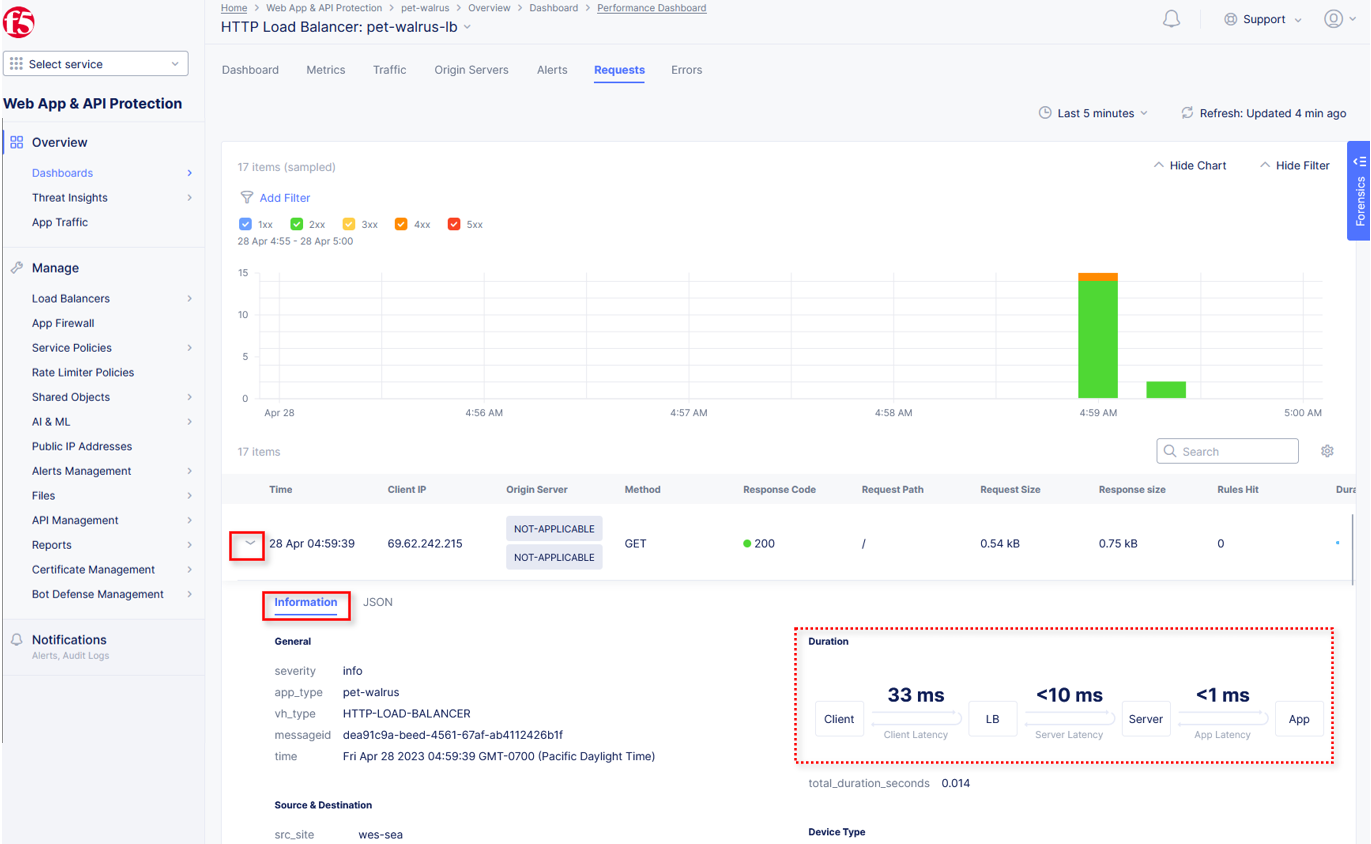
Click on the JSON link to get more data about the request.
Click Add Filter as shown to see how you can filter by key identifiers.
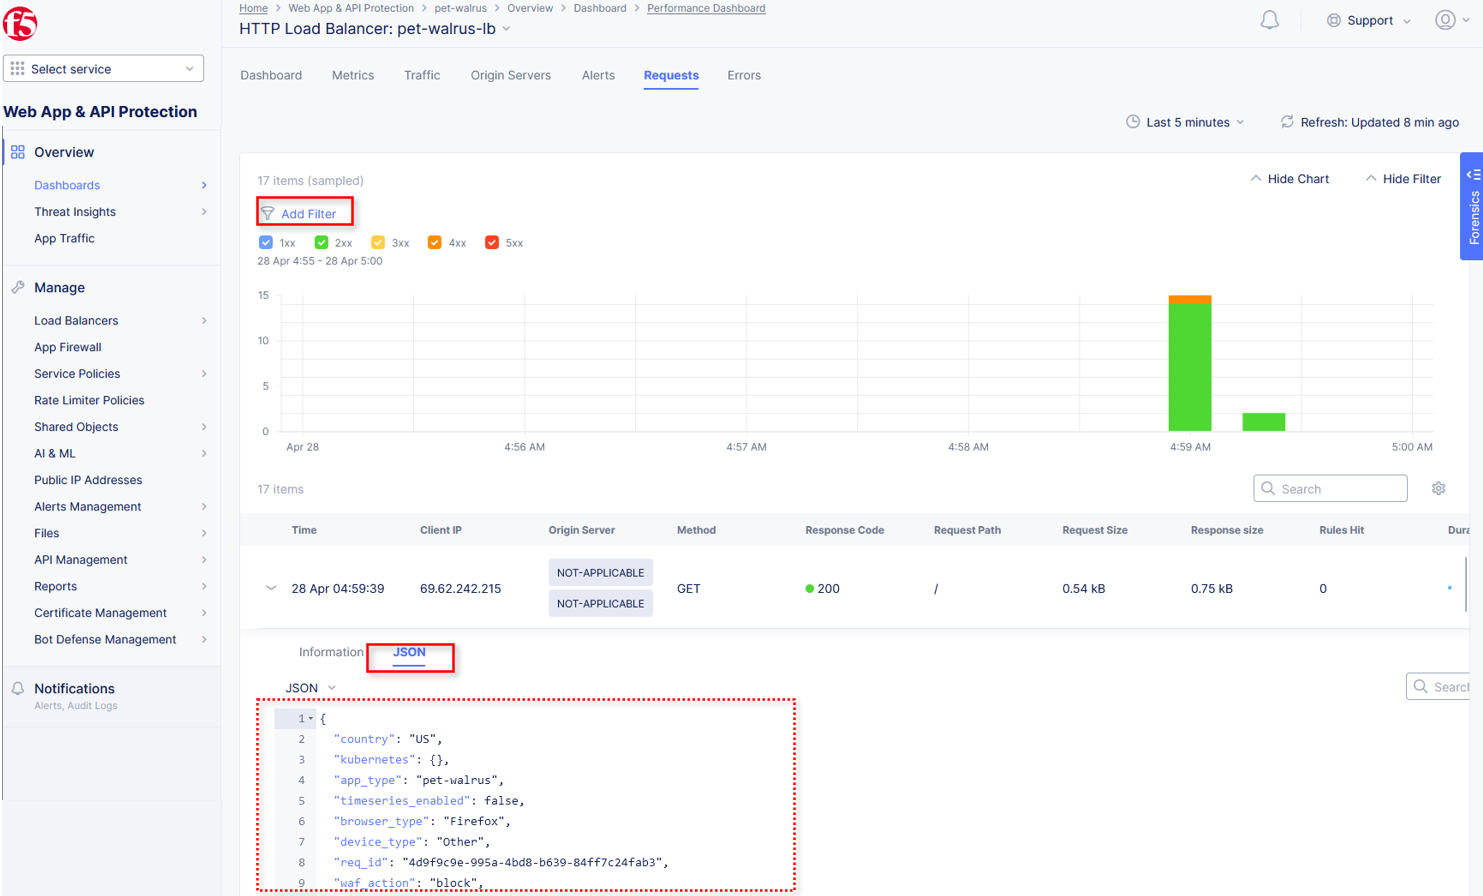
The resulting Search input field and listed Keys, can be used to filter requests in this view.
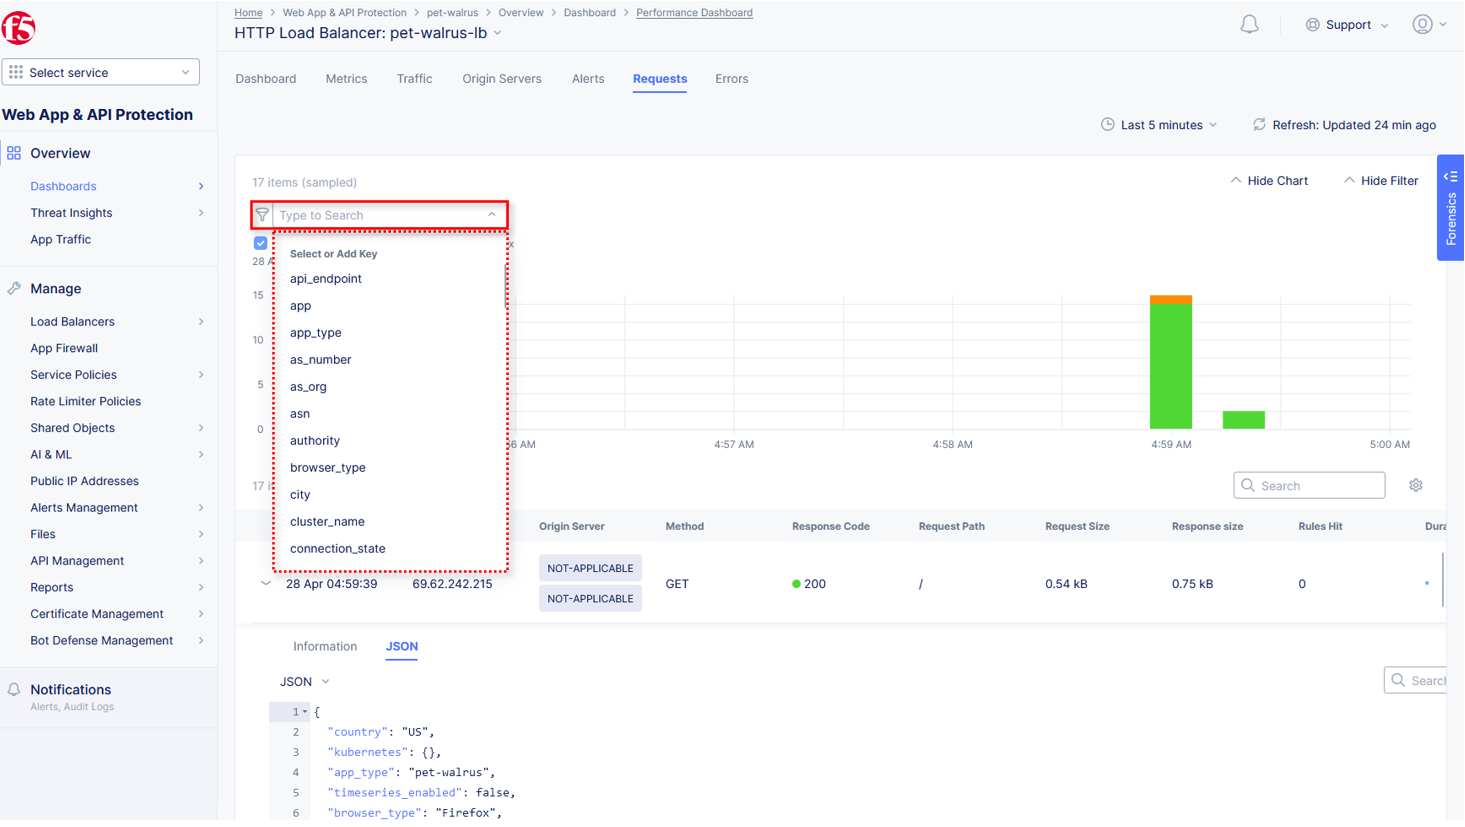
Note
The available Key list to search is dynamically updated based on the requests in the selected time view.
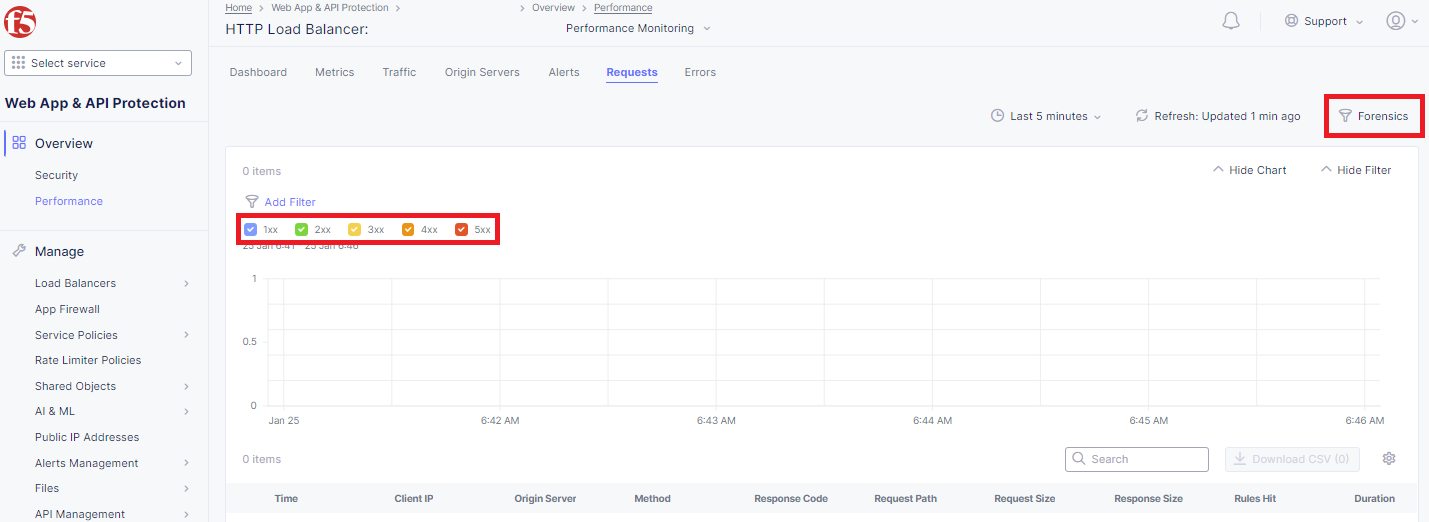
Closing the filters view, note the available Quick Filters for Response Codes which allows quickly filtering the requests by toggling on or off each response code category.
Click the Forensics tab on the right side of the view as shown.
The Forensics Filter provides summarized top categories which provides quicker analysis of the request log data. Collapse the Forensics view when done using the indicated arrow.
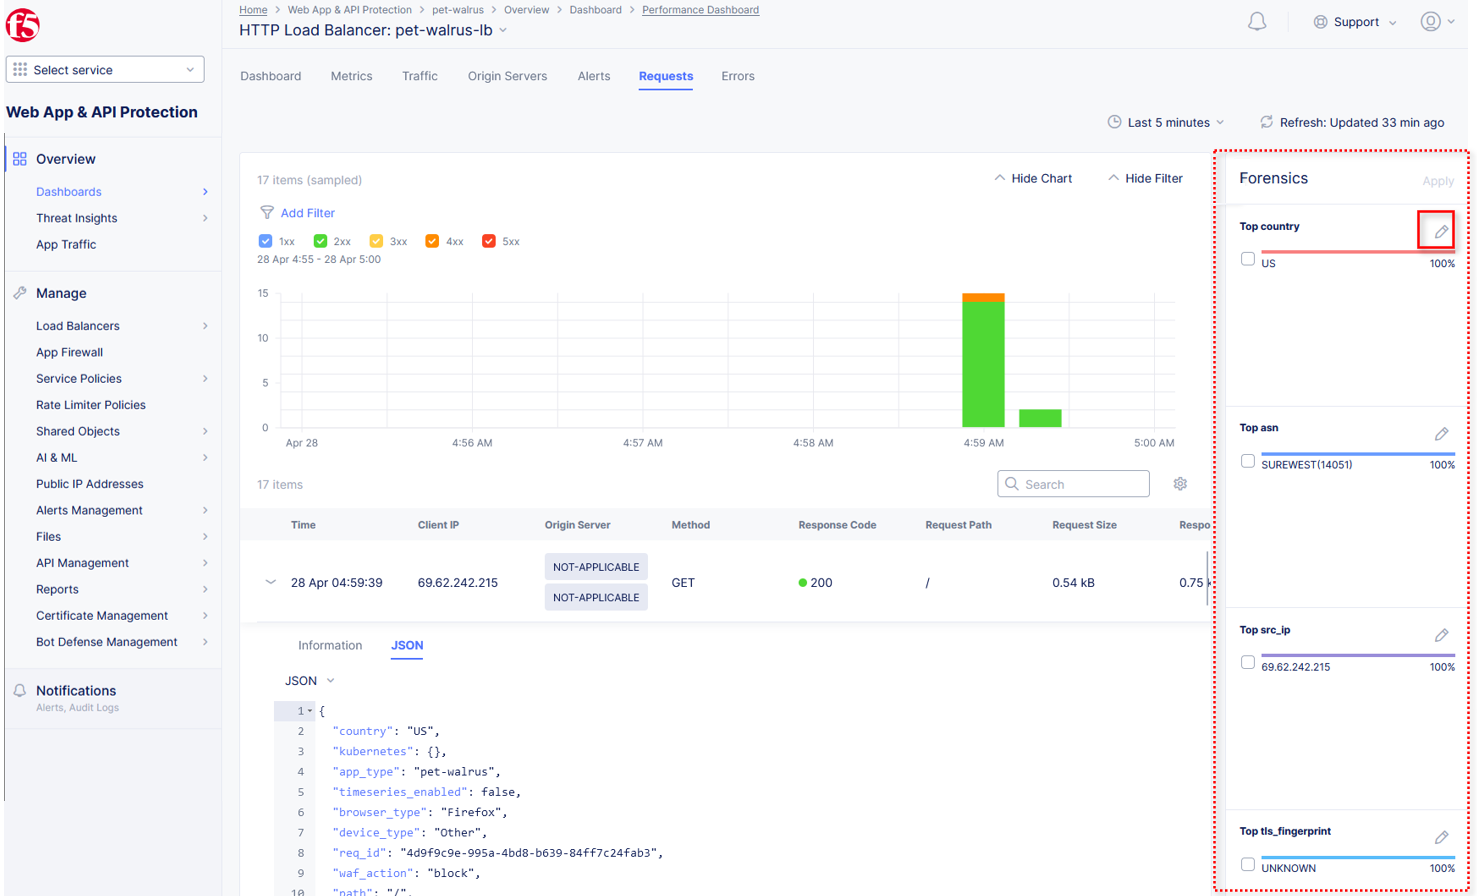
Note
Individual forensic categories can be changed using the noted pencil icon to surface additional top data details.
Using the left-hand navigation, under Overview select Security.
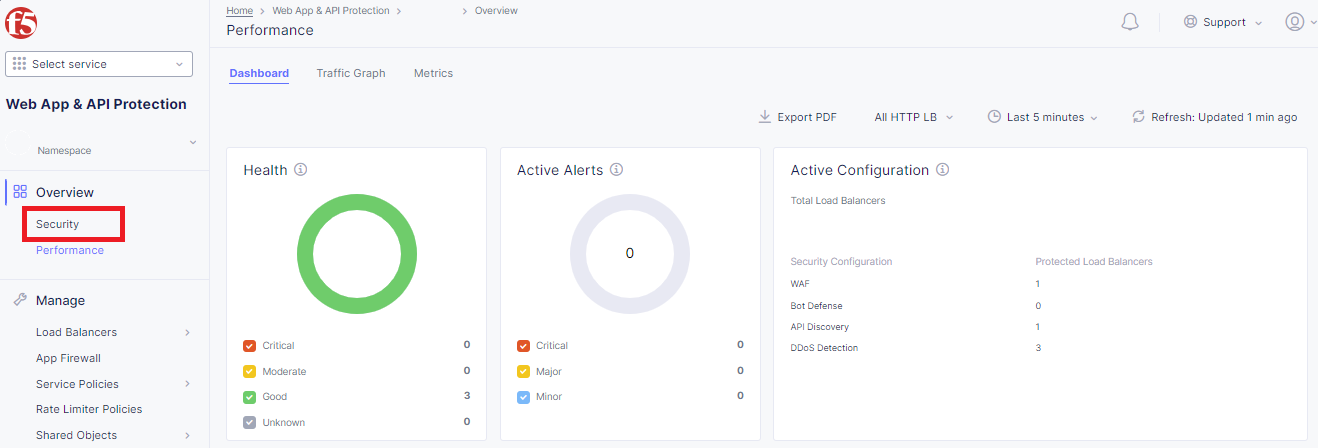
Review the Security Dashboard display (you may have limited data). NOTE: you may need to update the variable time period
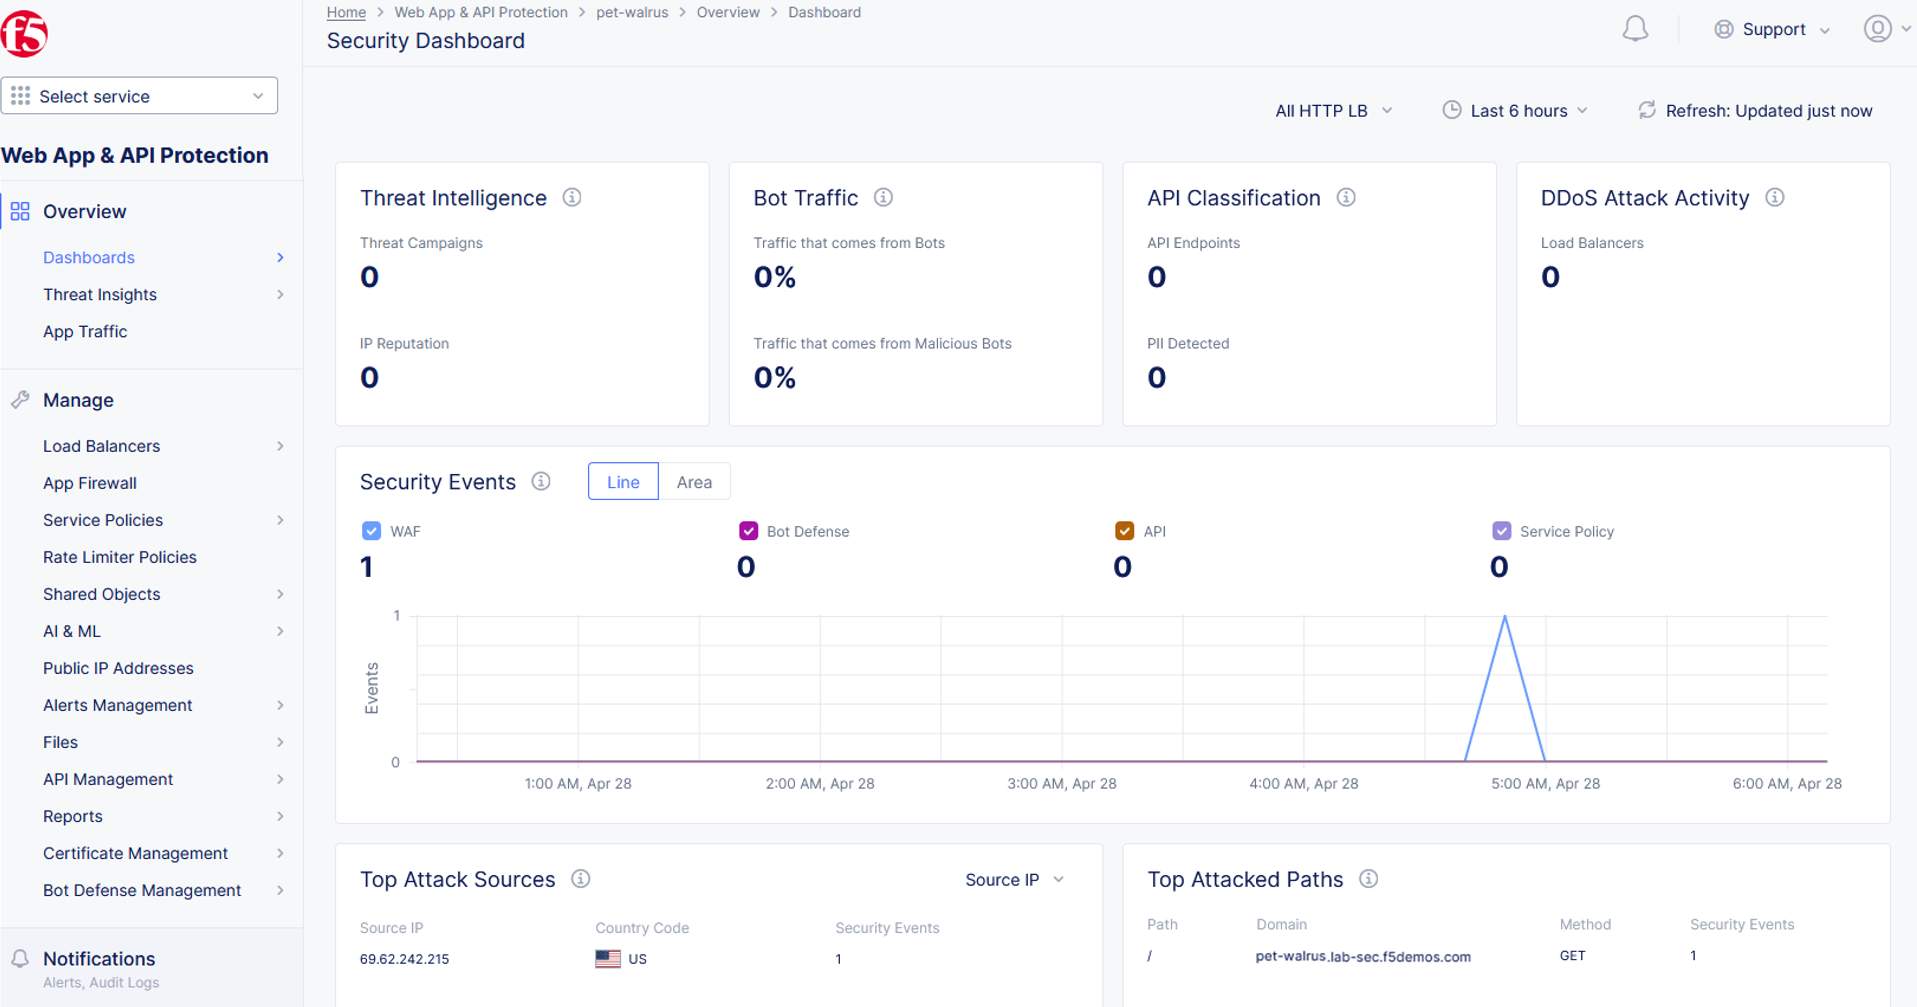
Scroll to Load Balancers section and click the <namespace>-lb object.
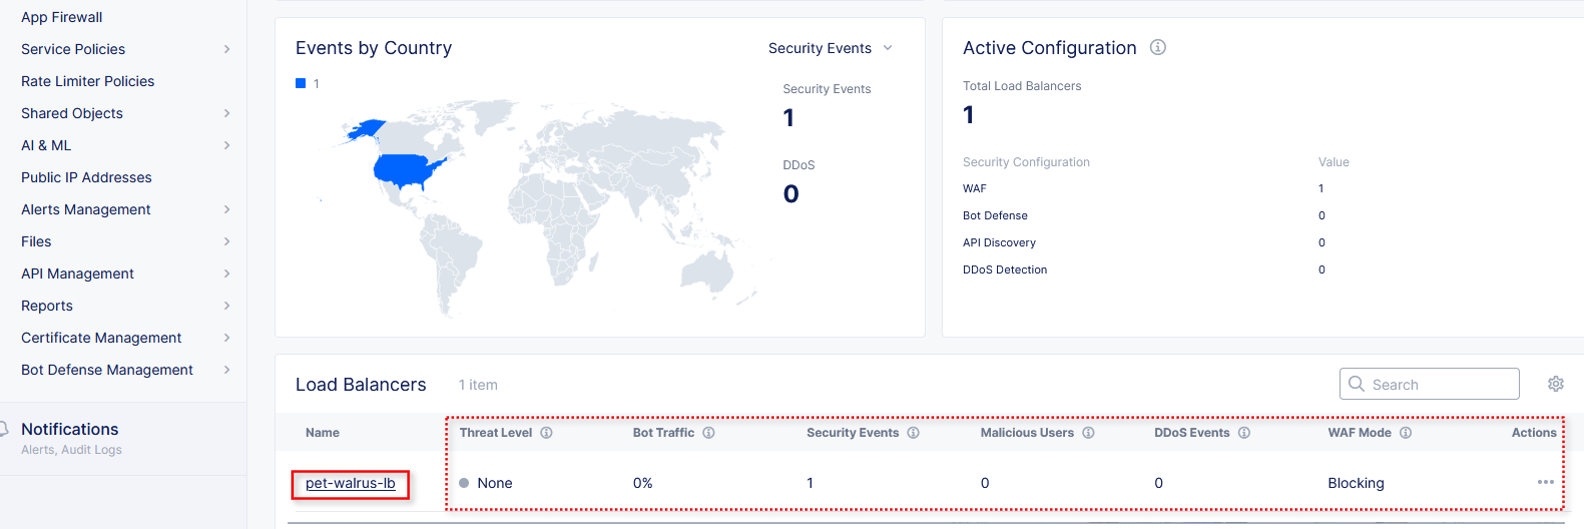
Note
This is a multi-application view. Here you could get the summary security status of each application (iw Threat Level, WAF Mode, etc) and then click into one for more* specific details.
From the Security Dashboard view, using the horizontal navigation, click Security Analytics.
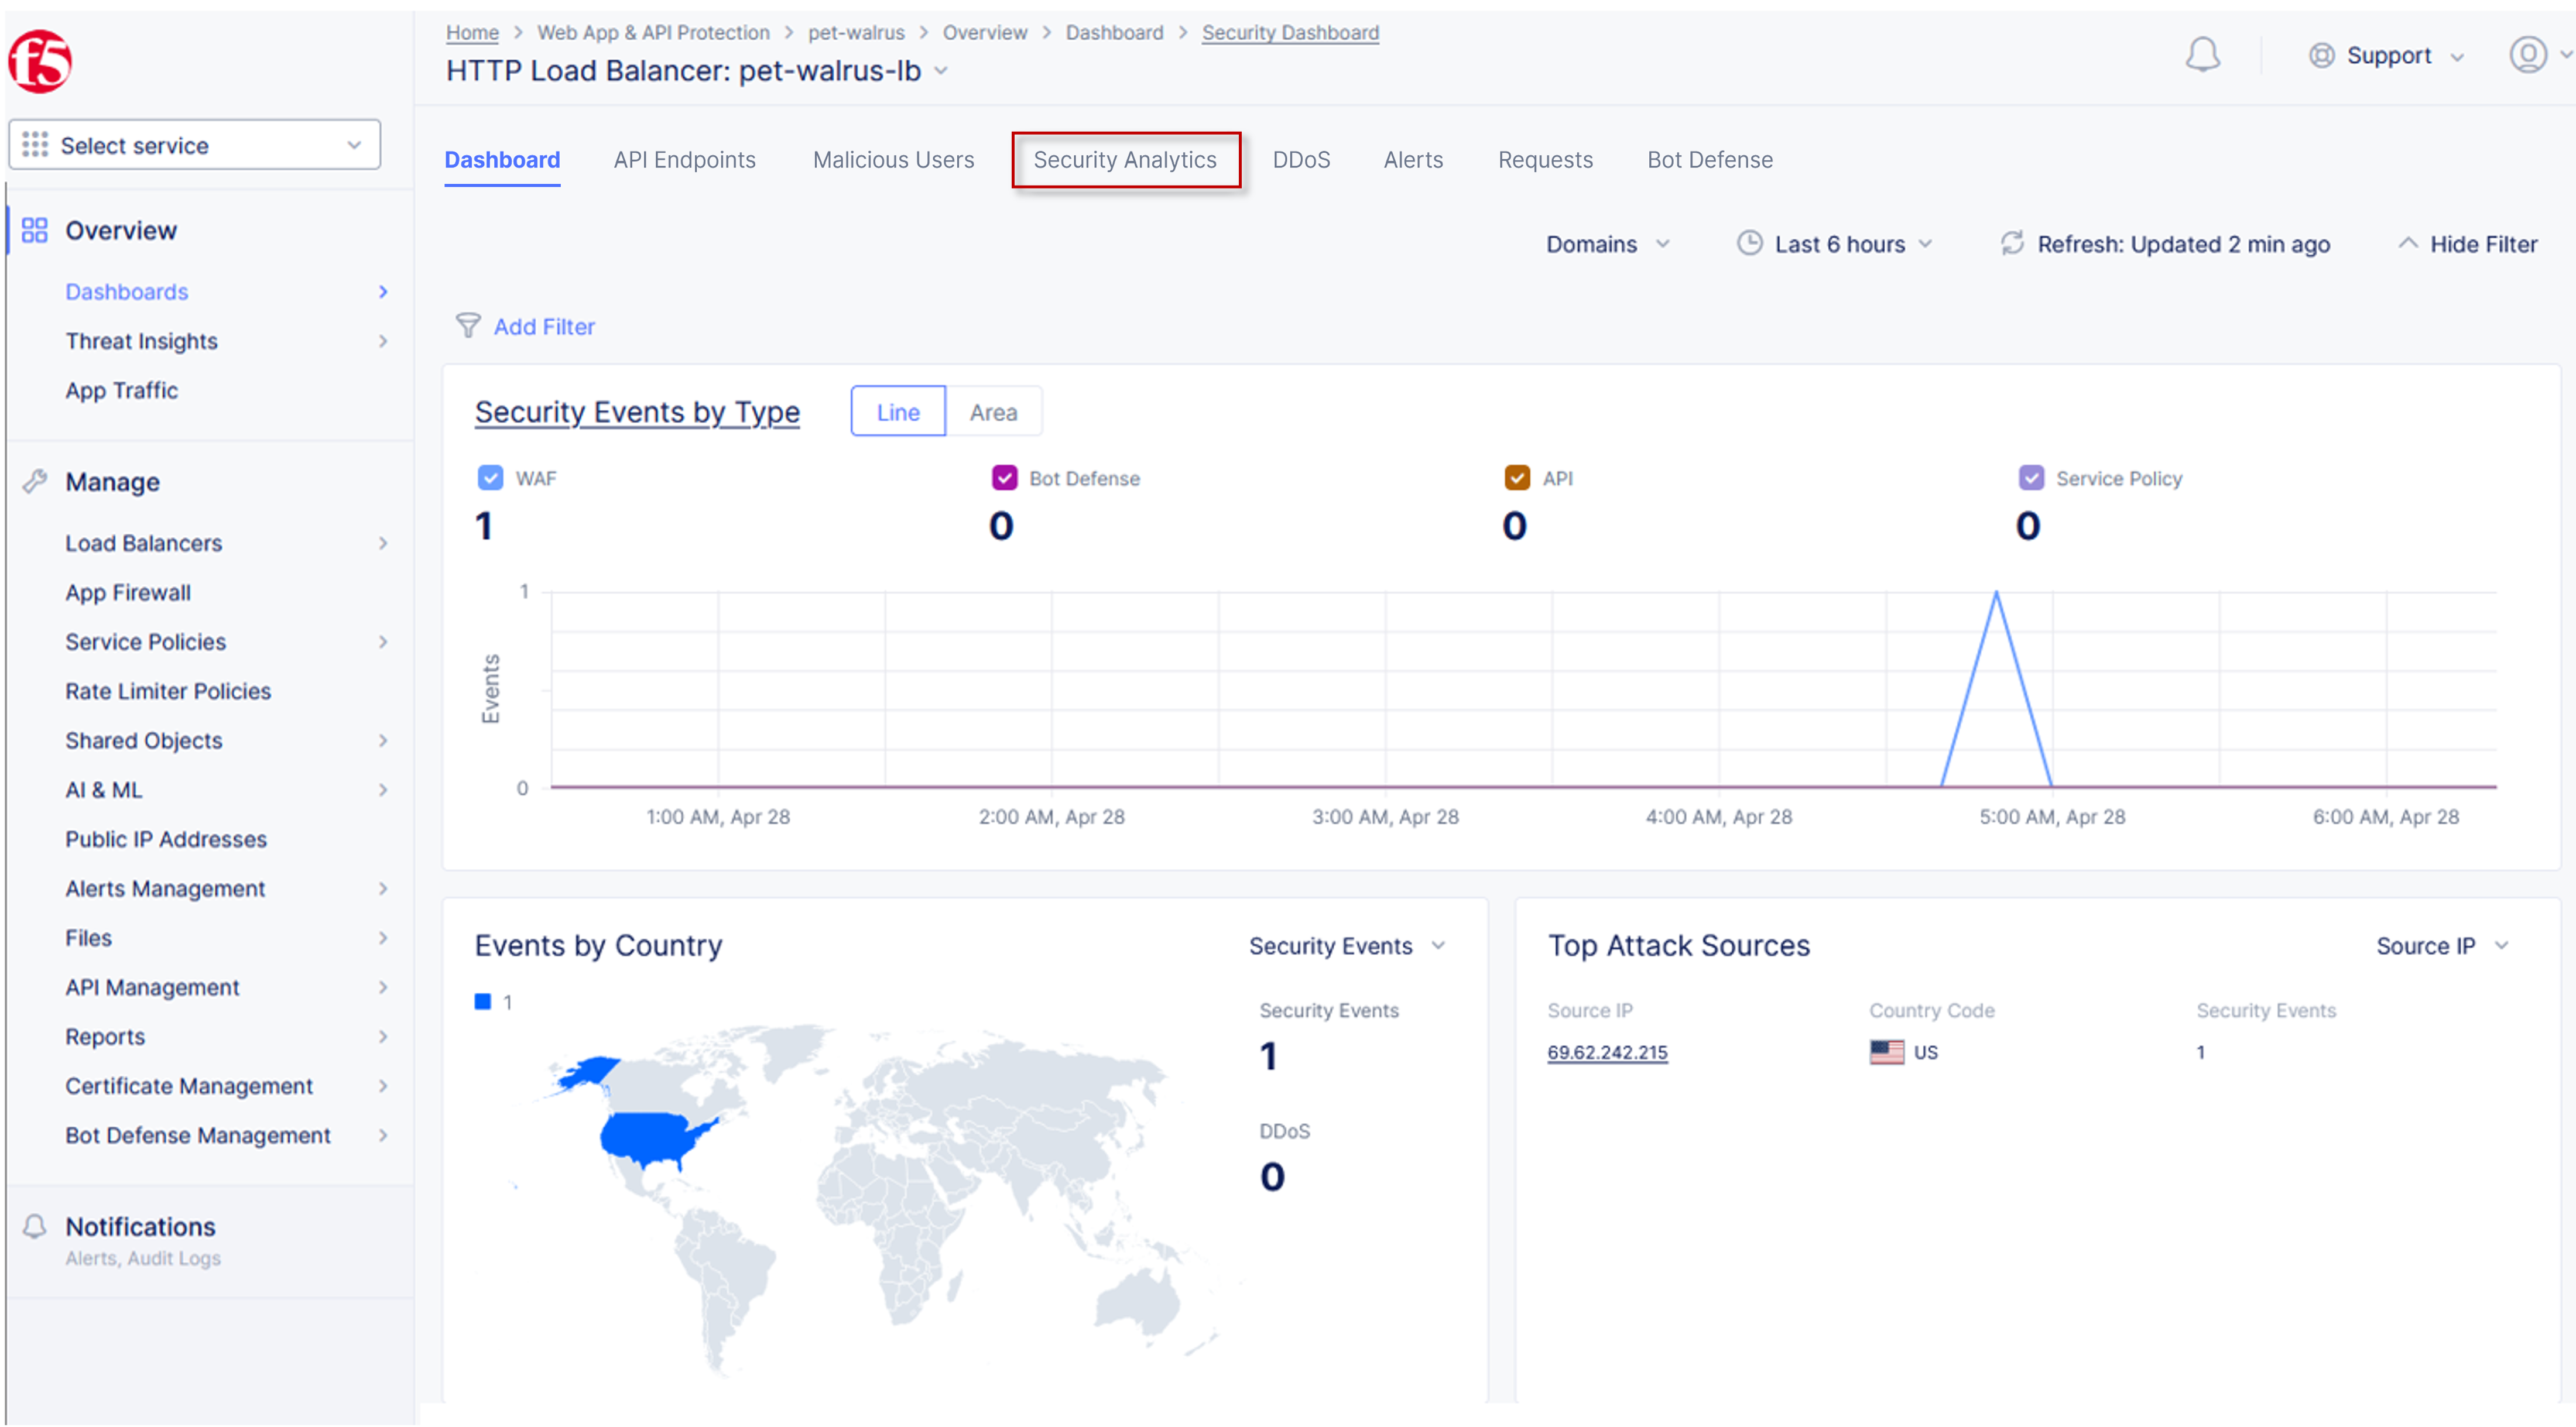
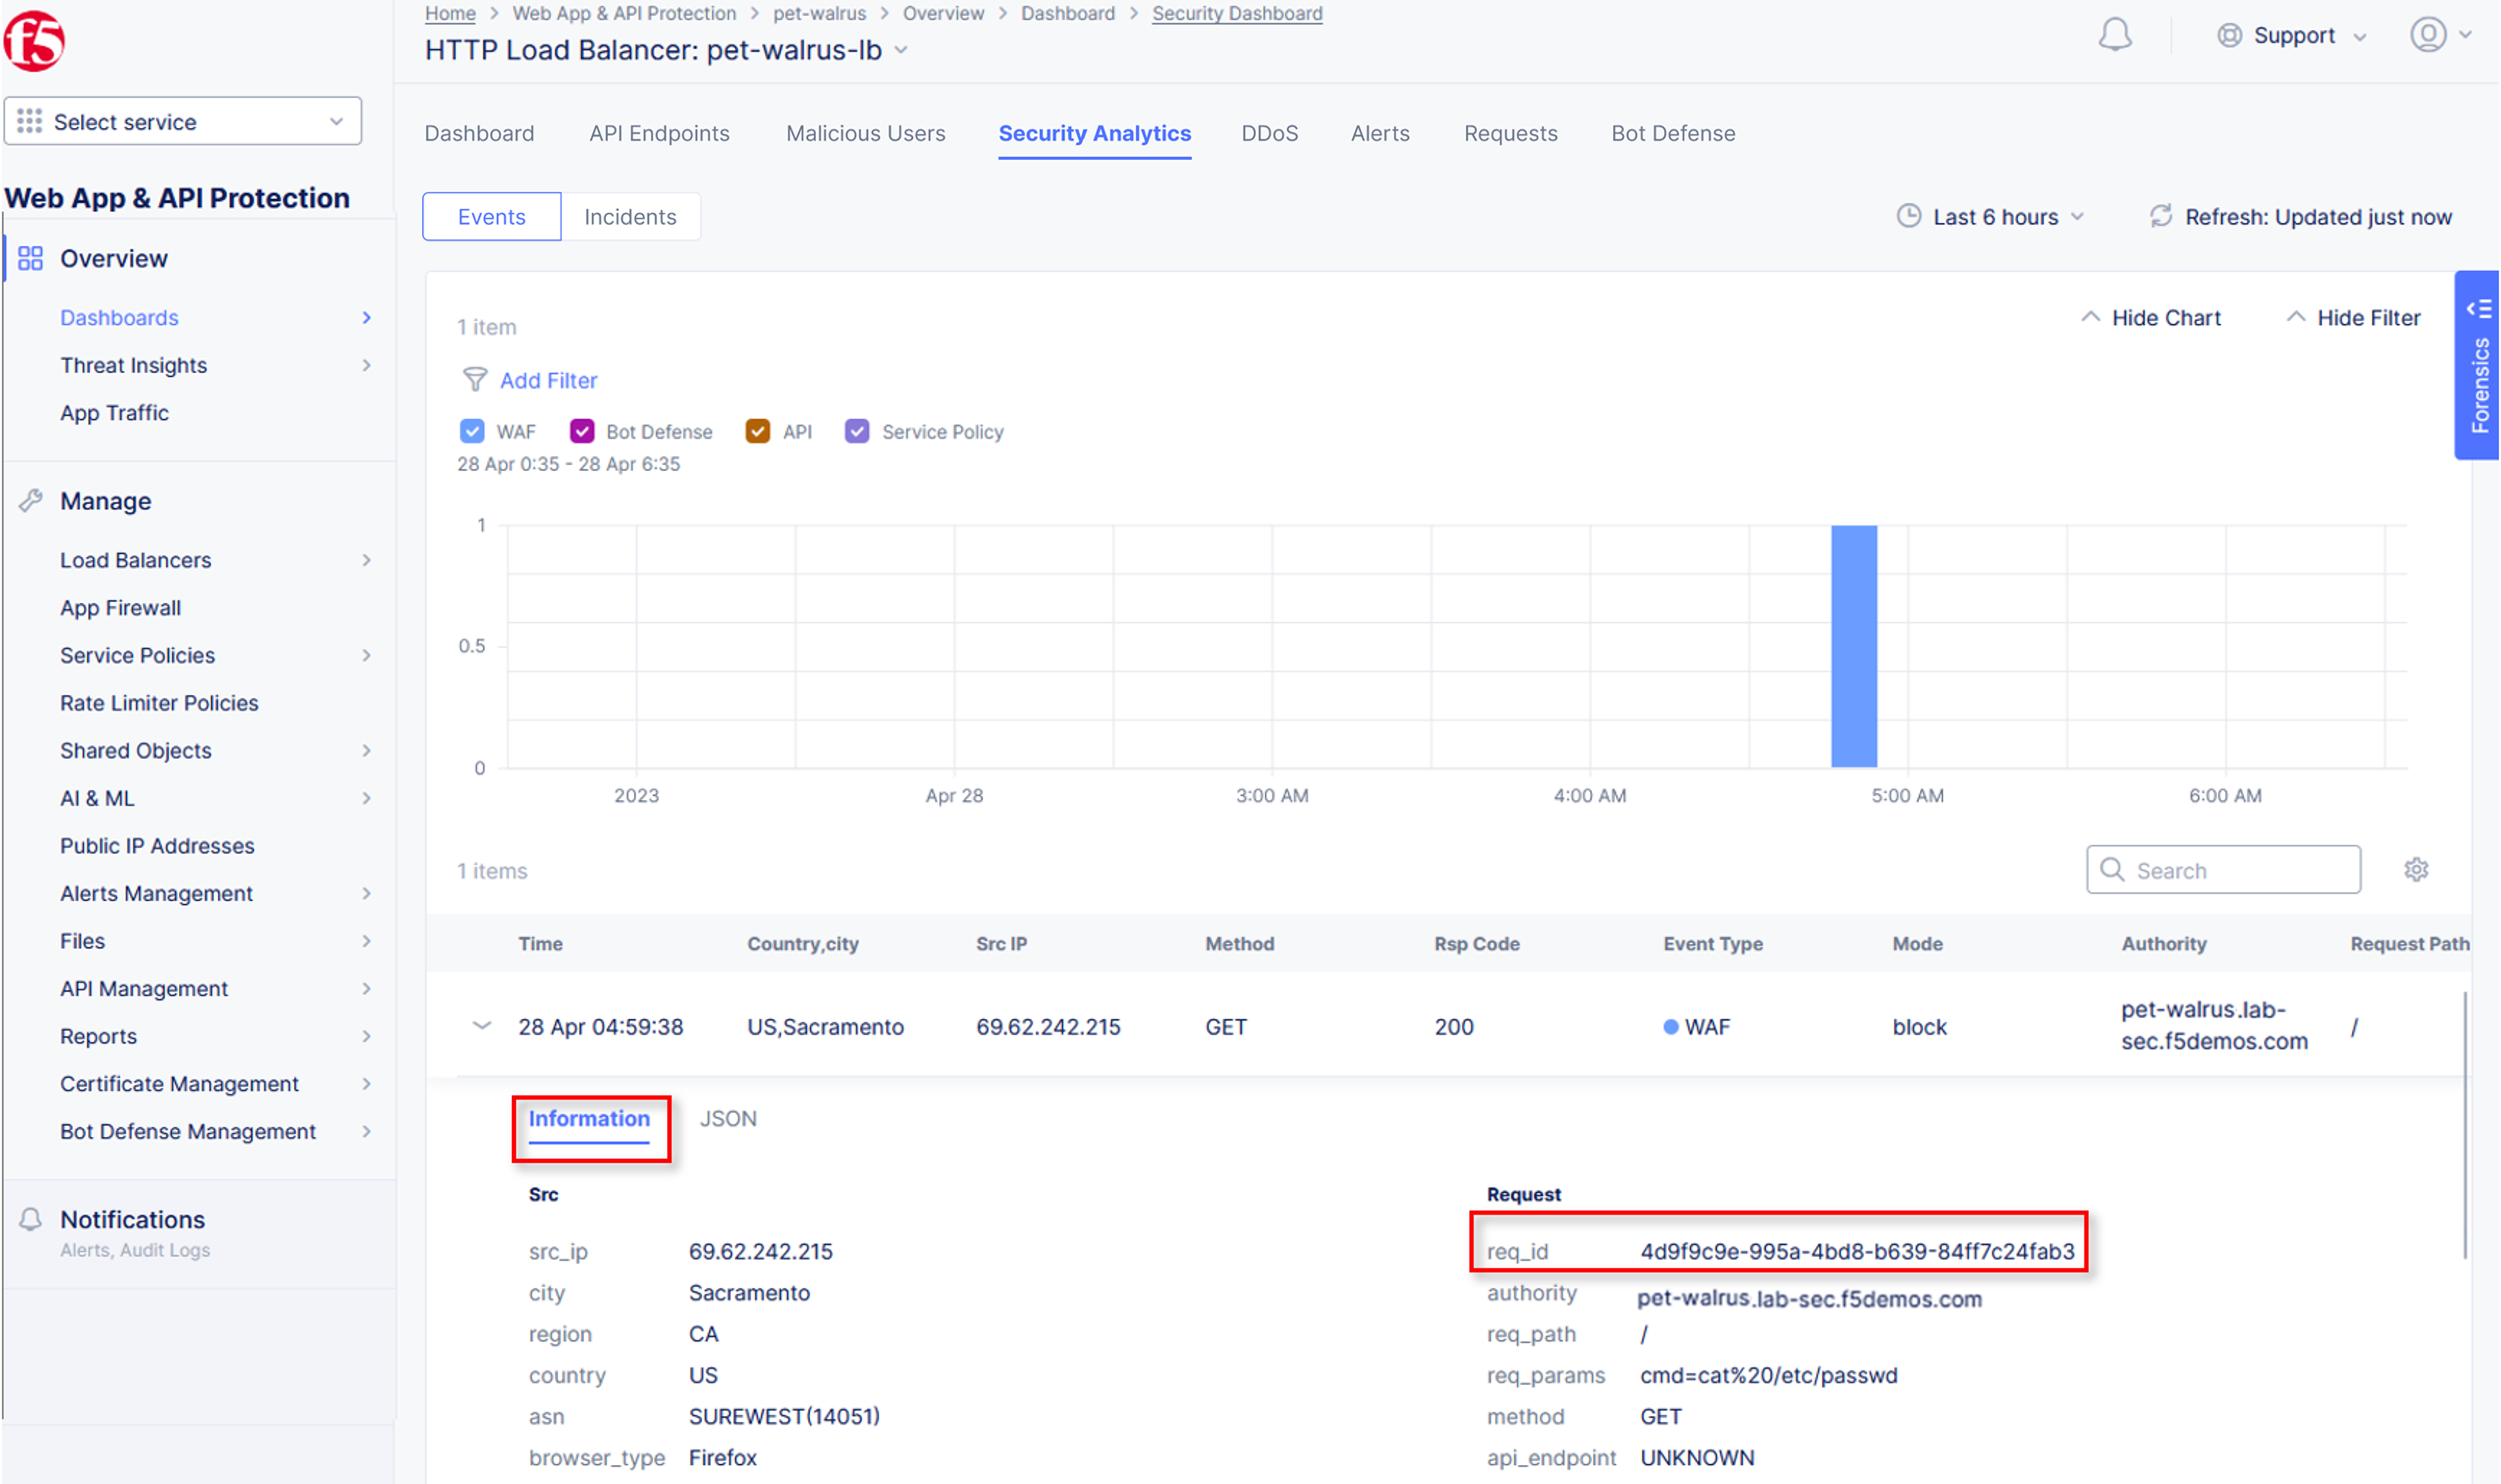
Expand your latest security event as shown.

Note
If you lost your 1 Hour Filter, re-apply using following the method described in the earlier task
Note the summary detail provided Information link and identify the Request ID which is synonymous with Support ID (filterable) from the Security Event Block Page.
Scroll to the bottom of the information screen to see specific signatures detected and actions taken during the security event.
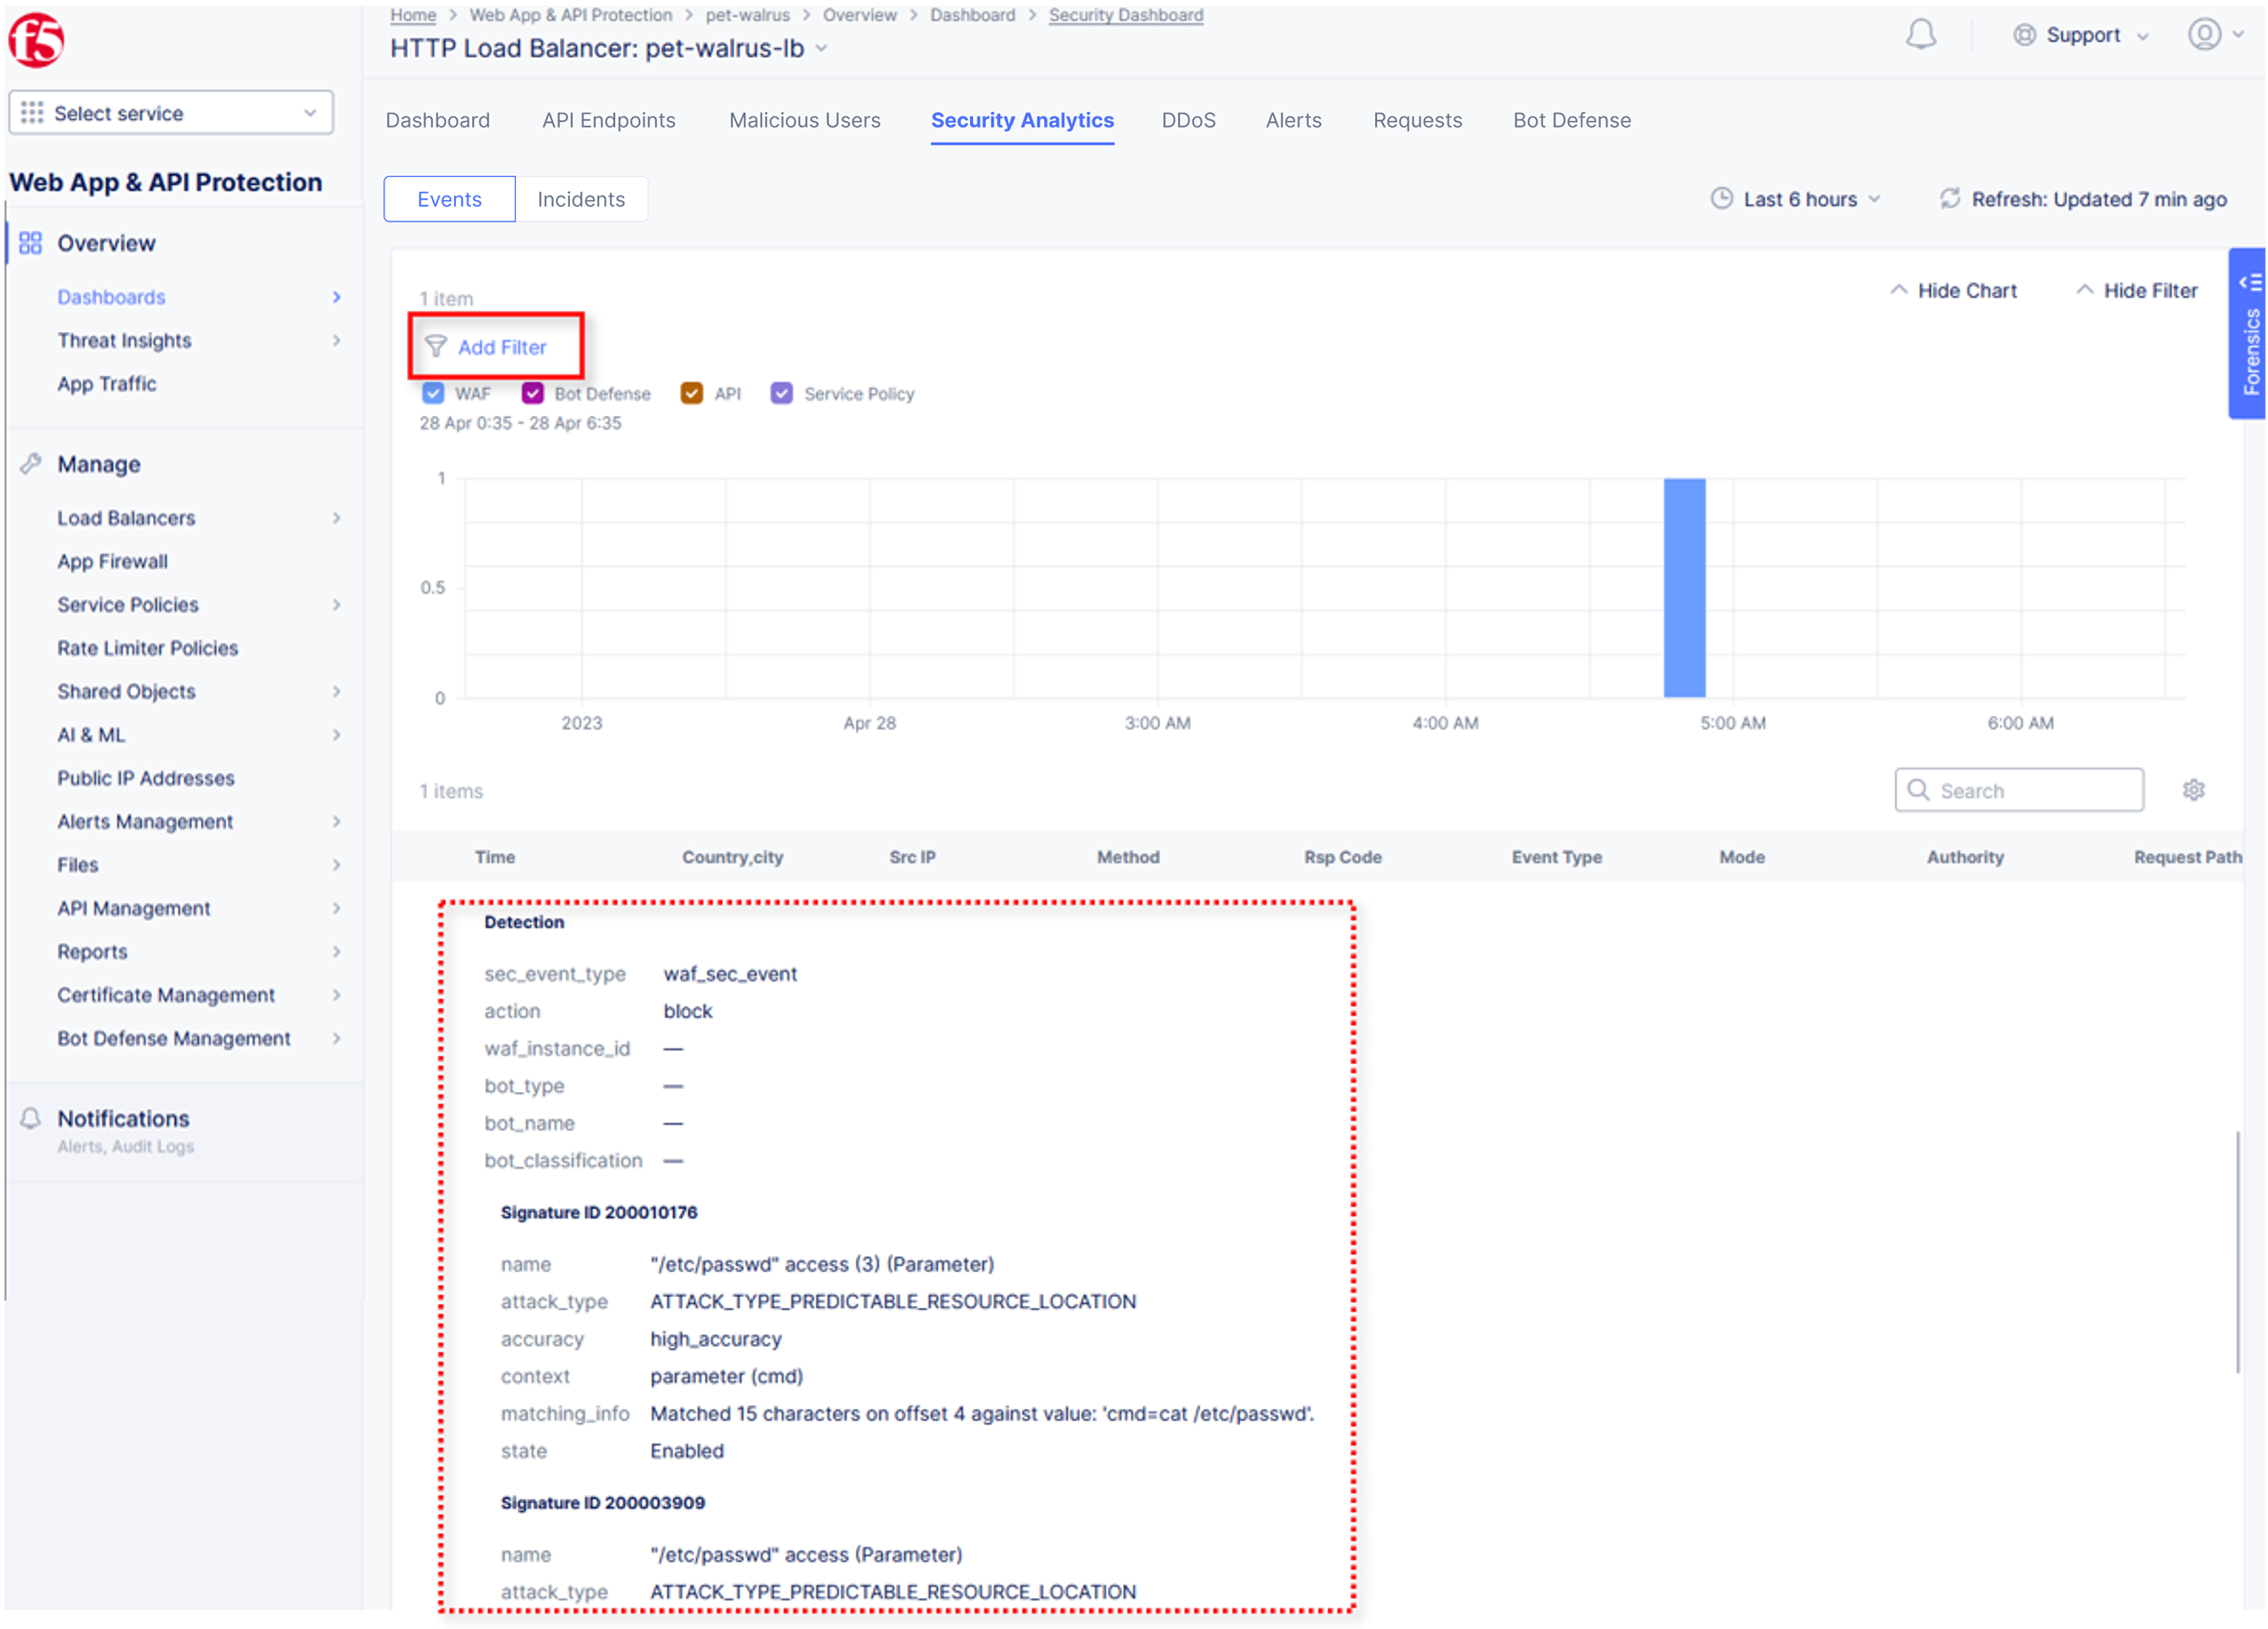
Next, click on the Add Filter link just under the Security Analytics title near the top of the Security Analytics window.
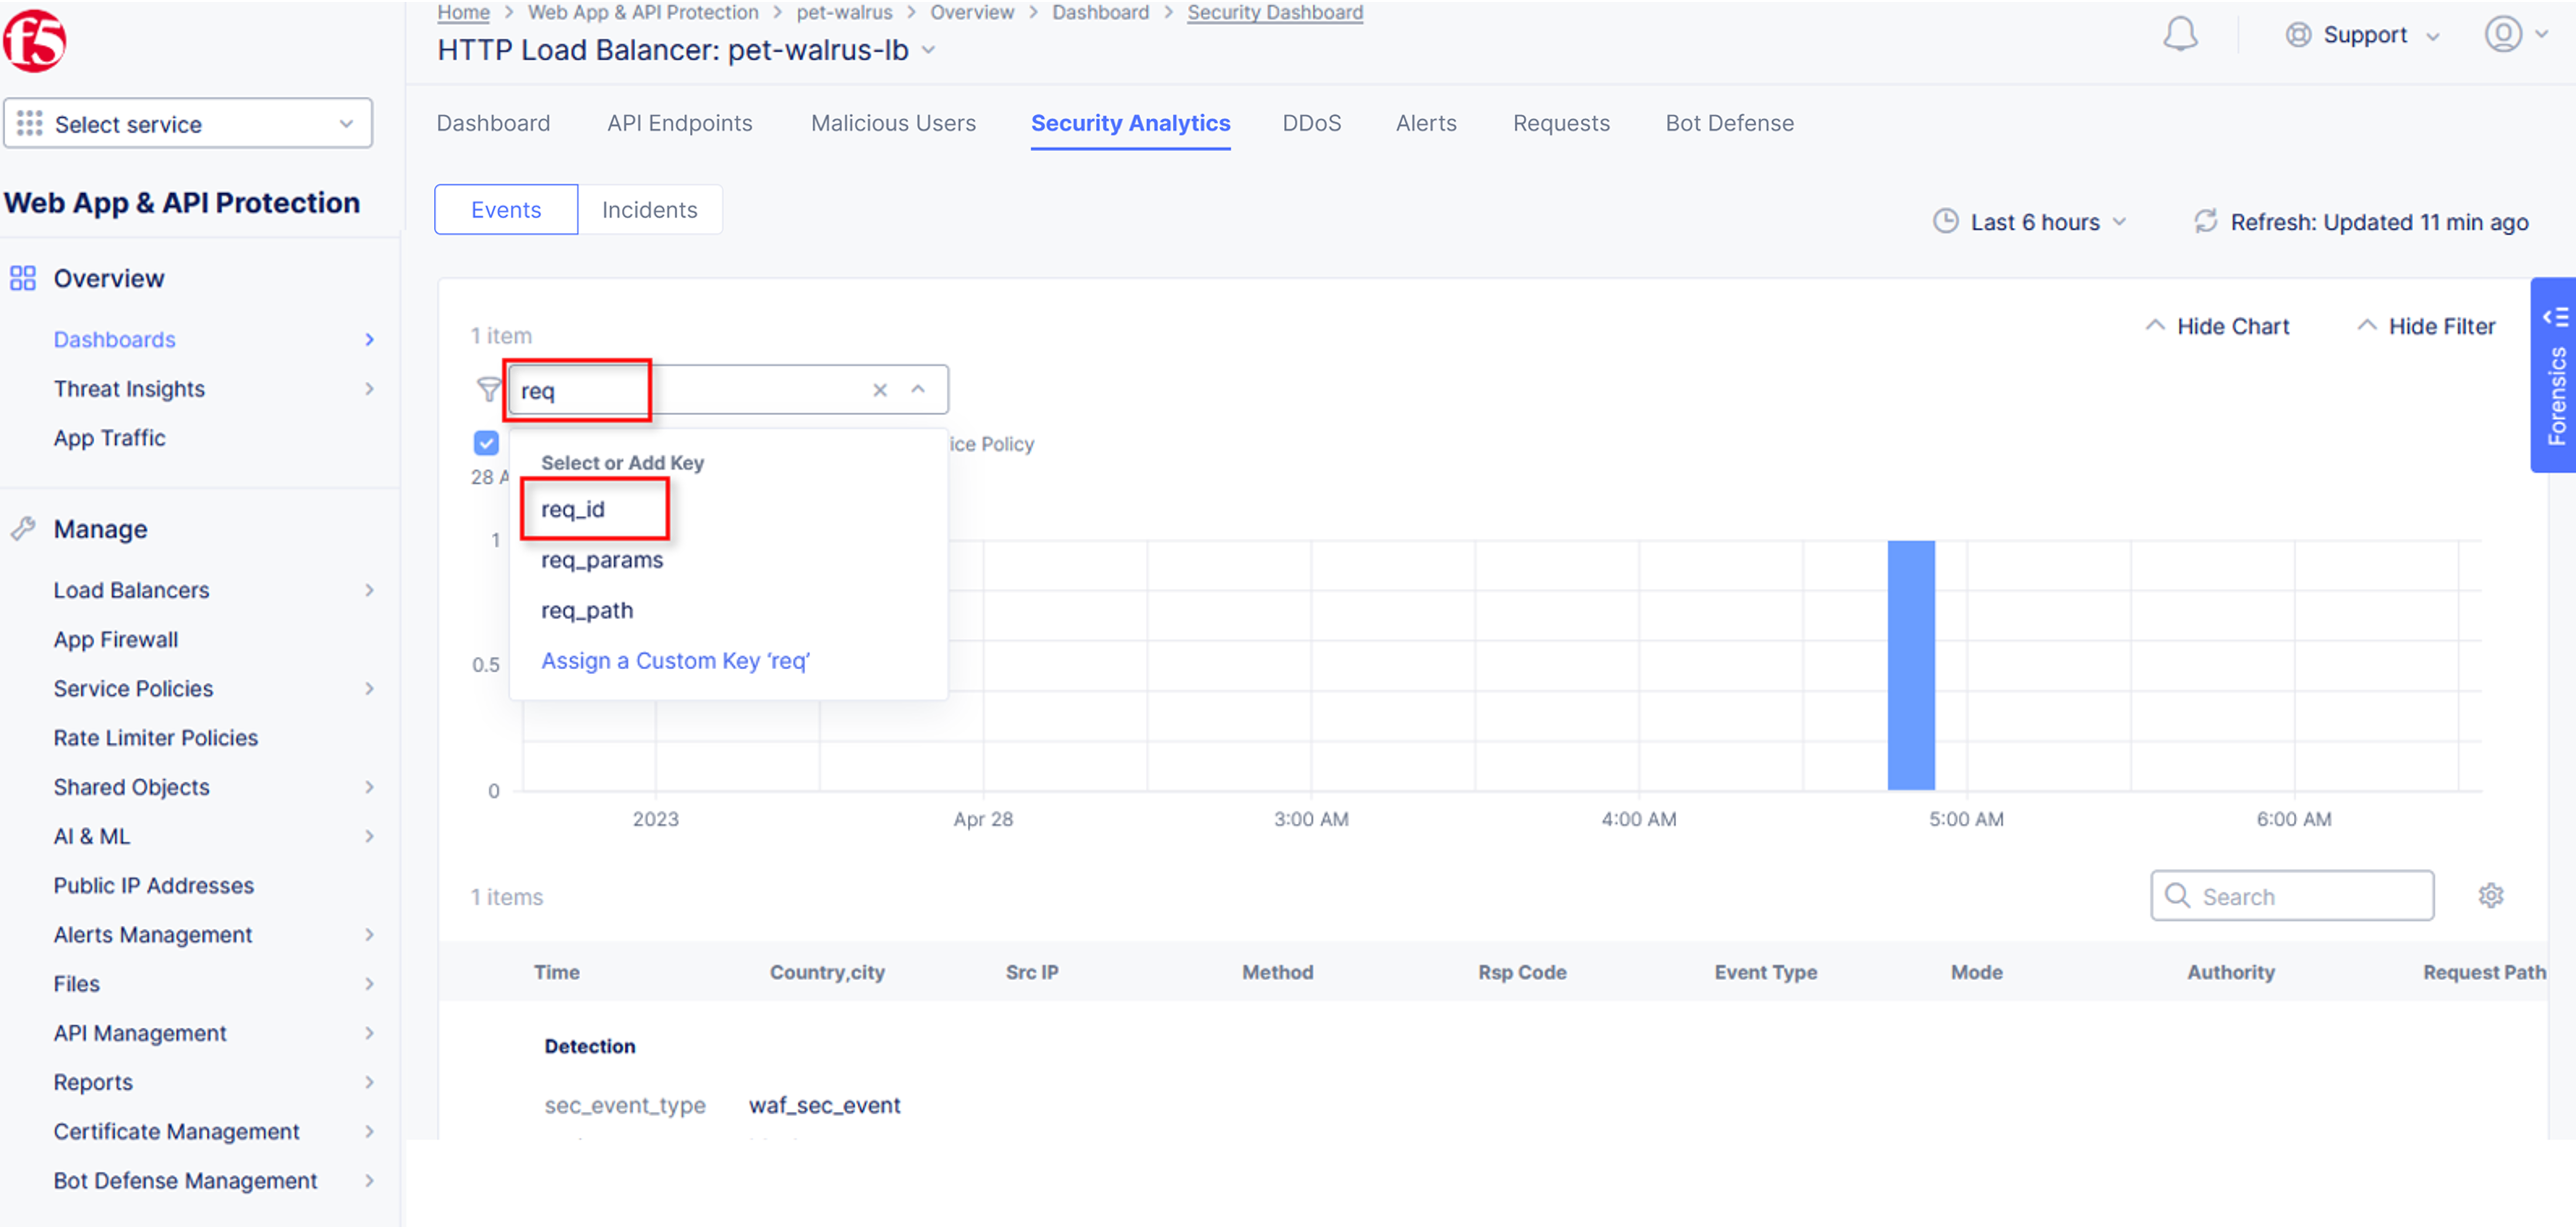
Type req in the open dialogue window and select req_id from the dropdown.


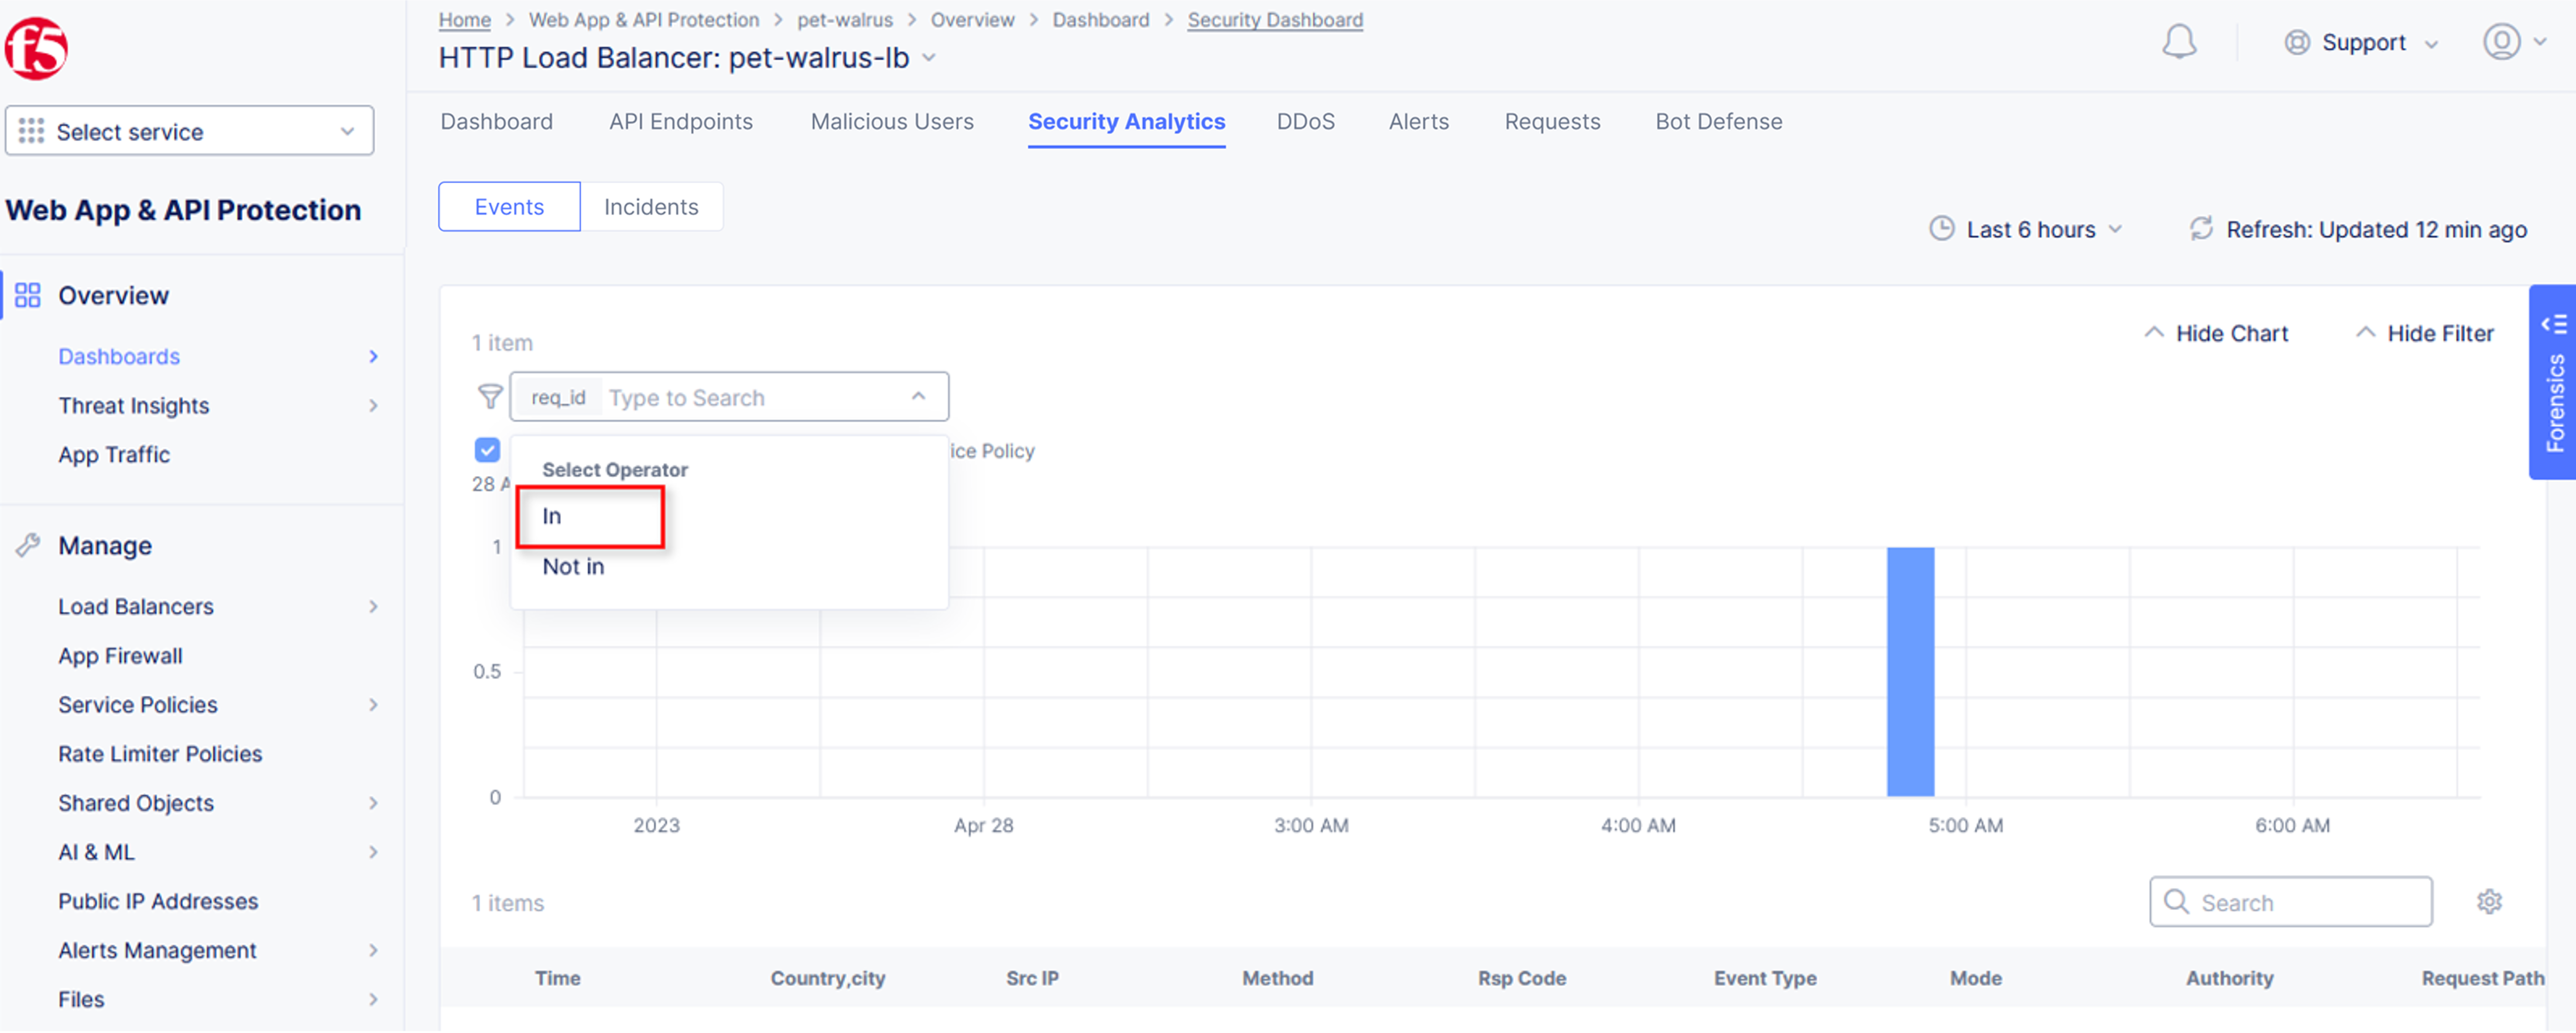
Next, select In from the Select Operator dropdown.
Finally, select/assign a value that matches one of your copied Support IDs from Task 3, Step 3 as shown. You can also optionally just paste the Support ID in the value field and click Apply.
Narrative Check
Upon foresnic review, your application team has told you that last request from Support IDs from the testing performed in Task 3, Step 2 as shown is actually a valid request. You will need to create an exception for this so that traffic can successfully pass. This task can be quickly accomplished in the XC console.
In the XC console, you should now be filtered to a single “Security Event”, as shown with your selected filter. You can expand and review the request as desired using the arrow icon.
Under the Actions column, click on the three Action dots (Scroll to right).
Select Create WAF Exclusion rule from the dropdown that appears.

Note
Adding requestor/client to “Blocked or Trusted Clients” is also available.
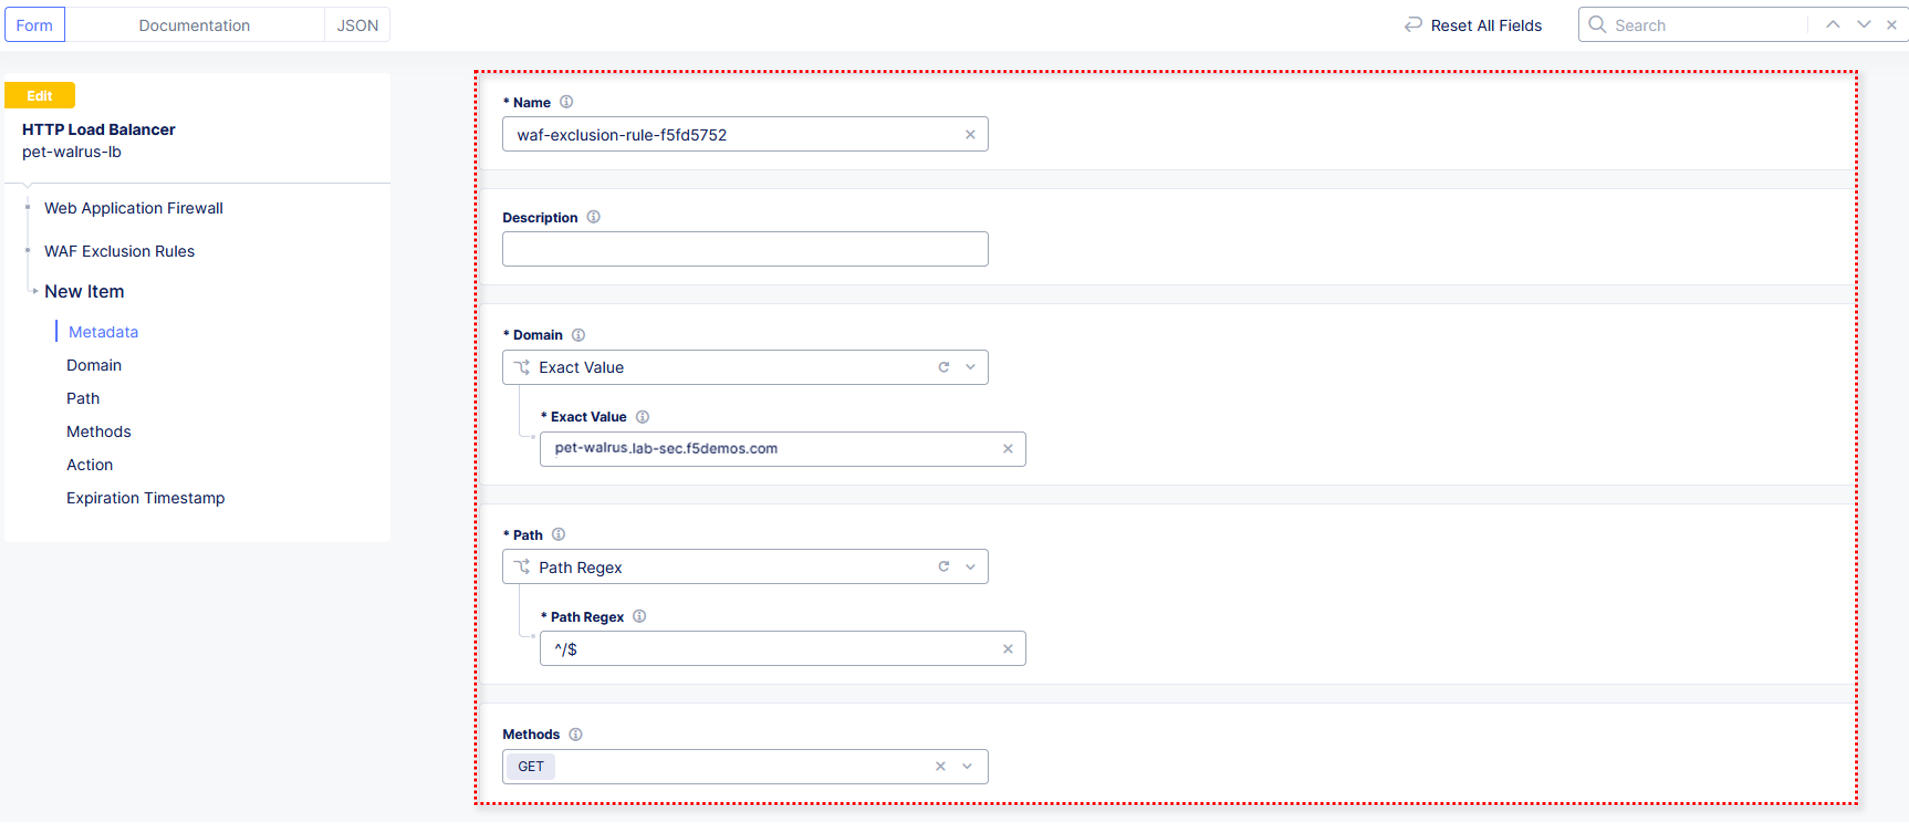
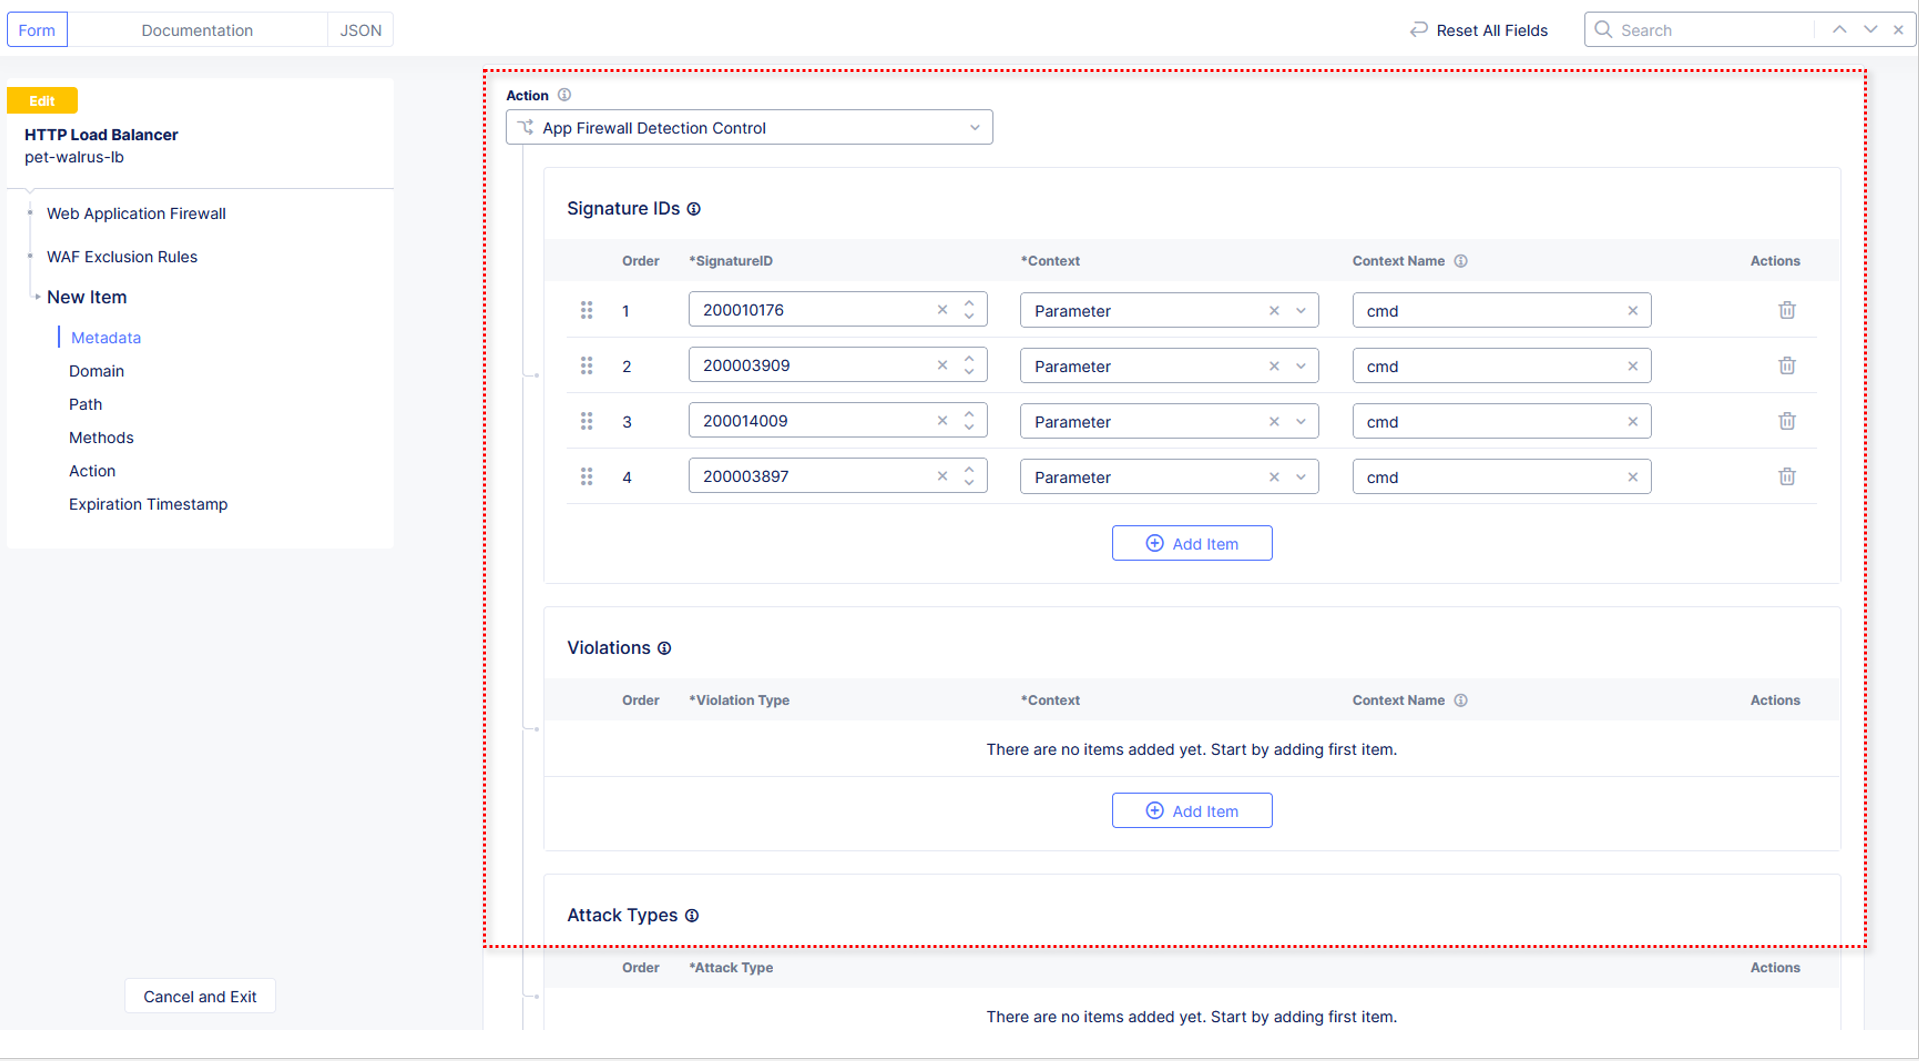
In the subsequent Simple WAF Exclusion Rule window, review the settings (which are editable) by scrolling through the window. The values have been auto-populated based on the selected event to be excluded. Note the various sections and possible controls.
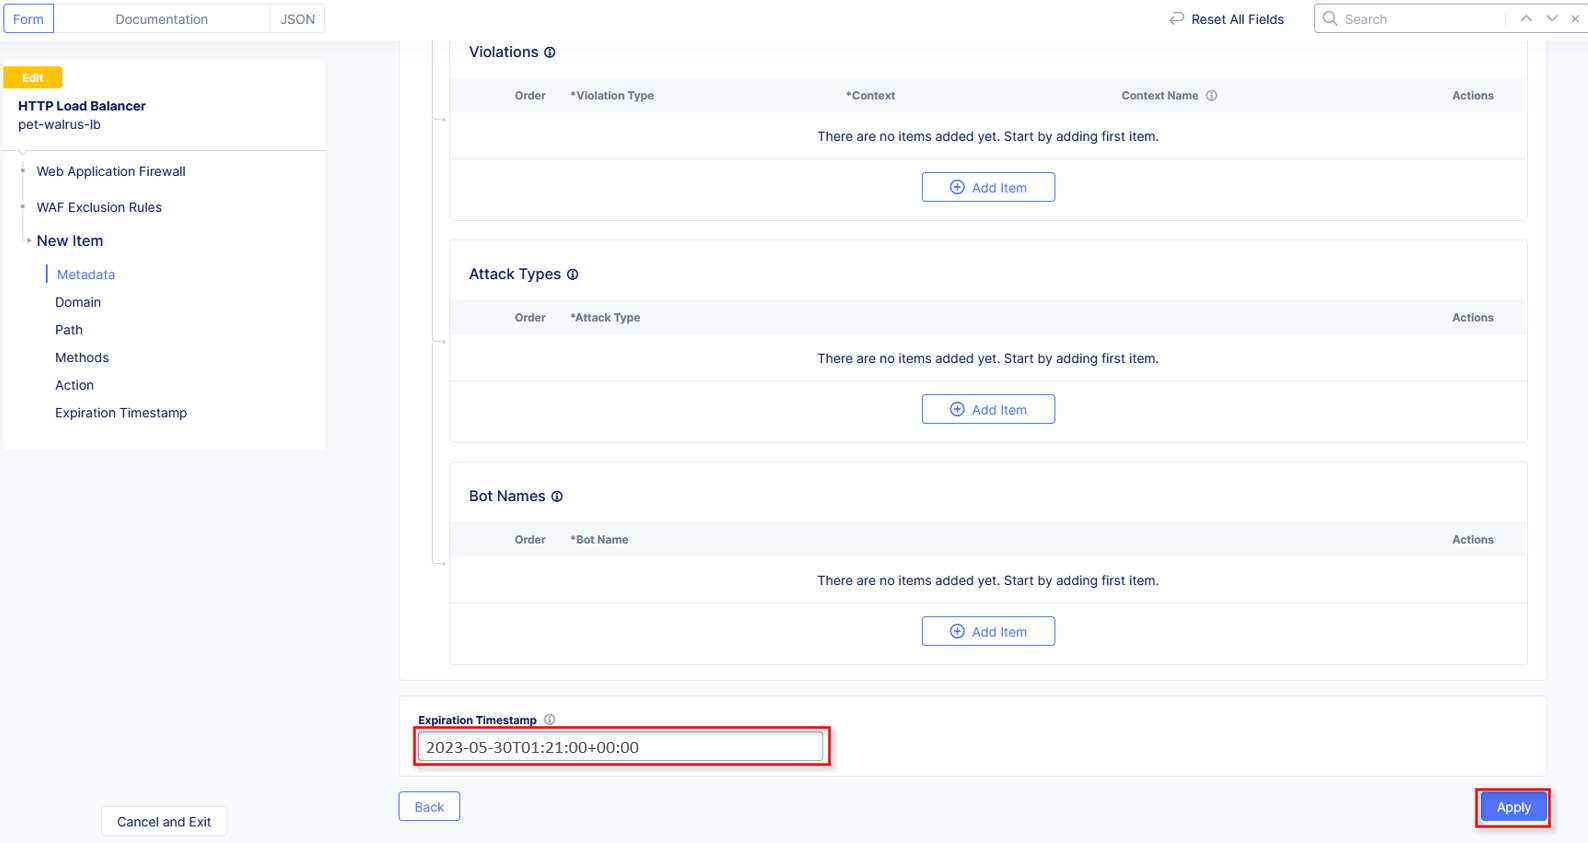
In the Expiration Timestamp field enter a timestamp 10 minutes from now at which the exclusion should expire. (helpful when testing/validating). the format should be as shown YYYY-MM-DD HH:MM:SS+00:00 (2025-02-06T11:21:00+00:00). HH must be in 24 hour format (there is no AM/PM).
Note
Timestamps are in GMT
Click Apply when complete.

Note
If you get an error, you may need to add a Path RegEx ^/$
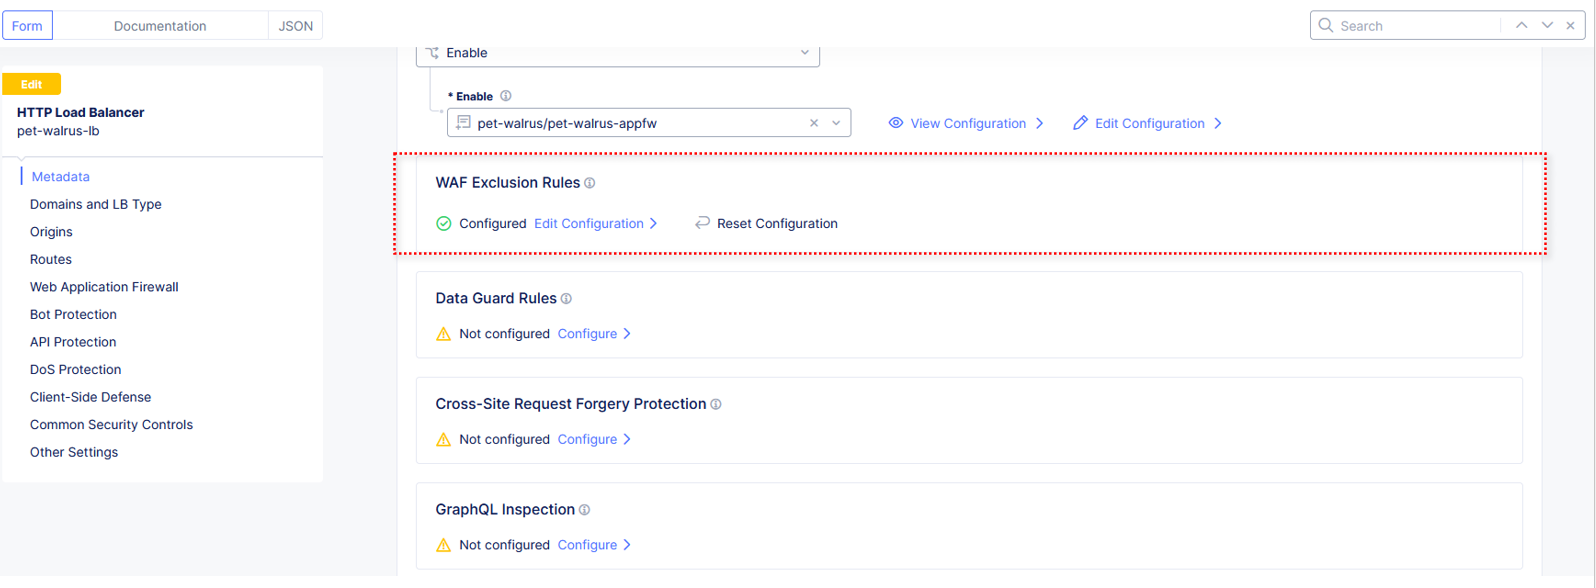
Click Apply on the WAF Exclusion Rules summary screen.
Scroll in the HTTP Load Balancer Configuration and note the added WAF Exclusion Rules configuration.
Scroll to the bottom of the HTTP Load Balancer configuration window and click the Save and Exit button.
Note
Rerunning the attack you just excluded, you will see that it is no longer blocked.

Task 4: Understanding Exclusions and Customizing WAF Policy
In this task you will come to understand how exclusions are applied. You will also further customize the WAF policy just built to add a custom block response page.
In the HTTP Load Balancers window (Manage > Load Balancers > HTTP Load Balancers) Click on the three action dots in the Actions column then Manage Configuration from the dropdown menu.
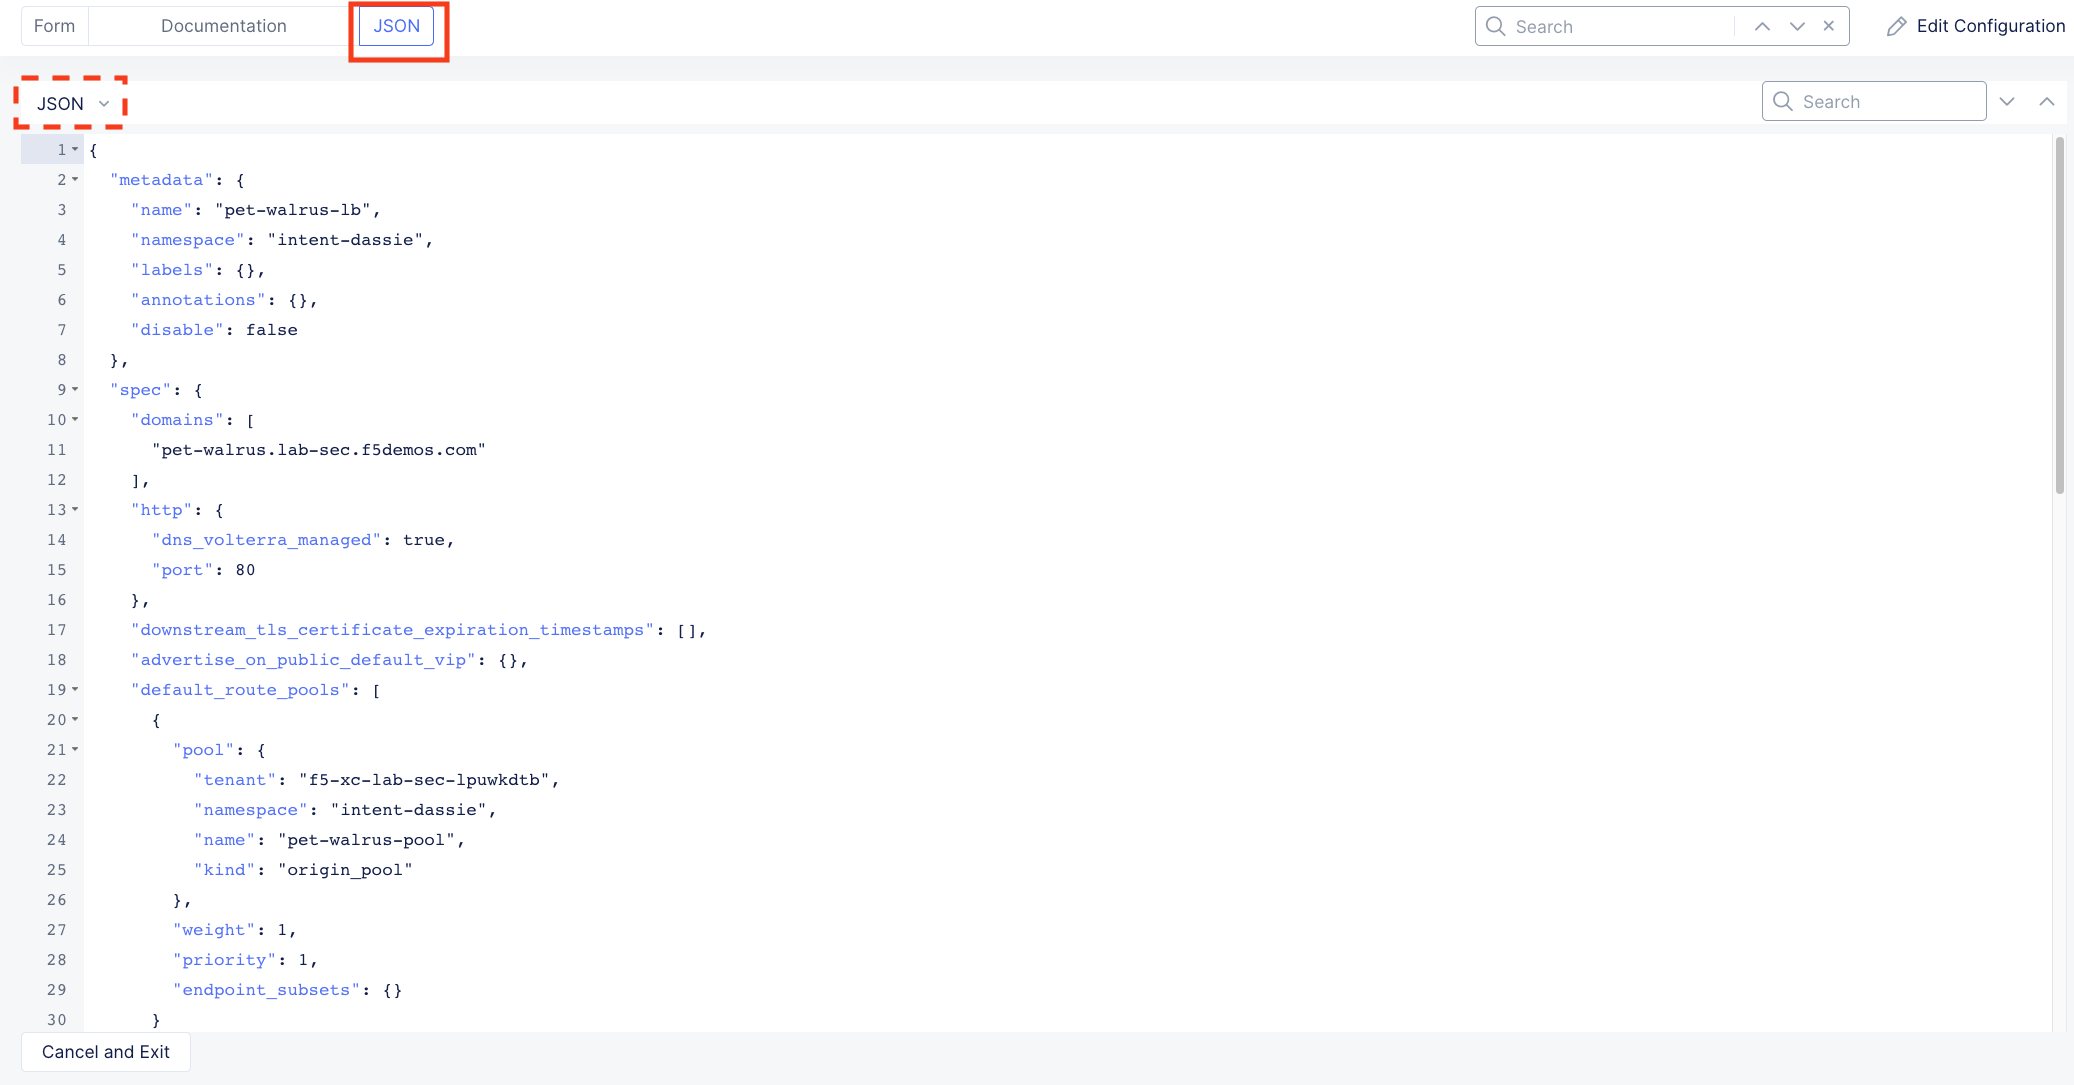
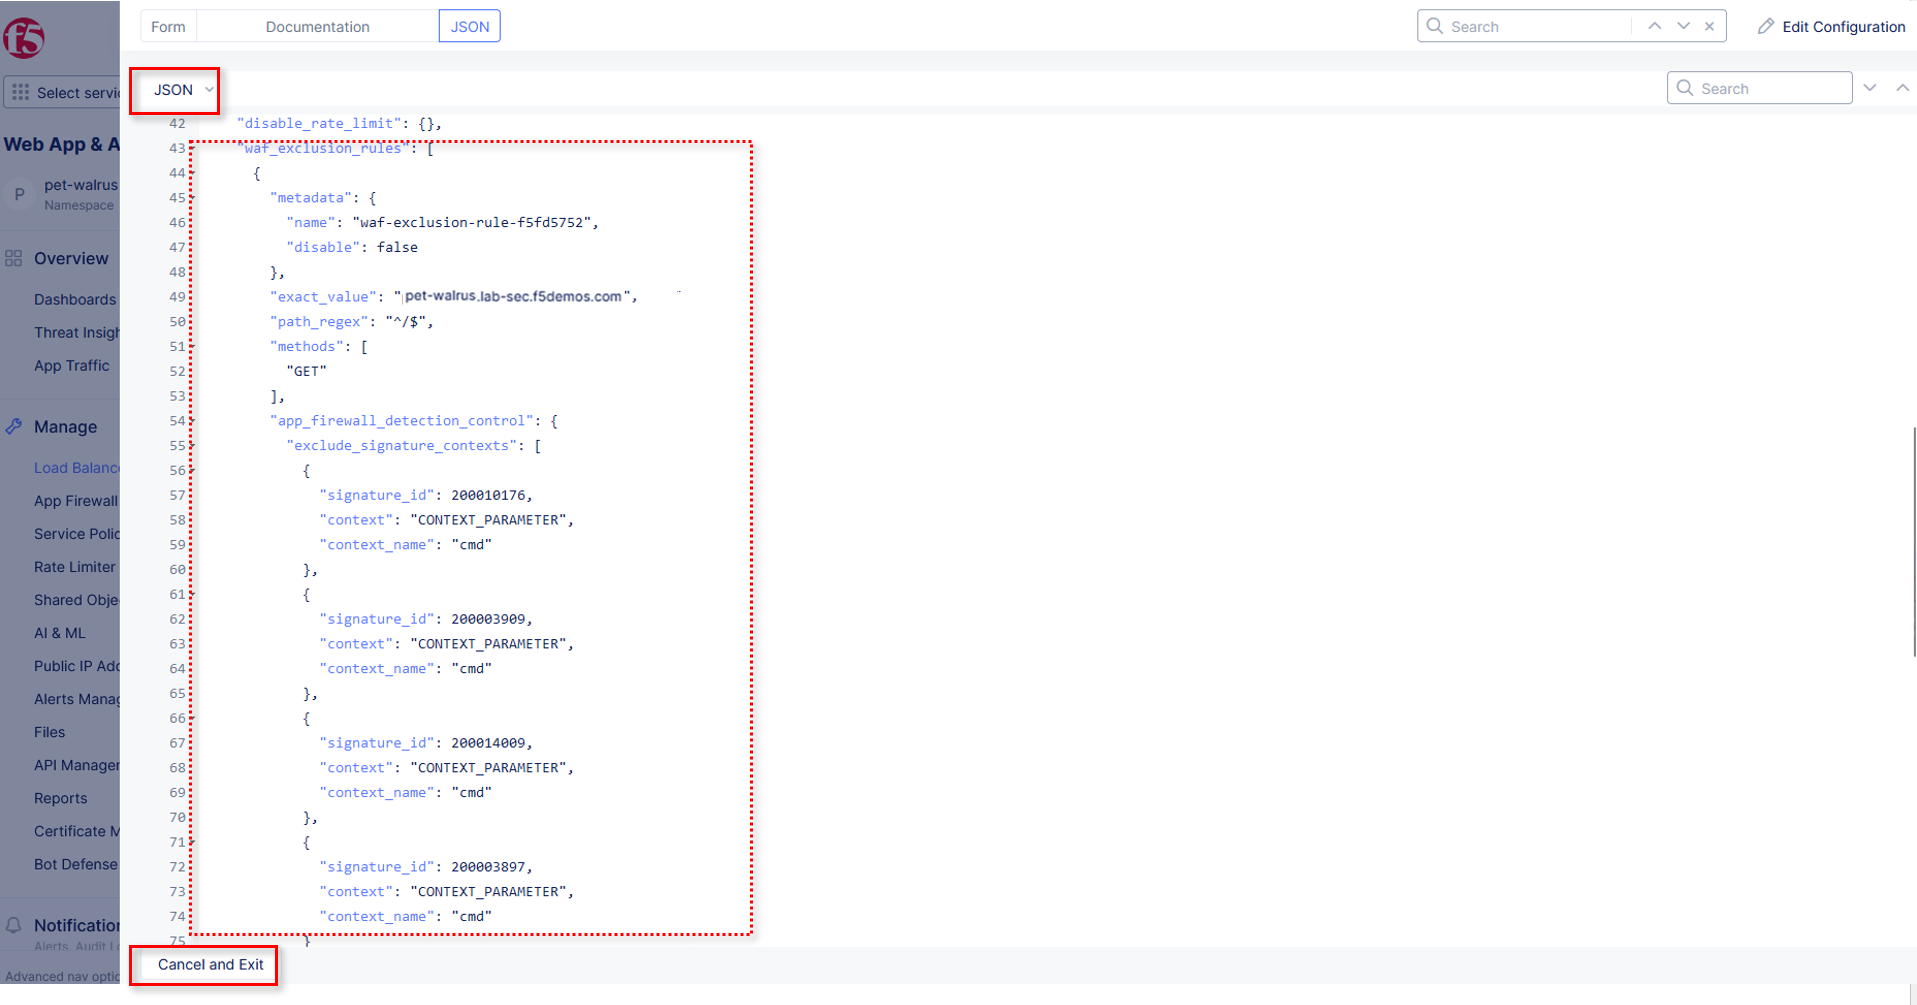
Click on the JSON tab in the horizontal navigation as shown and scroll to find the waf_exclusion_rule section. Observe that the exclusion rule is associated with the Load Balancer configuration and not the WAF Policy.
Note
This allows for policy reuse and reduces the need for specific application WAF Policies.
Click on the Cancel and Exit to return to the prior window.
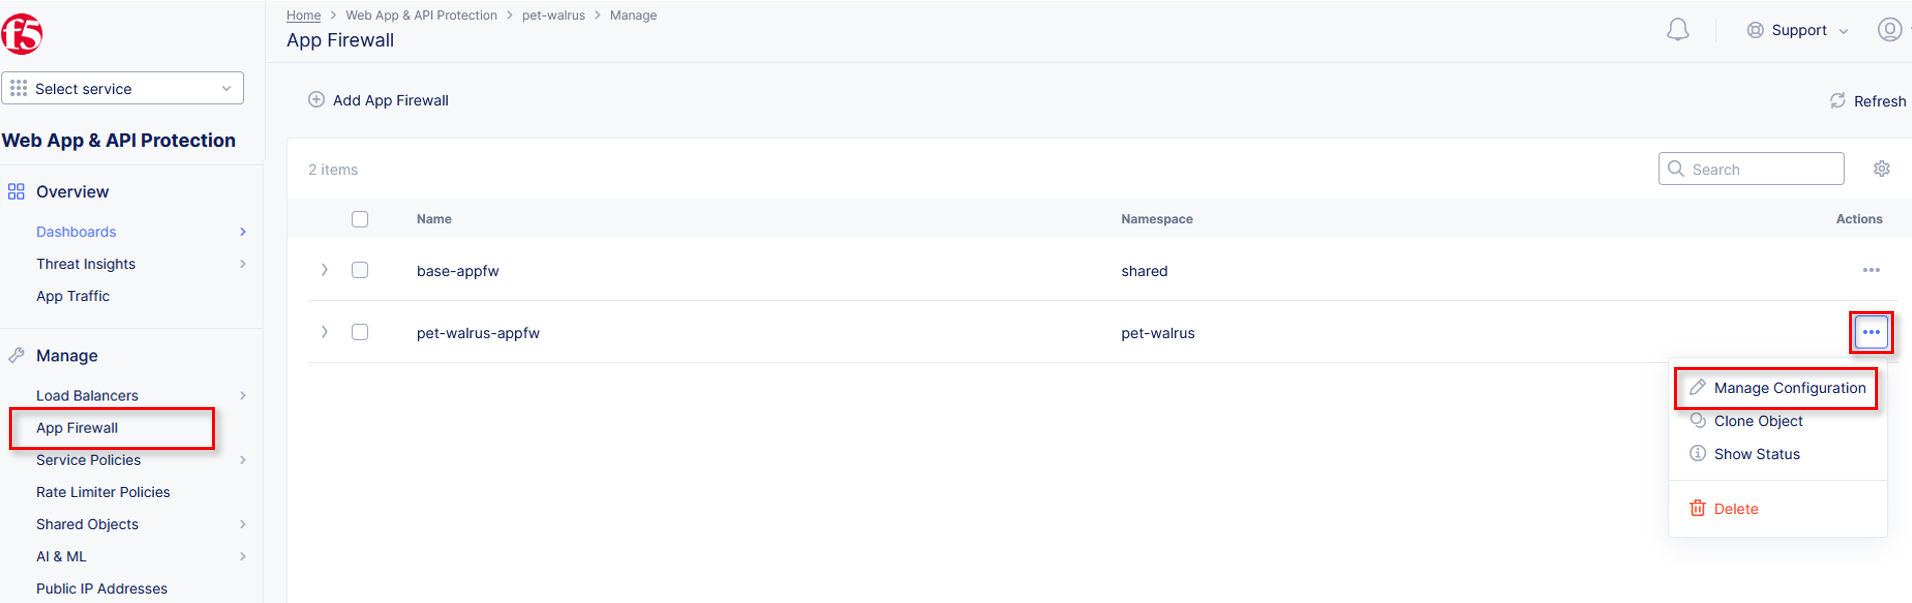
In the left-hand navigation menu, navigate to Manage section and click the App Firewall link.
On your App Firewall policy <namespace>-appfw, click the three dots in the Actions column and then click Manage Configuration.
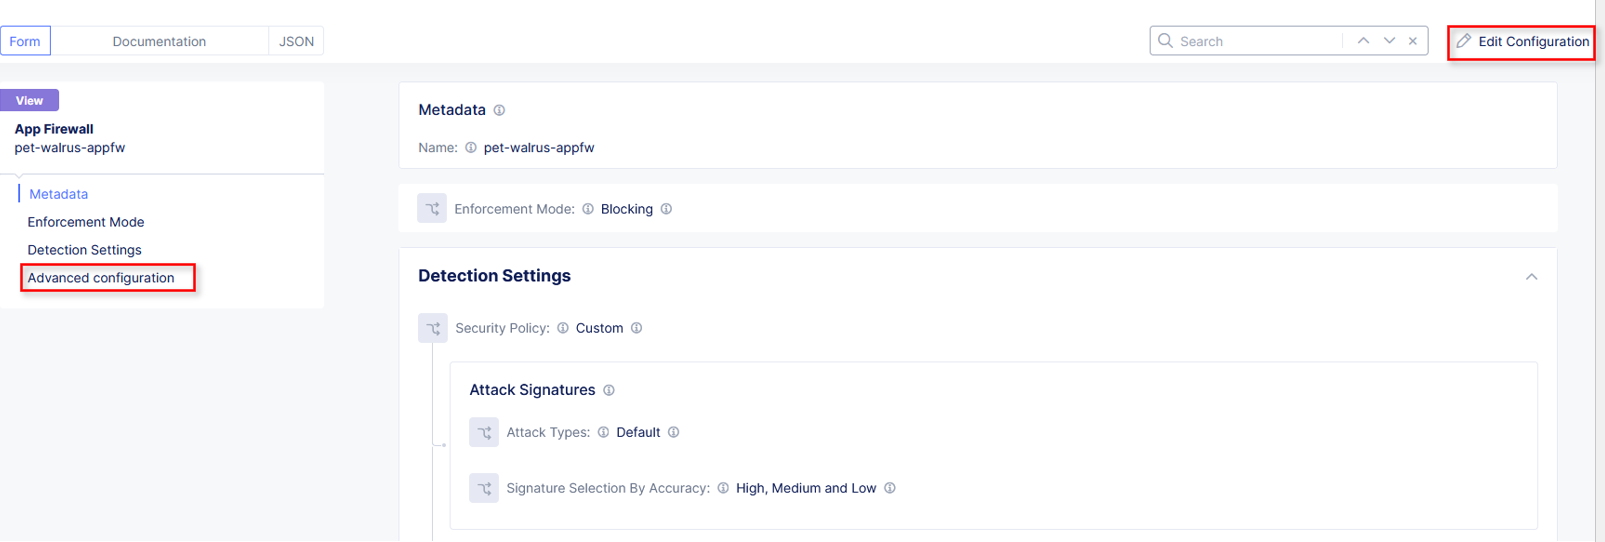
Click Edit Configuration in the top right corner.
Use the left-hand navigation and click on Advanced Configuration.
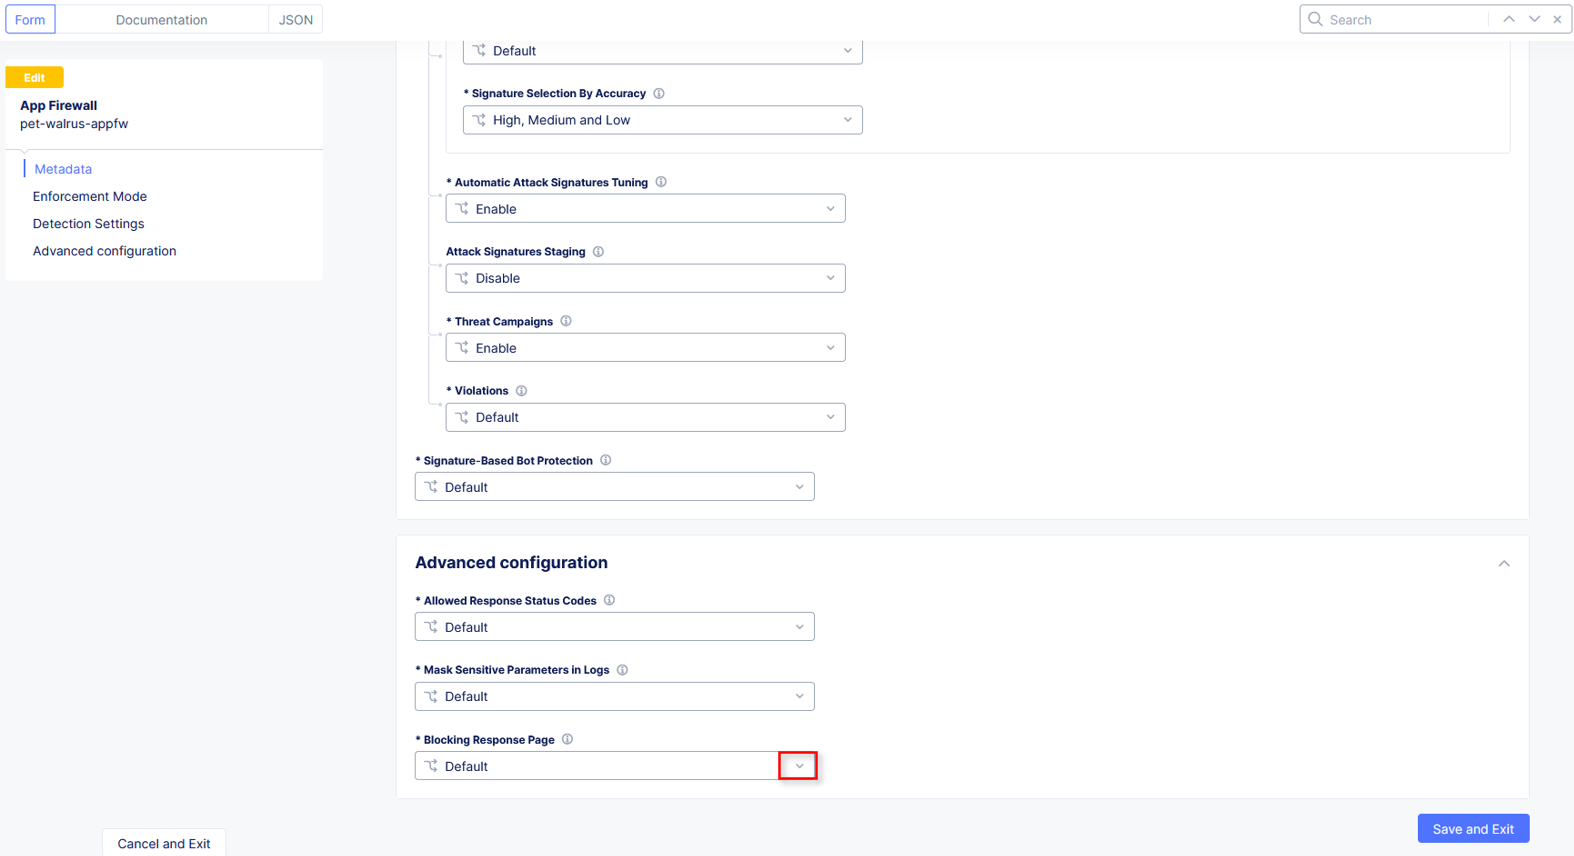
Click the drop down menu for Blocking Response Page in the Advanced Configuration section.
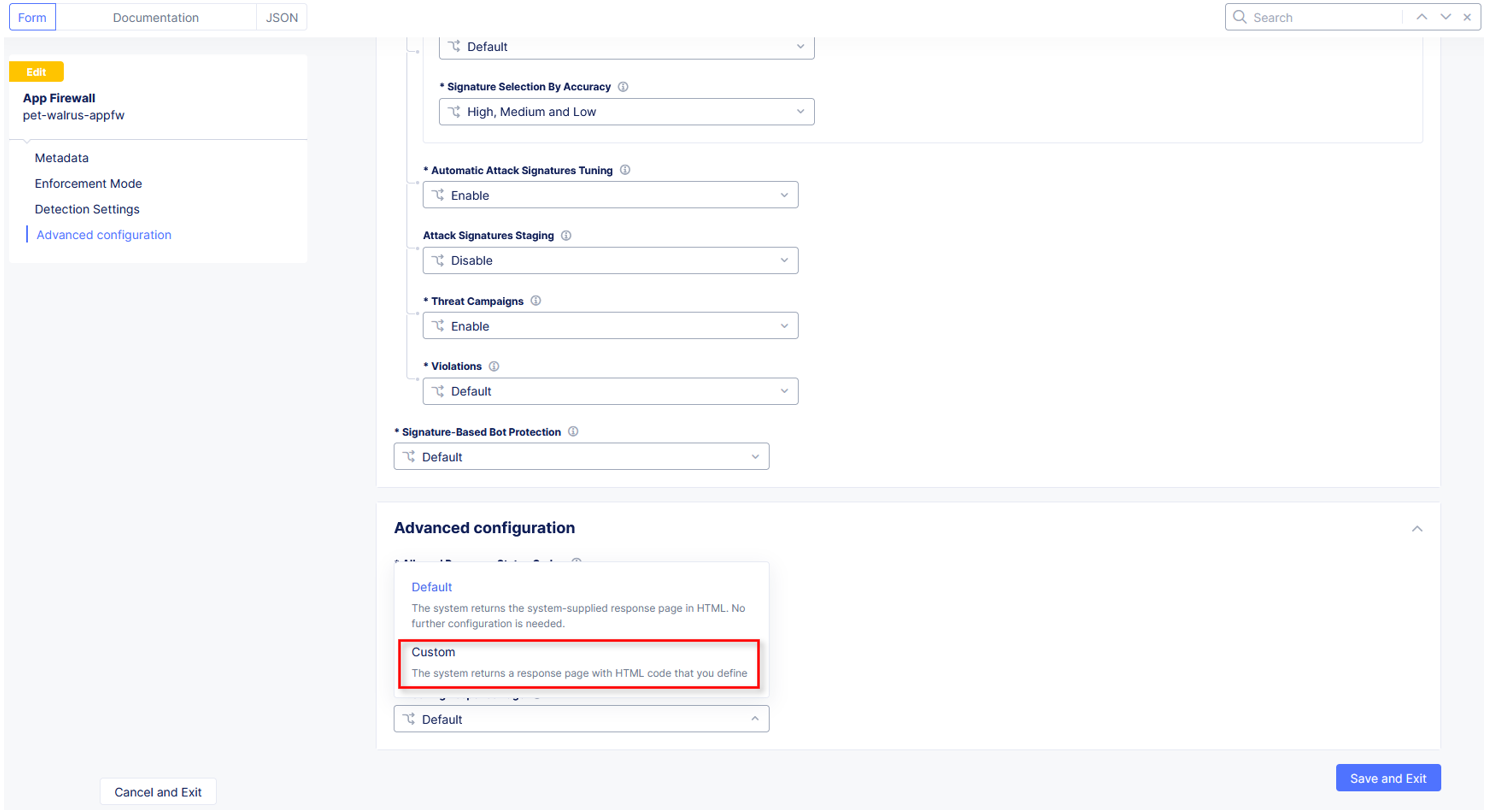
Click the dropdown on Blocking Response Page and select Custom from the dropdown.
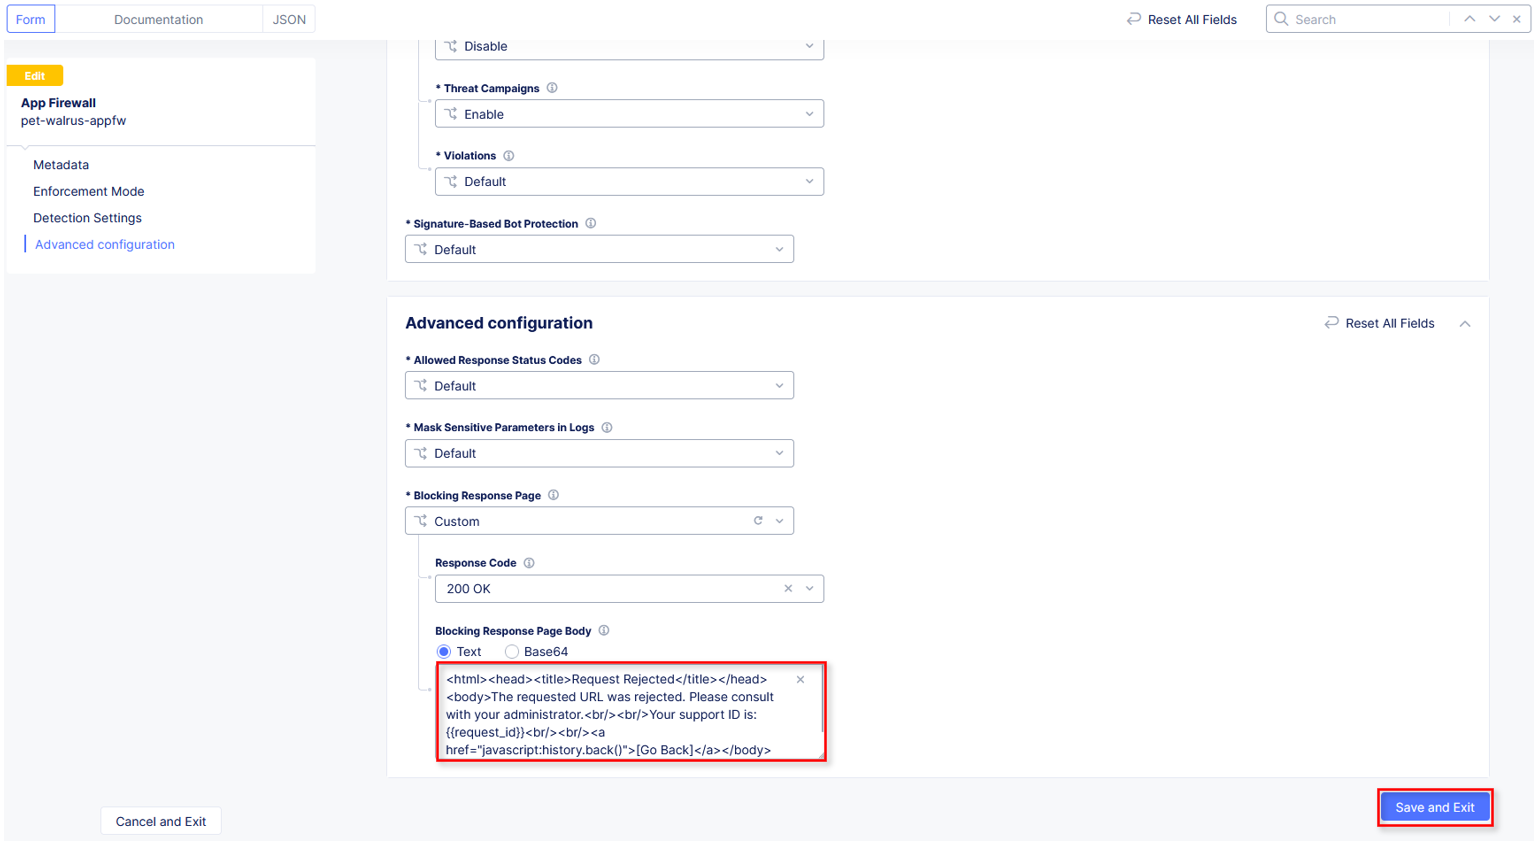
In the Blocking Response Page Body replace the existing text with the text provided below. Click Save and Exit when completed.
Sample Blocking Response Page to be copied:
<style>body { font-family: Source Sans Pro, sans-serif; }</style>
<html style="margin: 0;"><head><title>Rejected Request</title></head>
<body style="margin : 0;">
<div style="background-color: #046b99; height: 40px; width: 100%;"></div>
<div style="min-height: 100px; background-color: white; text-align: center;"></div>
<div style="background-color: #fdb81e; height: 5px; width: 100%;"></div>
<div id="main-content" style="width: 100%; ">
<table width="100%"><tr><td style="text-align: center;">
<div style="margin-left: 50px;">
<div style="margin-bottom: 35px;"><br/>
<span style="font-size: 40pt; color: #046b99;">Rejected Request</span>
</div><div style="font-size: 14pt;">
<p>The requested URL was rejected. Please consult with your administrator.</p>
<p>Your Support ID is: <span style="color:red; font-weight:bold">{{request_id}}</span></p>
<p><a href="javascript:history.back()">[Go Back]</a></p>
</div></div></td></tr></table></div>
<div style="background-color: #222222; position: fixed; bottom: 0px; height: 40px; width: 100%; text-align: center;"></div>
</body></html>
You can rerun an attack that was not excluded from Task 3: Step 2 to see the new custom block page.
Narrative Check
You have now completed your first WAF policy deployment on F5 XC. This policy can be re-used for other applications in the ACME environment and the exclusions you configured are only applied to this specific Azure application. New applications that utilize the WAF policy configured will not have these exclusions allowing you to quickly scale and manage exlusions on a per application basis while the policy can stay the same.
End of Lab 1: This concludes Lab 1, feel free to review and test the configuration.
A brief presentation will be shared prior to the beginning of Lab 2.