F5 Distributed Cloud > F5 Distributed Cloud: Discovering & Securing API’s Source | Edit on
Lab 6: Security Analytics and Malicious User Detection
Scenario
A recent review highlighted the need for greater visibility into API performance and security events. This includes identifying bad actors (clients) attempting to misuse or attack the API.
Investigate request and security events, and establish a method for detecting malicious users.
Expected Lab Time: 8 minutes
Task 1: Review Requests Dashboard
In this task, you will explore the Security Analytics Dashboard within Distributed Cloud (XC) for security events.
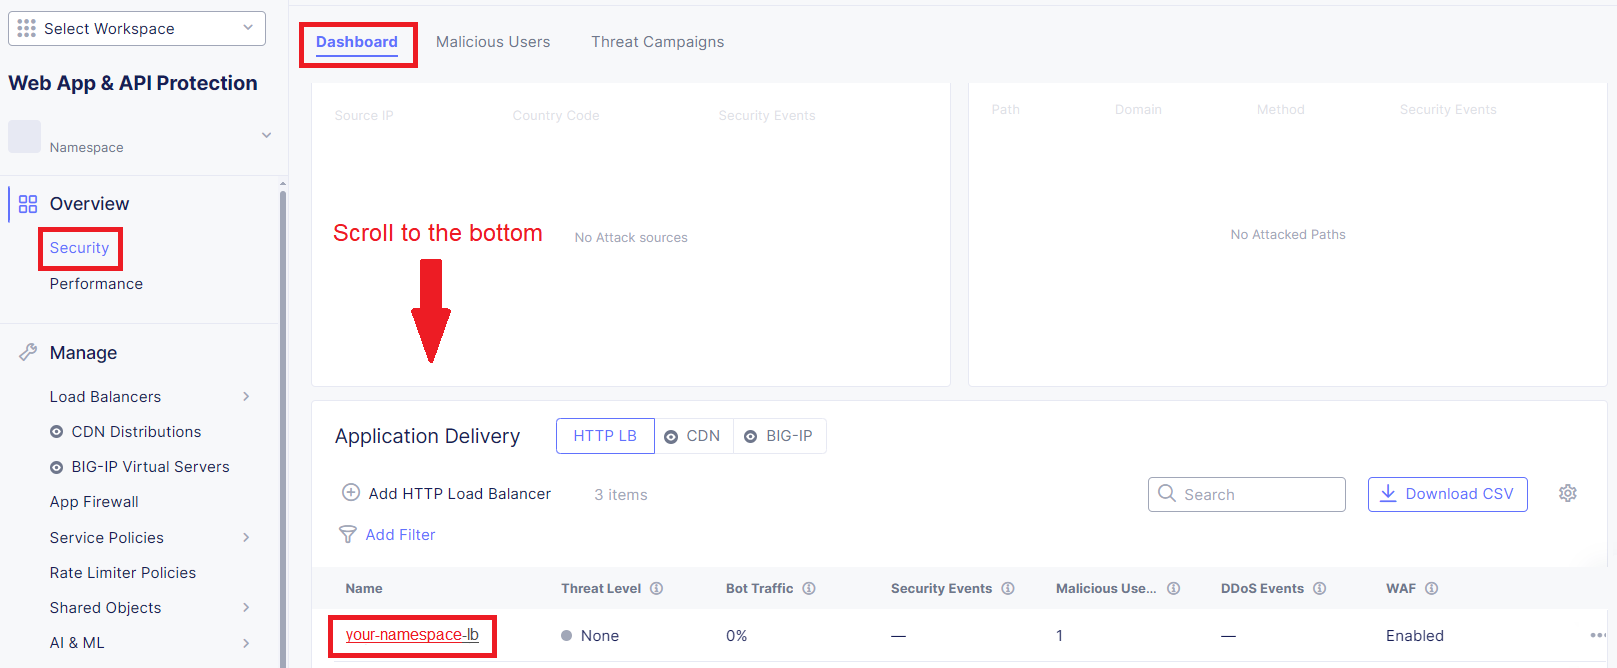
From the Web App & API Protection menu, navigate to Overview, then click Security
With the Dashboard view, scroll down to the bottom to the Application Delivery tile to find your HTTP Load Balancer object; click this LB object.
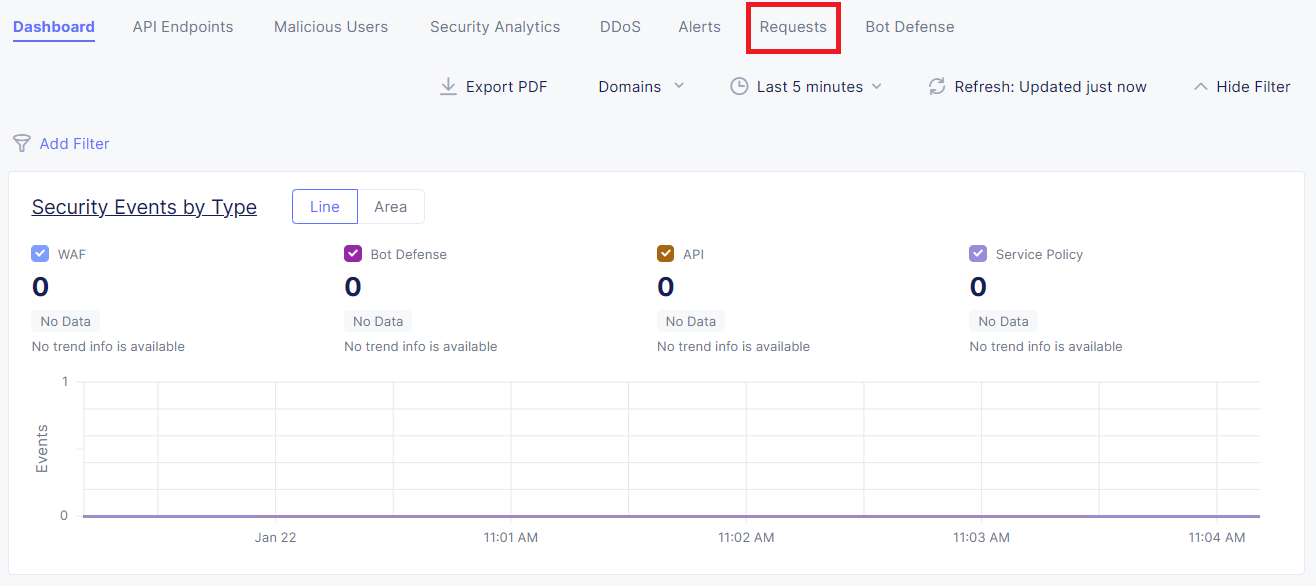
Within the Dashboard view, click the Requests tab:
On the right-hand side, expand the time window to Last 24 hour and click the Refresh button; this should provide details of your requests you made during this lab.
Review and explore the related request events. Expand various requests to understand if they were successful or denied.
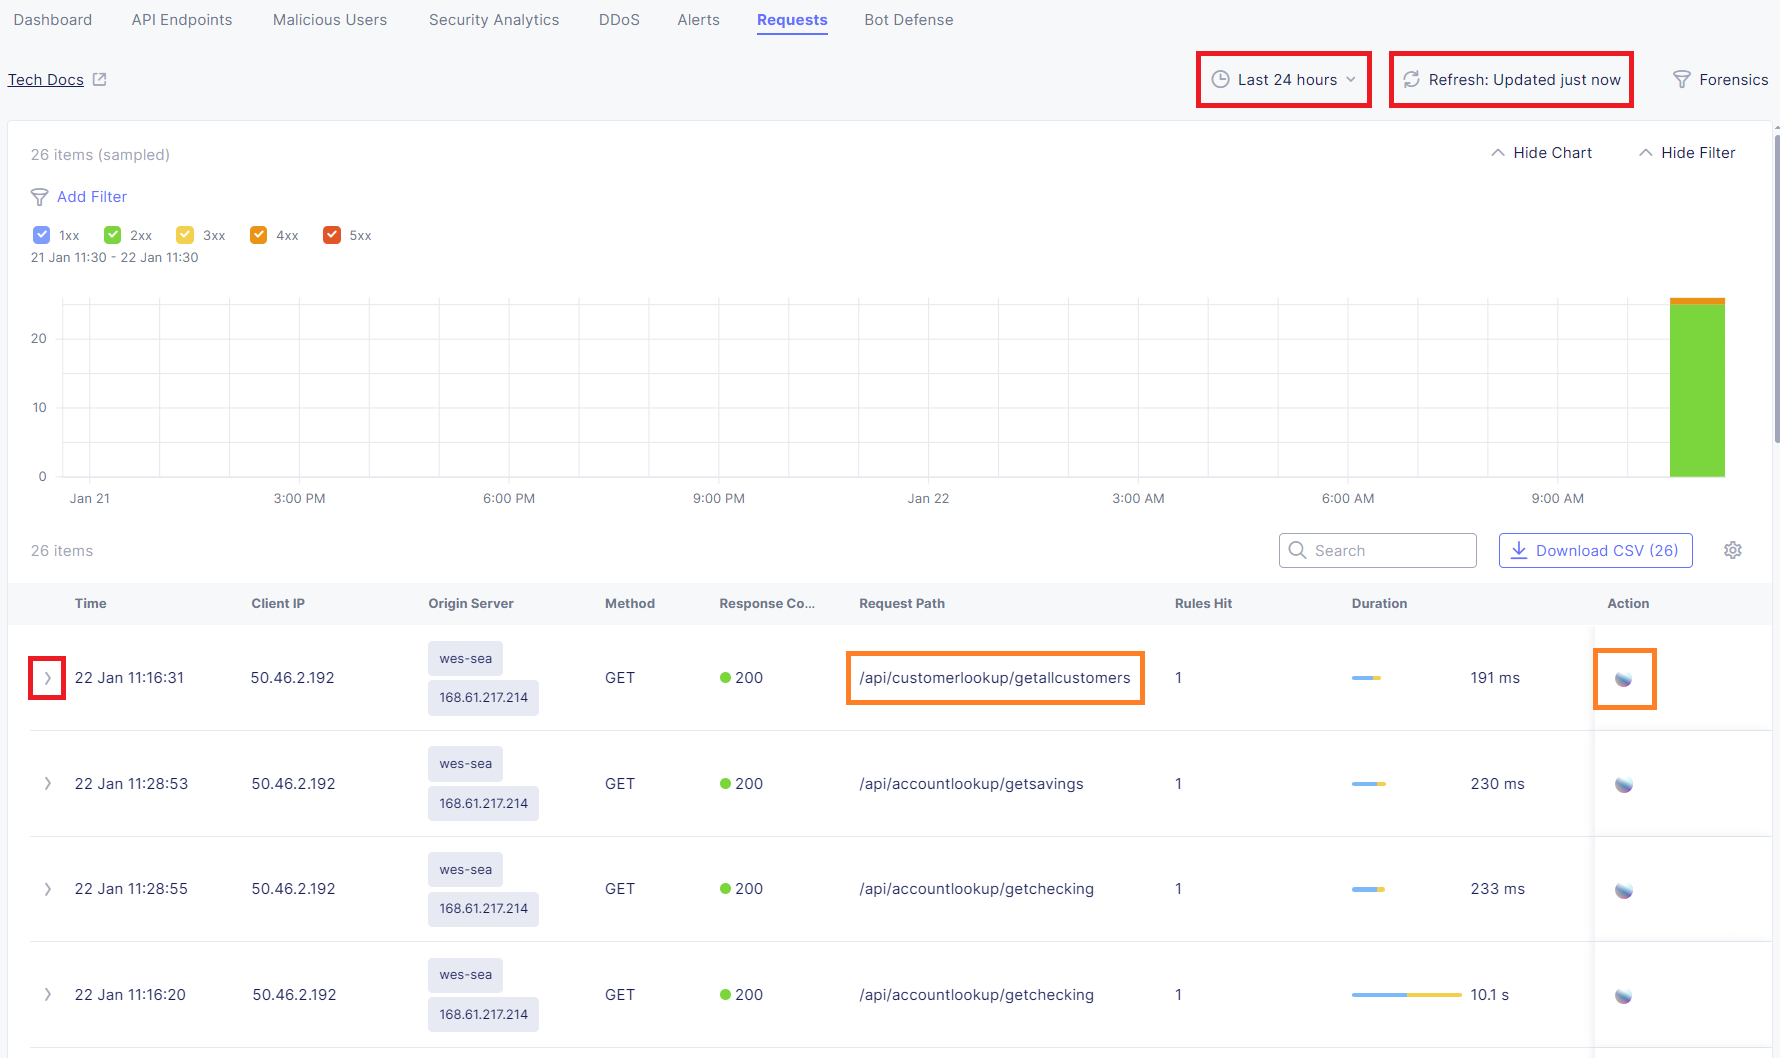
Continue to explore various filters, events, etc. within the Requests dashboard to review and explore the related events.
Task 2: Review Security Anatlyics Dashboard
In this task, you will explore the Security Analytics Dashboard within Distributed Cloud (XC) for security events.
From the Web App & API Protection menu, navigate to Overview, then click Security
With the Dashboard view, scroll down to the bottom to the Application Delivery tile to find your HTTP Load Balancer object; click this LB object.
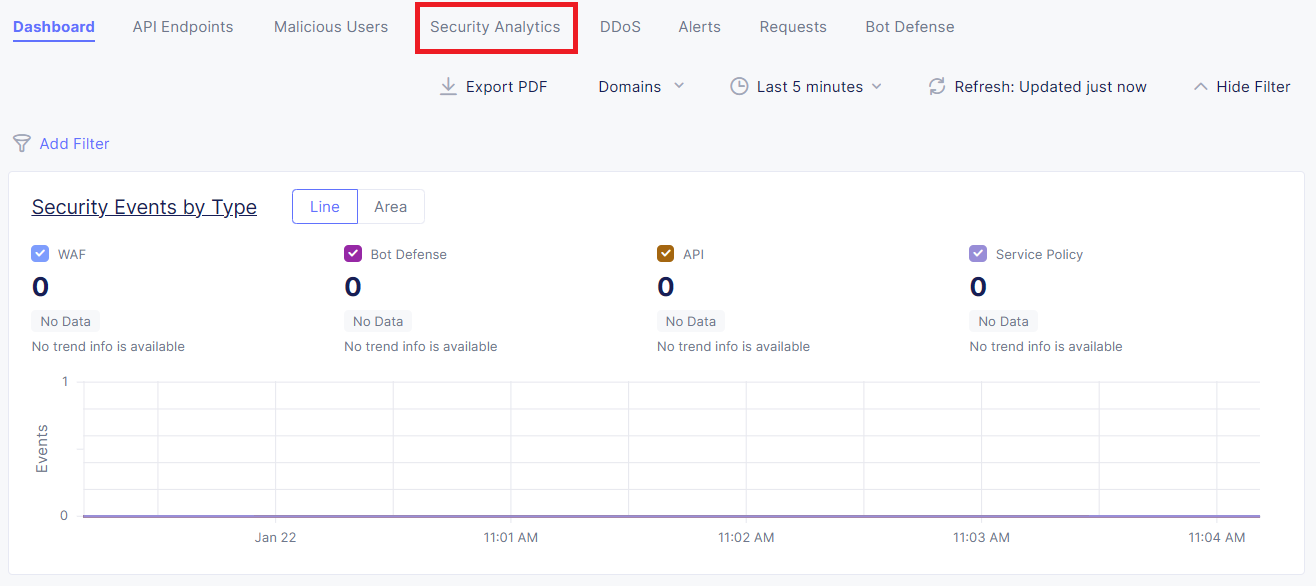
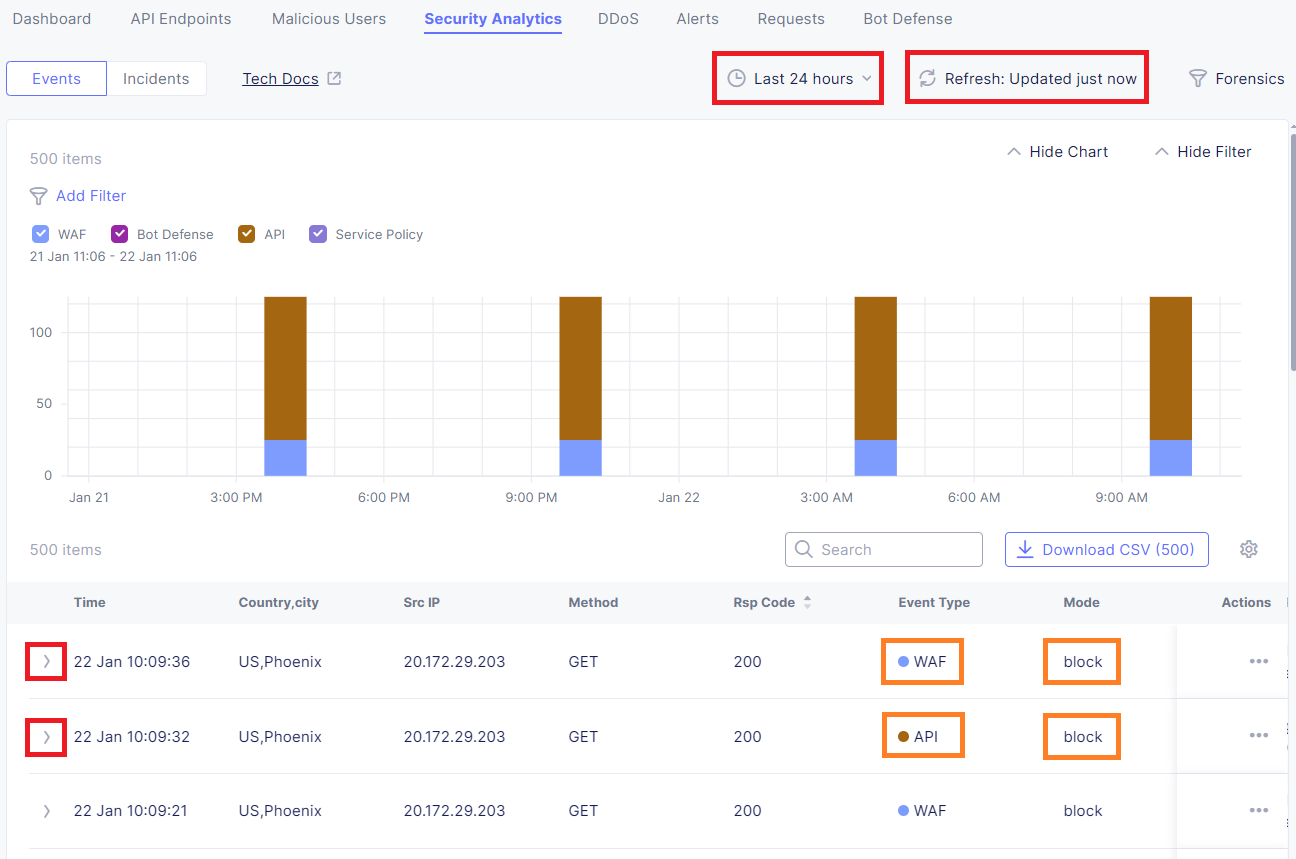
Within the Dashboard view, click the Security Analytics tab:
On the right-hand side, expand the time window to Last 24 hour and click the Refresh button; this should provide details of your requests you made during this lab.
Review and explore the related security events. Expand various requests to understand why they were allowed/blocked.
Continue to explore various filters, events, etc. within the Security Analytics dashboard to review and explore the related events. Try using the Forensics filter to drill-down further into specific traffic.
Task 3: Review Malicious User Detection
In this task, you will explore the Malicious Users section of the Security Analytics Dashboard within Distributed Cloud (XC).
From the Web App & API Protection menu, navigate to Overview, then click Security
With the Dashboard view, scroll down to the bottom to the Application Delivery tile to find your HTTP Load Balancer object; click this LB object.
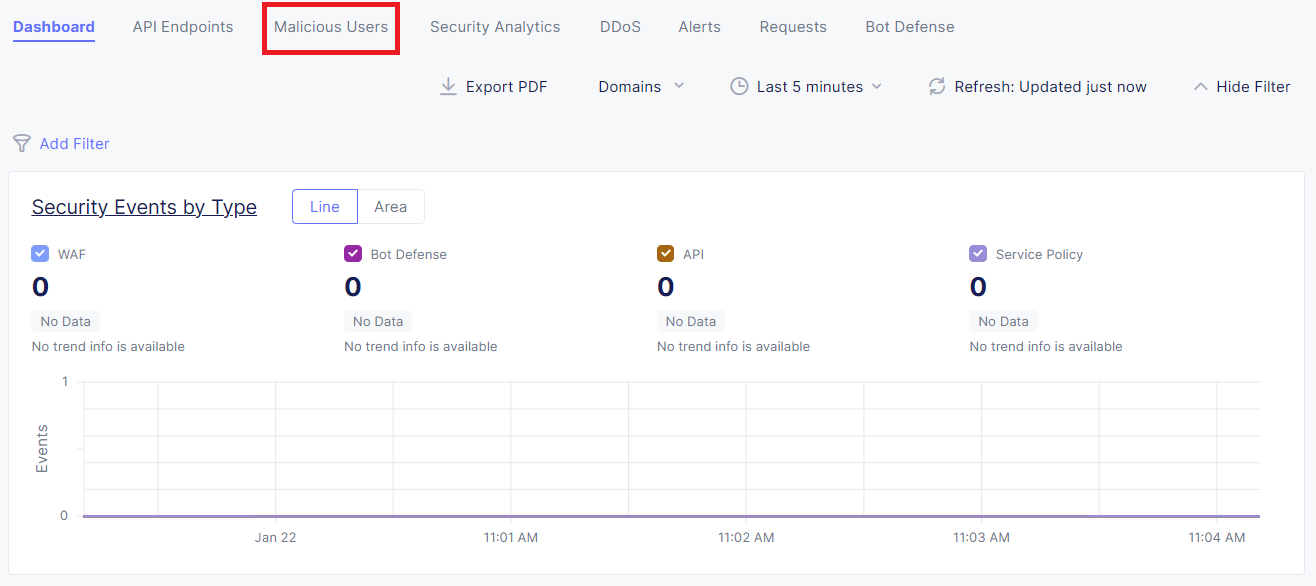
Within the Dashboard view, click the Malicious Users tab:
On the right-hand side, expand the time window to Last 24 hour and click the Refresh button; this should provide details of your requests you made during this lab.
Review and explore the related malicious user events.
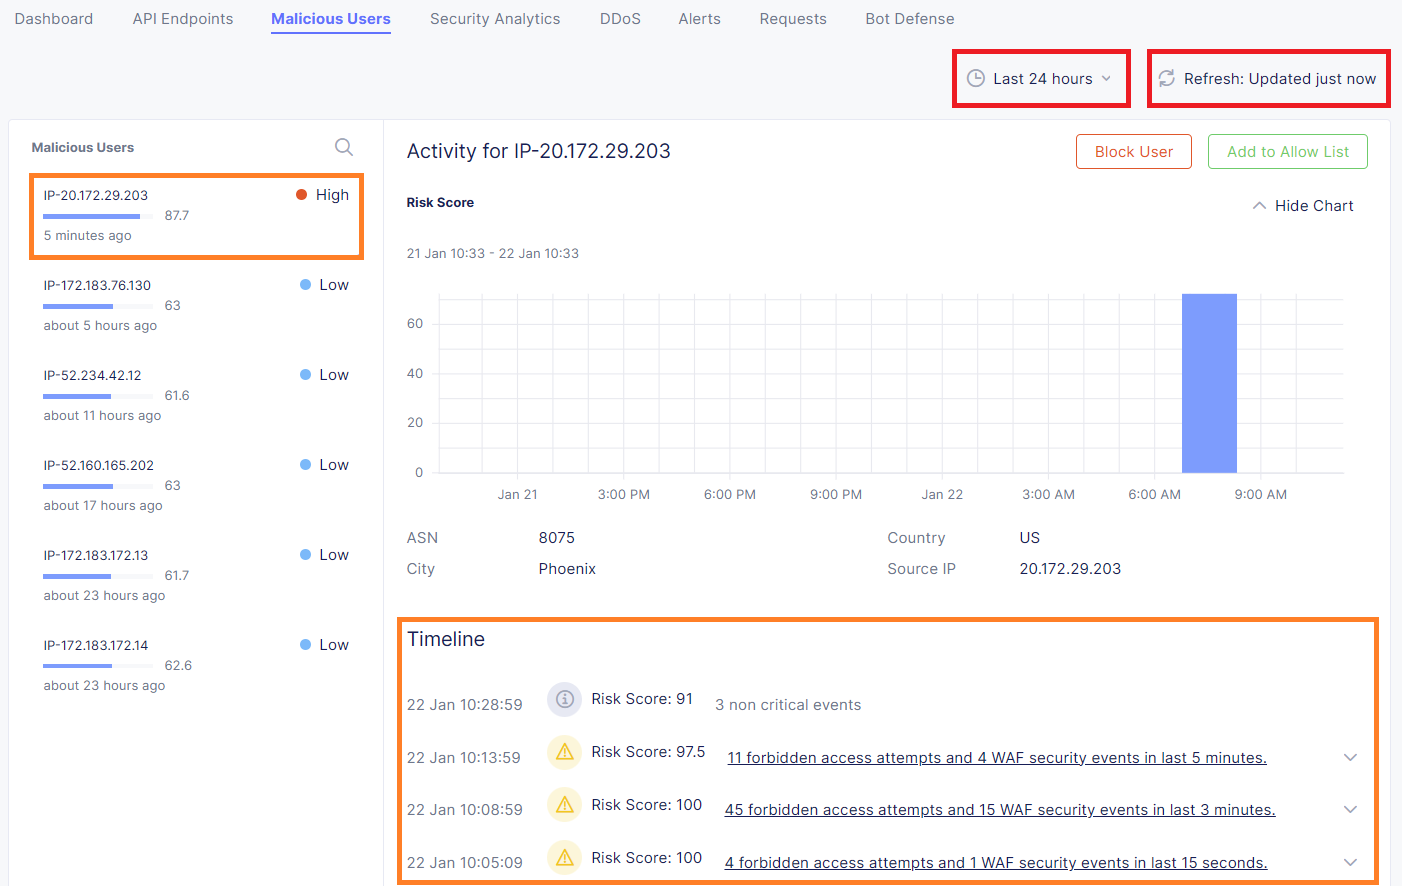
Note
Malicious User Detection also includes migitation, which was not enabled for this lab. As the user score increases action can be taken, including a temporary block.
End of Lab