F5 Distributed Cloud > F5 Distributed Cloud - Intro to Multi-Cloud Networking > Module 1: Network Connect Source | Edit on
Lab 2: Configuring Network Connect (L3/L4 Routing Firewall )
Objective:
Verify the XC Node’s health.
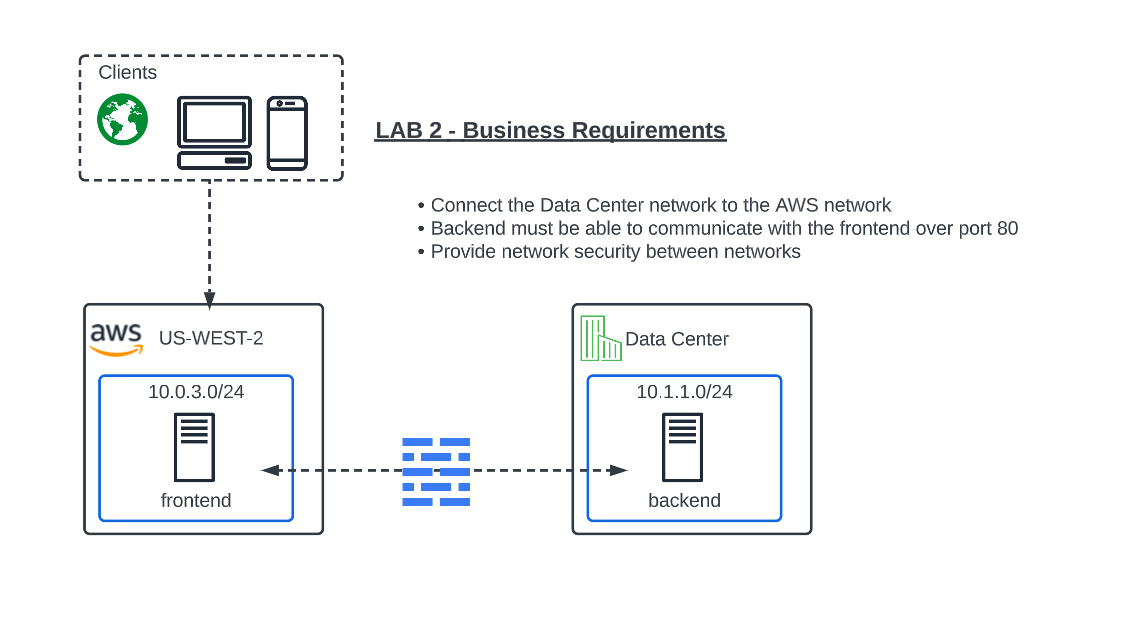
Configure Network Connect to connect the Data Center network to the AWS Network.
Test connectivity and configure Enhanced Firewall for network security
Narrative: Now that your XC Node is provisioned, it’s time to verify, explore the XC Console and set up Network Connect to establish secure connectivity between the Data Center and AWS networks. After the setup is complete, you will test connectivity and configure network security.
Verify the XC Node’s Health
If you are not already logged into the console, please do so now by opening the following URL in your browser:
https://f5-xc-lab-mcn.console.ves.volterra.io/
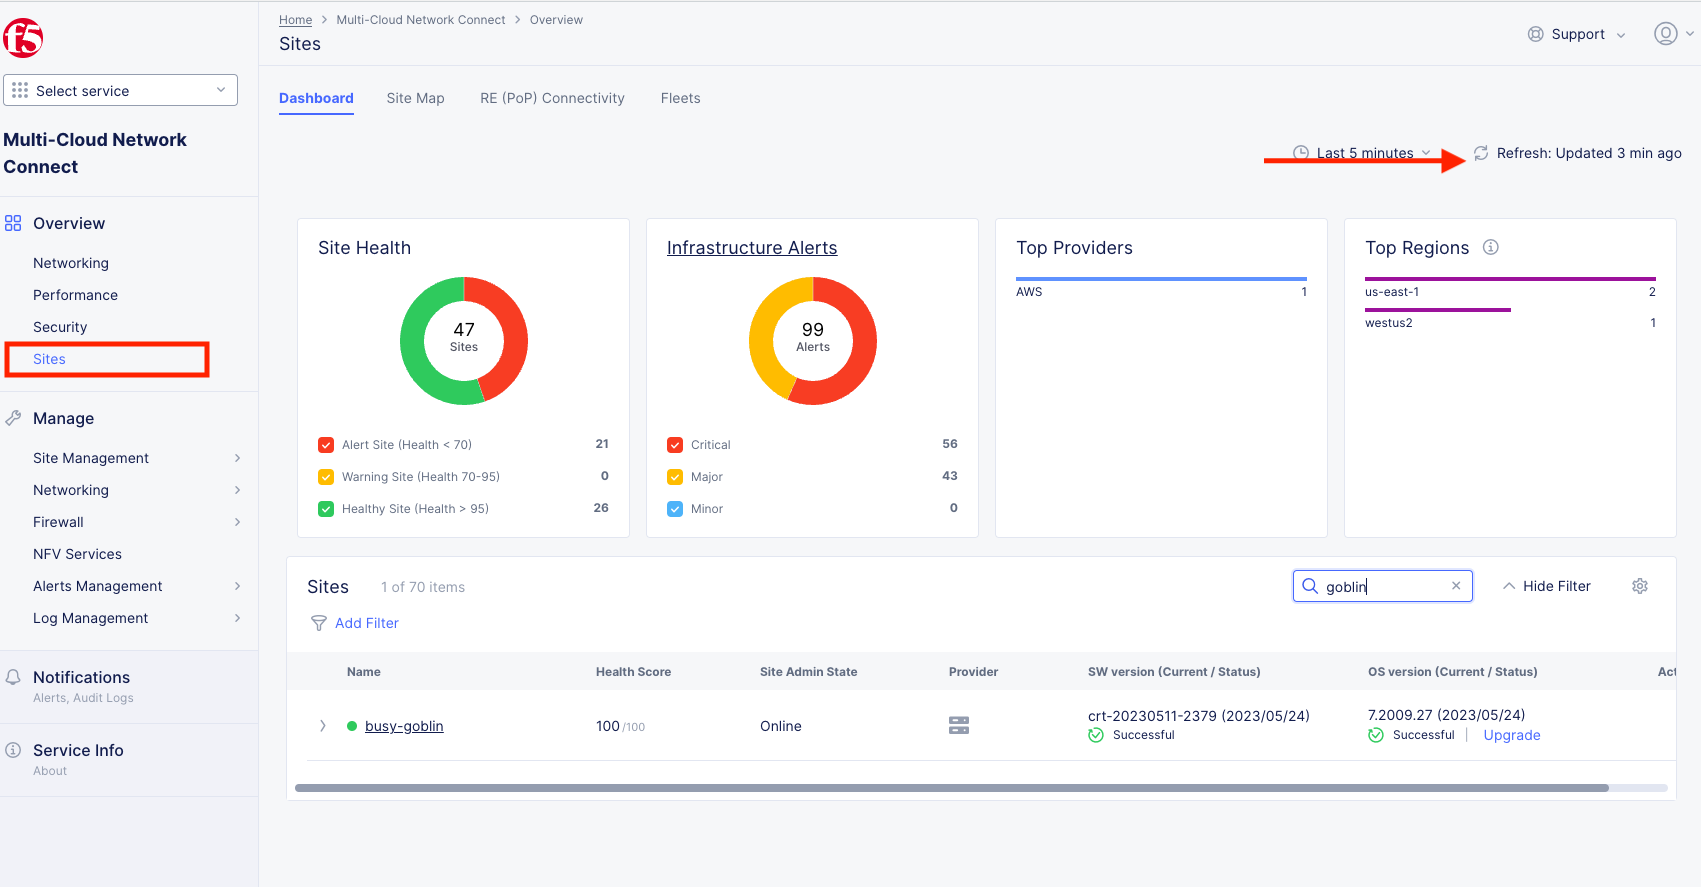
From the Select service menu, click on Multi-Cloud Network Connect and then click on Sites,
Your XC Node should have registered successfully and will appear green with a Health Score of 100. You may need to click Refresh in the top right corner if you do not see your animal name. In this example I was assigned and filtered for busy-goblin.
Important
If you do not see your Site as registered or in a healthy state please see a Lab Assistant.
From this Dashboard you can note the current Site Admin State, Provider, SW version, and OS version.
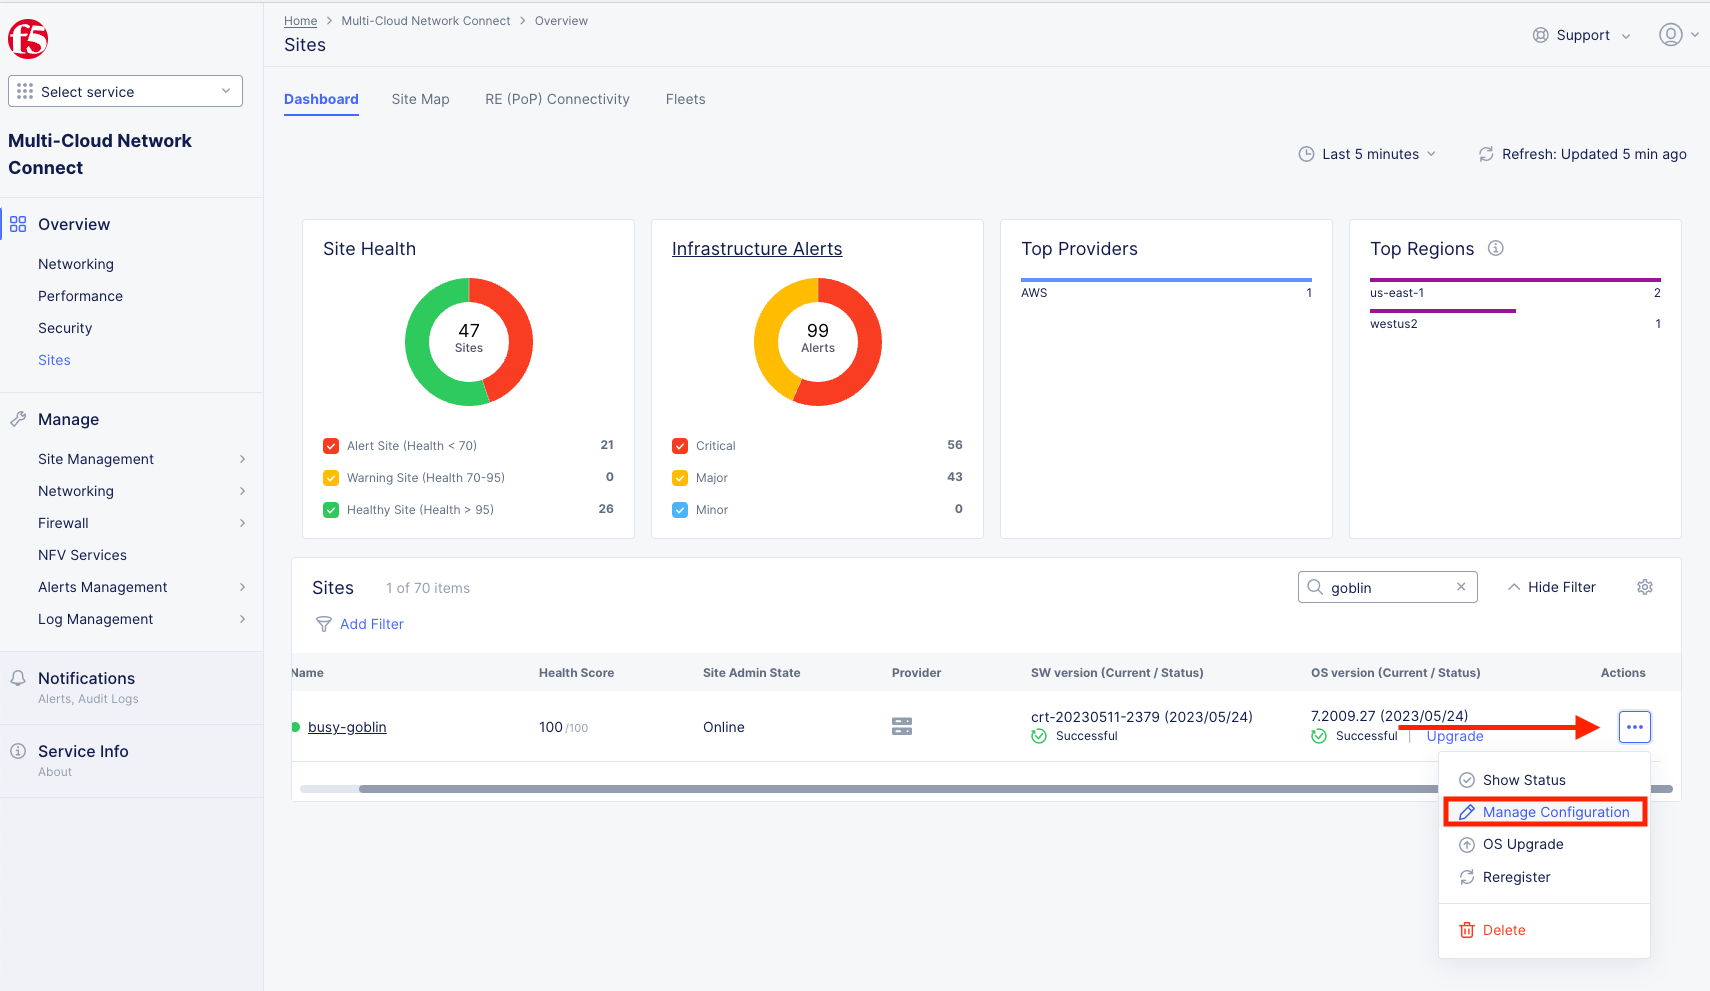
Please DO NOT click “Upgrade” on any of the Sites!
Instead, Click on the three dots under the Actions column at the far right of the screen of “your animal” Site and click on Manage Configuration. In this screenshot I was busy-goblin.
Note
You may need to scroll horizontally inside the table to see the three dots at the righthand side. Alternately, you can zoom out (Ctrl -) on the page to see them.
Review the Metadata, Site Type and Coordinates fields as well as the Connected REs (Regional Edge) section.
These are the closest Regional Edge sites based on the latitude and longitude information provided during the deployment process. Each CE has an auto-provisioned self-healing secure tunnel to redundant RE’s.
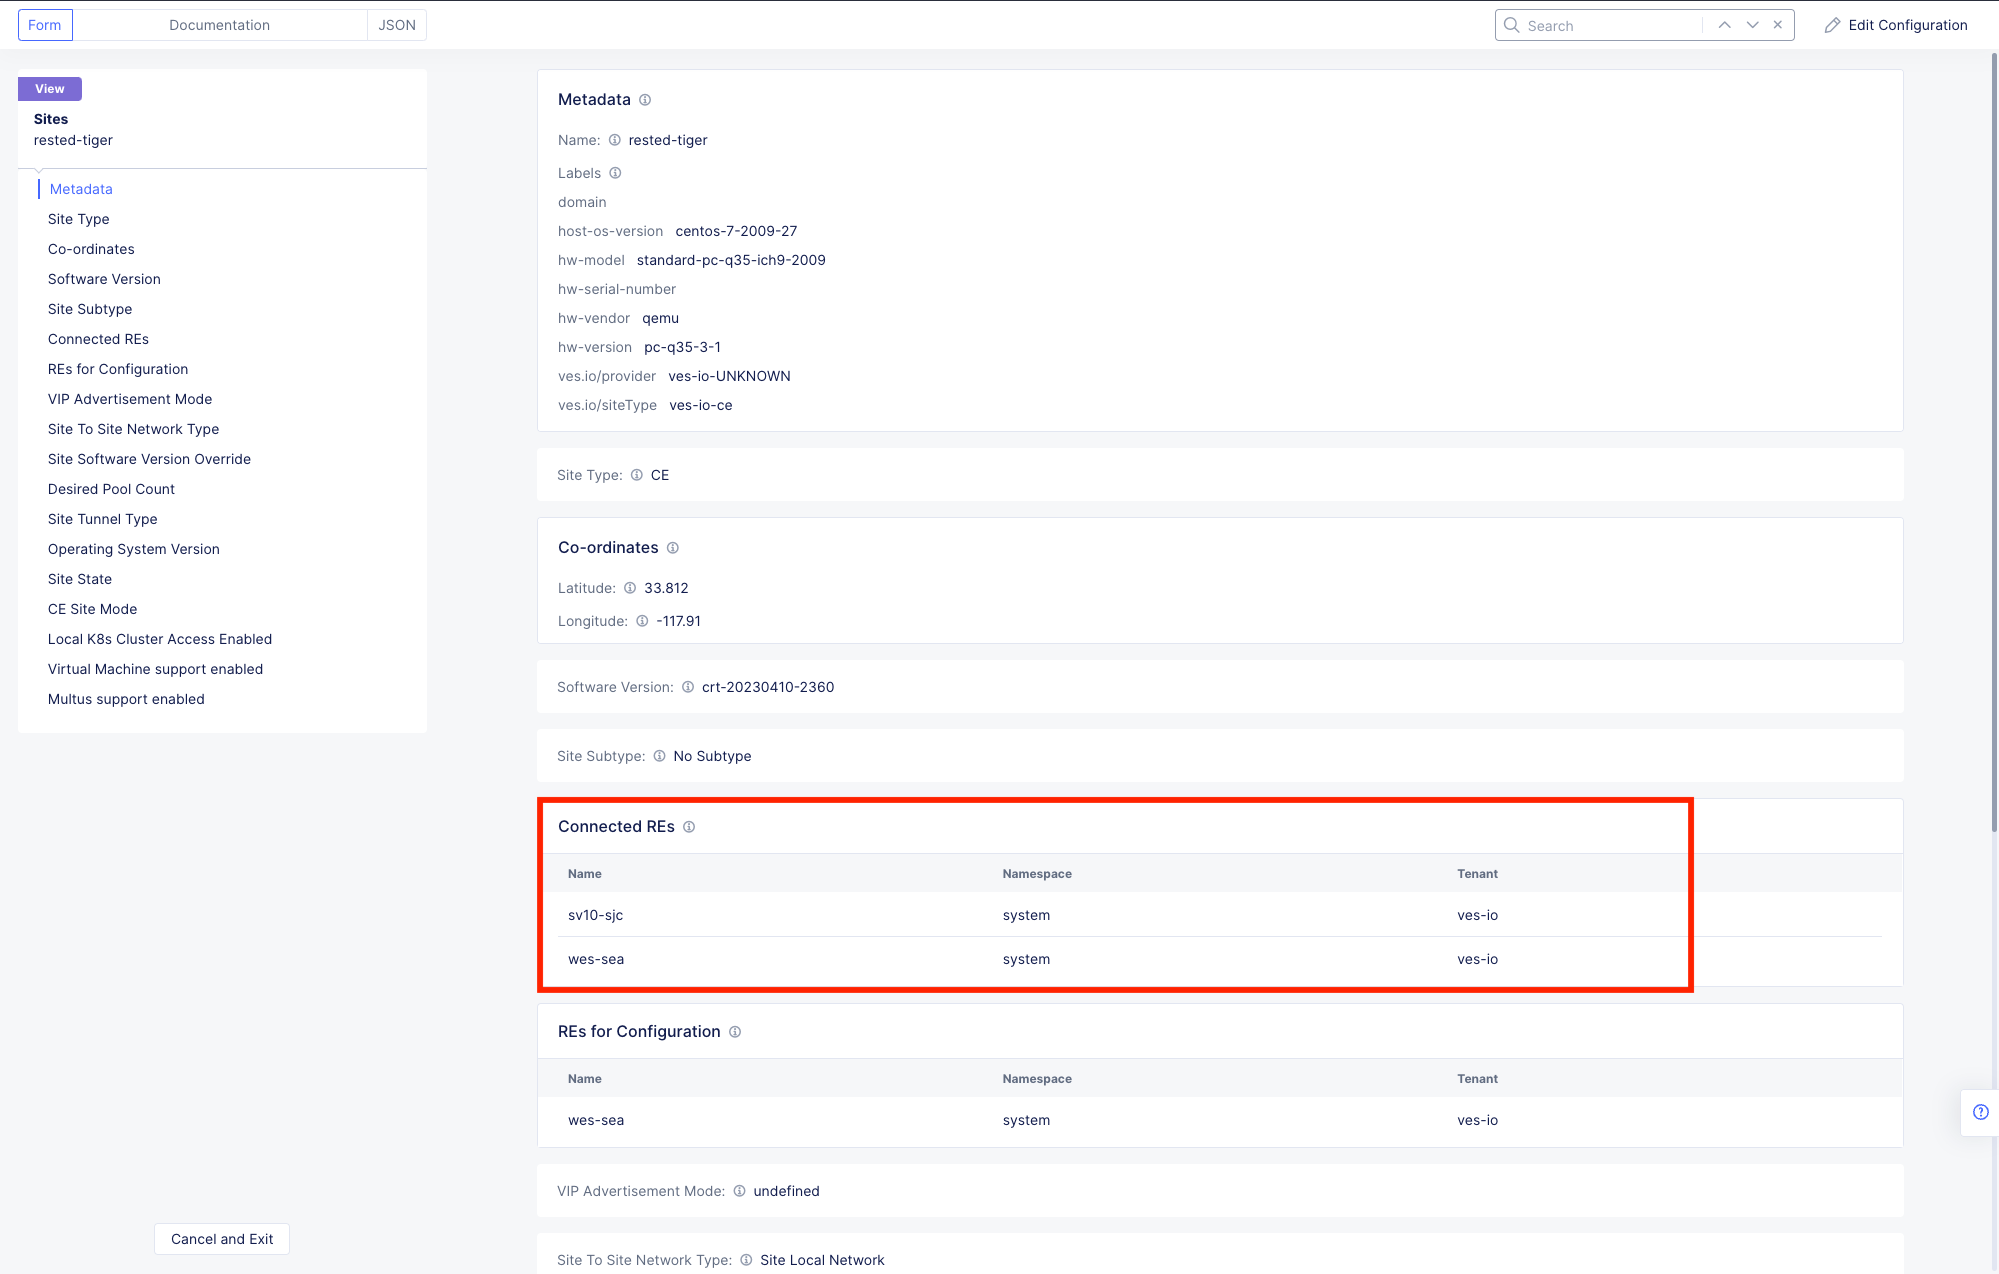
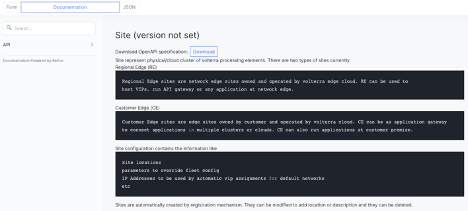
Look at the top left-hand corner where you see Form, Documentation and JSON. You will see these fields throughout the Distributed Cloud Console configuration menus.
Important
Distributed Cloud is built with an API-first strategy. All the configurations can be done via GUI or API calls.
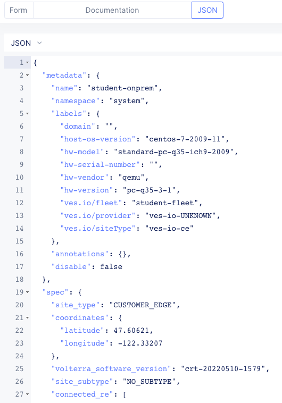
You can view the JSON file of the configuration by clicking JSON.
This is the JSON code of the configuration which could be saved to create a backup of the Customer Edge configuration, but that is beyond the scope of this lab.
Click on Documentation.
This will load the API specification for a Customer Edge Node. Review briefly and click Cancel and Exit
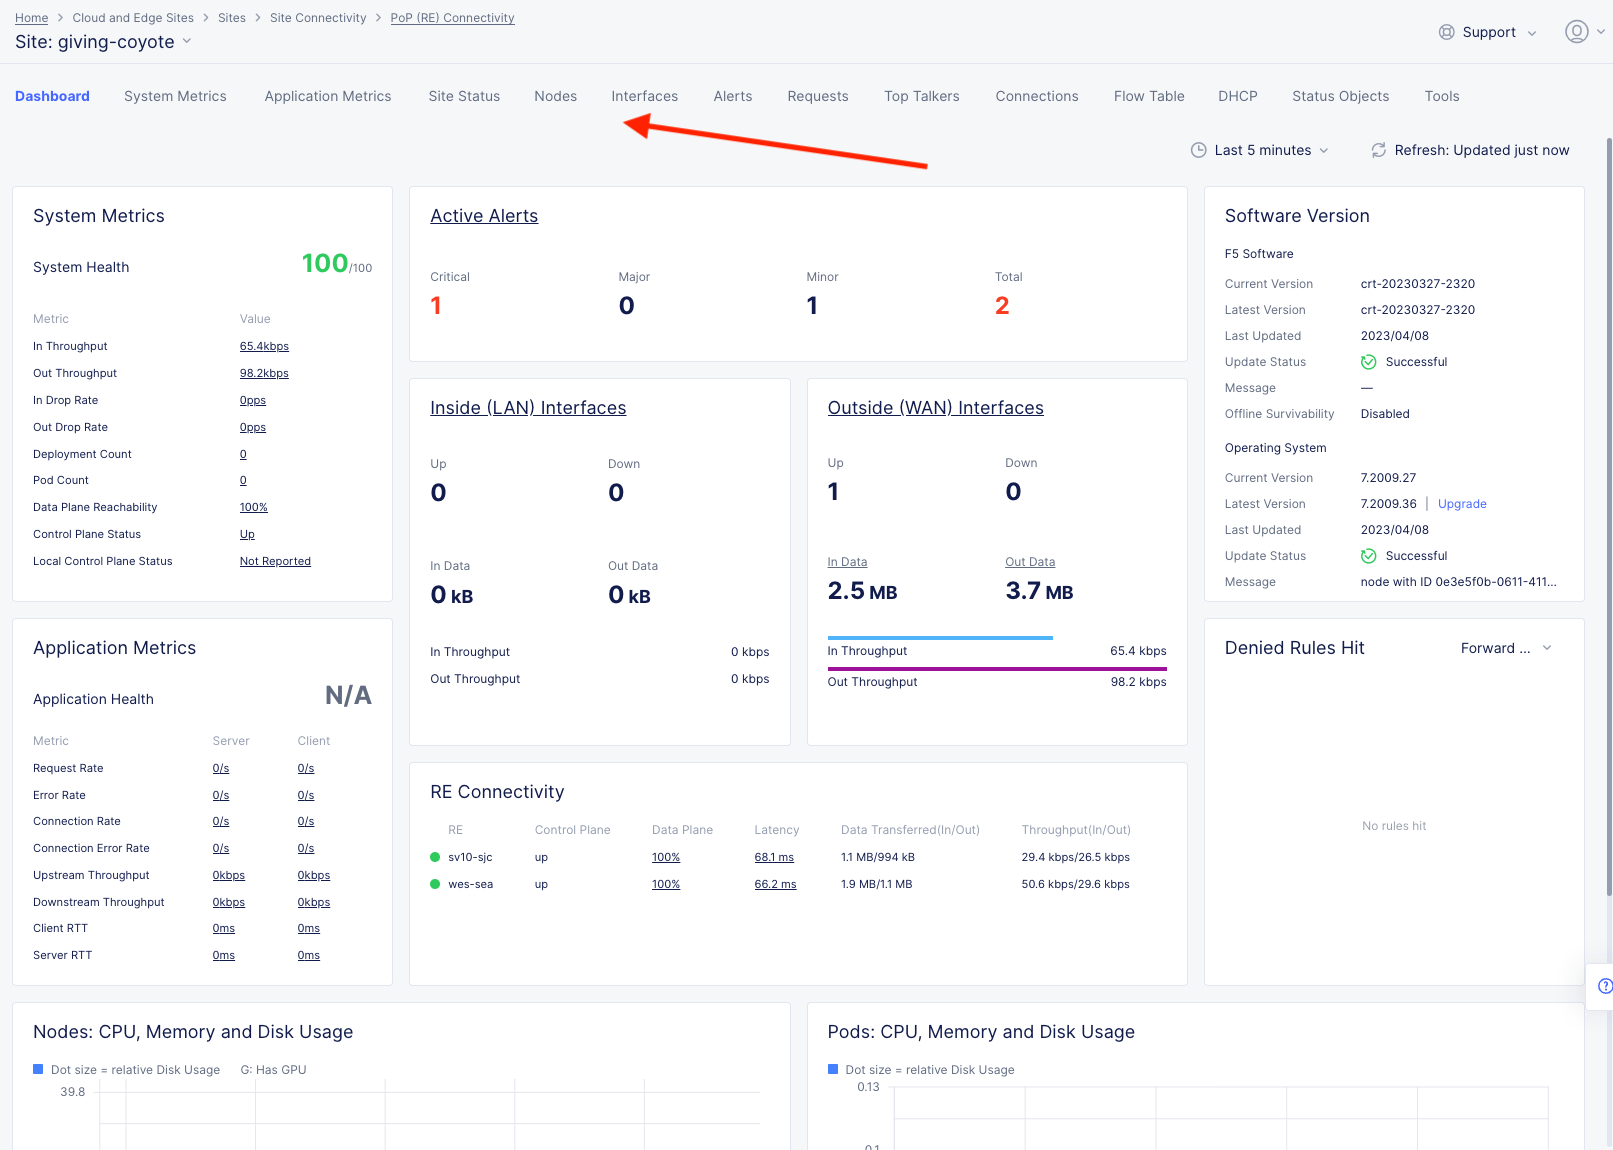
In the Site screen, click on your Customer Edge Node animal name. (It should have a green status symbol)
The default landing is a Dashboard giving you a detailed summary of the Customer Edge Node. Briefly explore the extensive menus and analytics at the top of the screen.
Narrative Check
Now that you are familiar with your new “Software Defined” Node, we can start getting our hands dirty with the real configuration necessary to meet ACME Corp’s first requirement to get the network in the Data Center connected to the network in AWS. The backend security device will need to “scan” the frontend in AWS on port 80 and all other ports must be blocked.
Configuring Network Connect
In our lab today, an Ubuntu Server in the UDF environment will simulate the backend. The AWS frontend workload is already deployed along with an XC Node to extend the Customer Edge in the AWS cloud.
Note
The Data Center backend has a pre-existing route to 10.0.3.0/24 and it points to the single outside interface of the Data Center XC Node. The AWS workload has a route to 10.1.1.0/24 that points to the inside interface of the AWS XC Node.
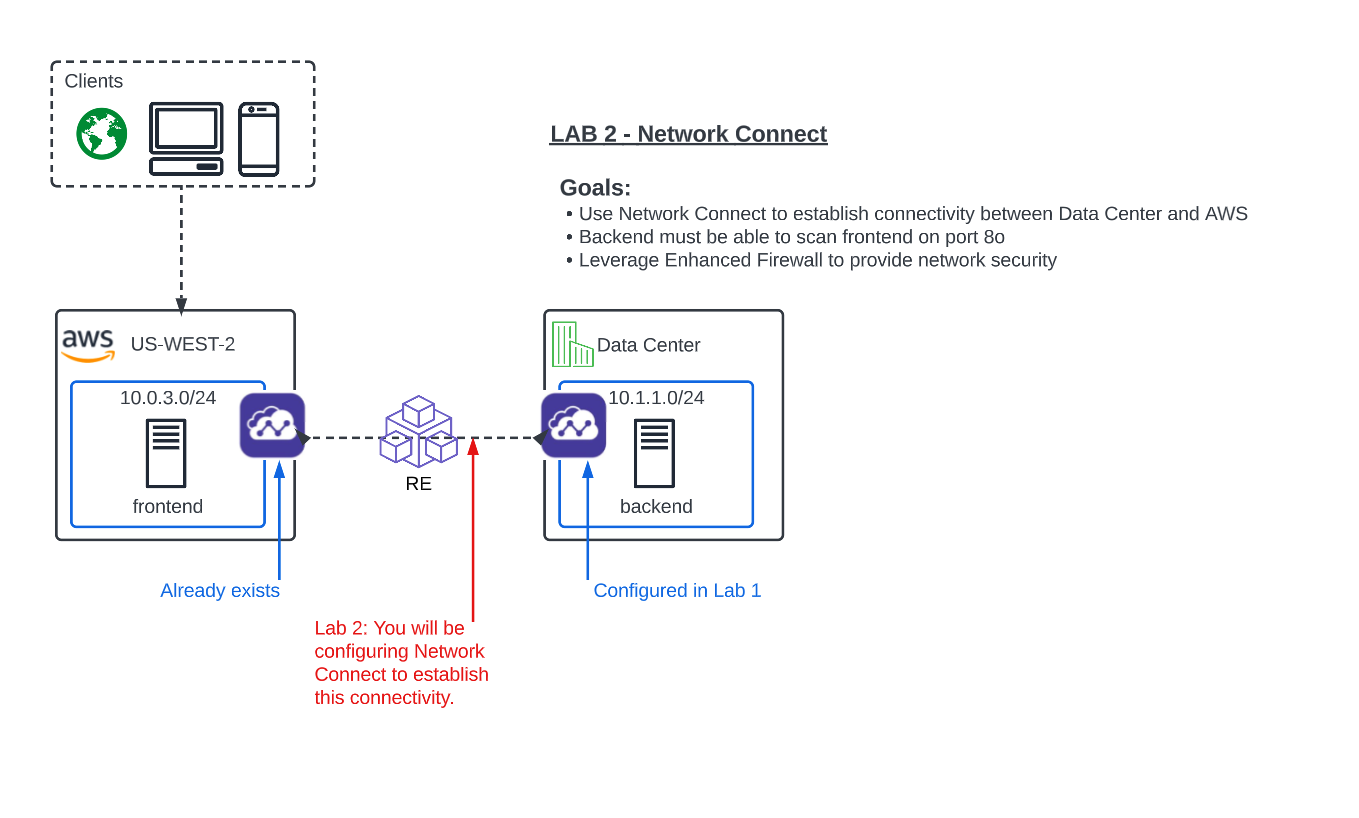
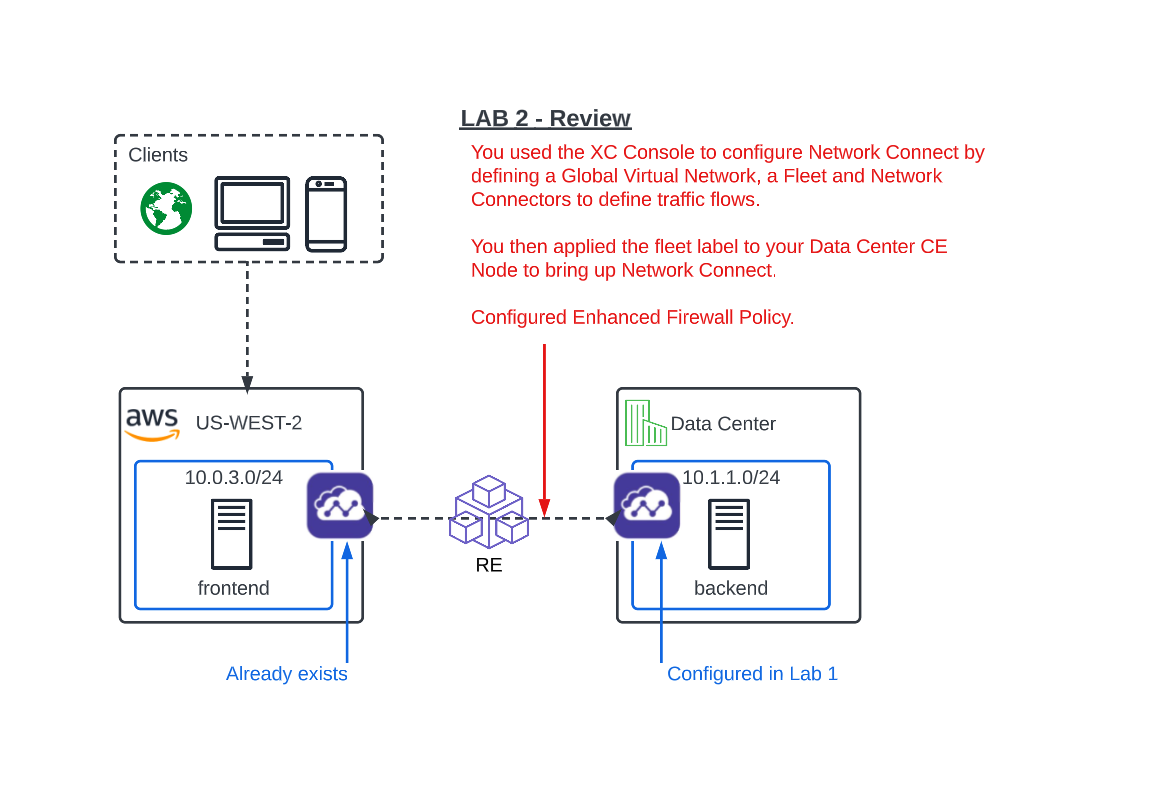
What you have done so far in Lab 1 and the beginning of Lab 2, is setup the ACME Data Center XC Node to extend the Data Center Customer Edge. Your next goal is to simply establish routing between these environments by using a hub and spoke model with our Regional Edges as shown in the diagram above.
All traffic between these networks will now be routed through auto-provisioned, self-healing and encrypted tunnels between the defined Customer Edges and the XC Regional Edges.
Note
In this lab some objects are already created due to permission requirements in the XC Lab environment. You will still observe and walkthrough the configuration for referrence.
Global Virtual Network
To connect two or more Distributed Cloud node environments together across the Distributed Cloud network we will need to connect the sites through a Global Virtual Network.
Confirm you are still in the Multi-Cloud Network Connect Console under Sites. If not, click on the Select Service in the left-hand navigation and click on Multi-Cloud Network Connect.
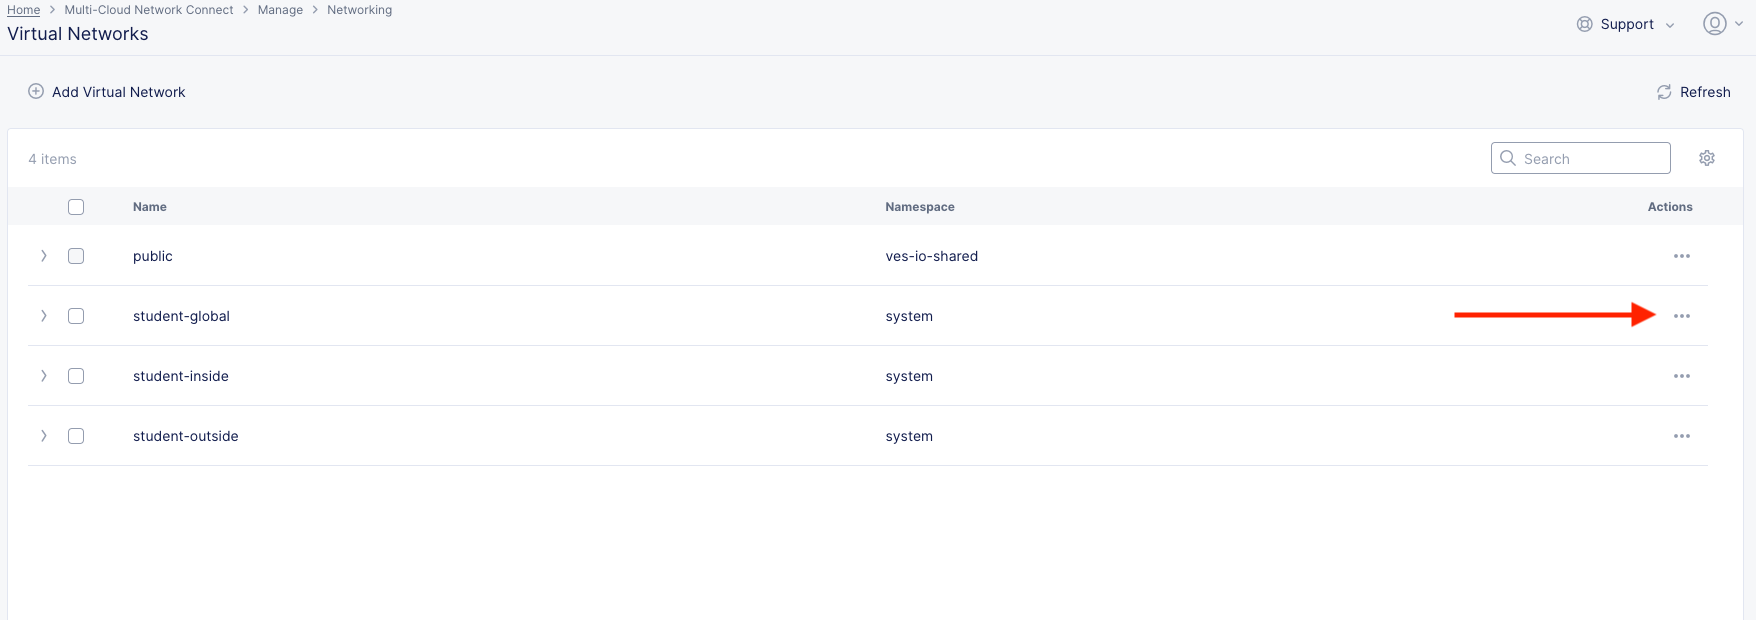
On the left side menu, navigate to Manage >> Networking >> Virtual Networks.
Observe the pre-configured student-global Virtual Network. Click the the dots under the Action menu for student-global and then Manage Config. Note the very simple config.
Click Cancel and Exit.
Note
Due to tenant permissions you will not be able to create your own Global Virtual Network.
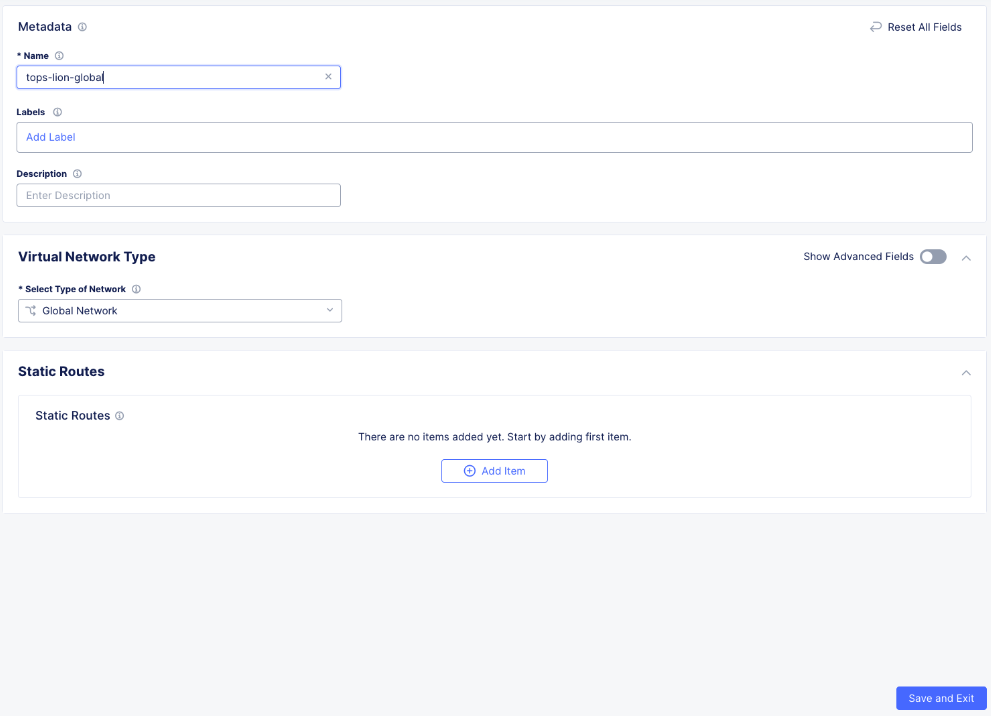
If you wanted to configure this outside of the lab, you would simply click Add Virtual Network button, enter a name for the Virtual Network and make sure it is type Global. Simple indeed!
The configuration would look like the screen below.
Fleets
A Fleet is used to configure infrastructure components (like nodes) in one or more F5® Distributed Cloud Services Customer Edge (CE) sites homogeneously.
Fleet configuration includes the following information
Software image release to be deployed on the Fleet
Virtual networks
List of interface and devices to be configured on every node
Connections between the virtual networks
Security policies applied in the Site
Note
In this lab we have already created a fleet called “student-fleet” for you due to permission restrictions.
Review Fleet Config
In Multi-Cloud Network Connect context, go down to Manage >> Site Management >> Fleets.
Click on the 3 dots at the far right hand side of student-fleet and select Manage Configuration
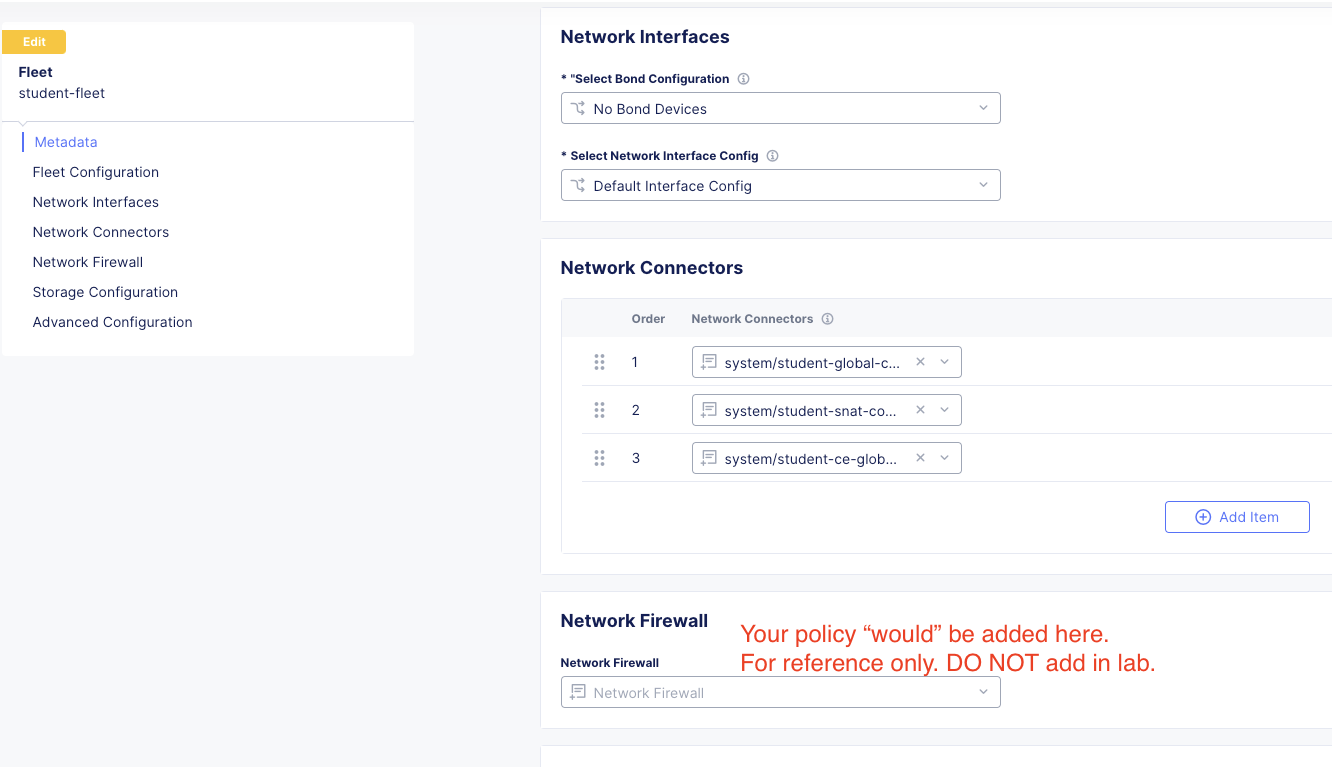
In the next screen click on Edit Configuration in the top right of the screen and Observe the Fleet Configuration and Network Connectors.
A Network Connector is used to create a connection between two virtual networks on a given site.
For more information on Network Connectors and their functions you can review this link: https://docs.cloud.f5.com/docs/how-to/networking/network-connectors
The Network Connectors are configured as:
student-global-connector
Network Connector Type: Direct, Site Local Inside to a Global Network
Global Virtual Network: system/student-global
student-snat-connector
*Network Connector Type: SNAT, Site Local Inside to Site Local Outside
Routing Mode: Default Gateway
SNAT Source IP Selection: Interface IP
student-ce-global-connector
Network Connector Type: Direct, Site Local Outside to a Global Network
Global Virtual Network: system/student-global
Also, notice Network Firewall is NOT currently defined. We will come back to that in a few moments.
Click Cancel and Exit.
Fleet Label
Labels are a map of string keys and values that can be used to organize and categorize objects within Distributed Cloud.
Fleet has a field called fleet_label. When a Fleet object is created, the system automatically creates a “known_label” named: “ves.io/fleet”. The known_label is created in the Shared namespace for the tenant. A site is made a “member of Fleet” when this known_label is added to the site. A site can have at most one known_label of type ves.io/fleet and hence belongs to exactly one Fleet at any given time.
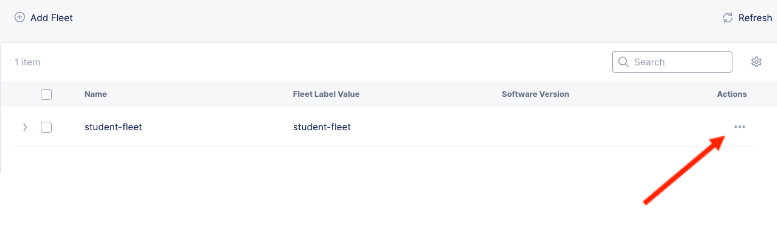
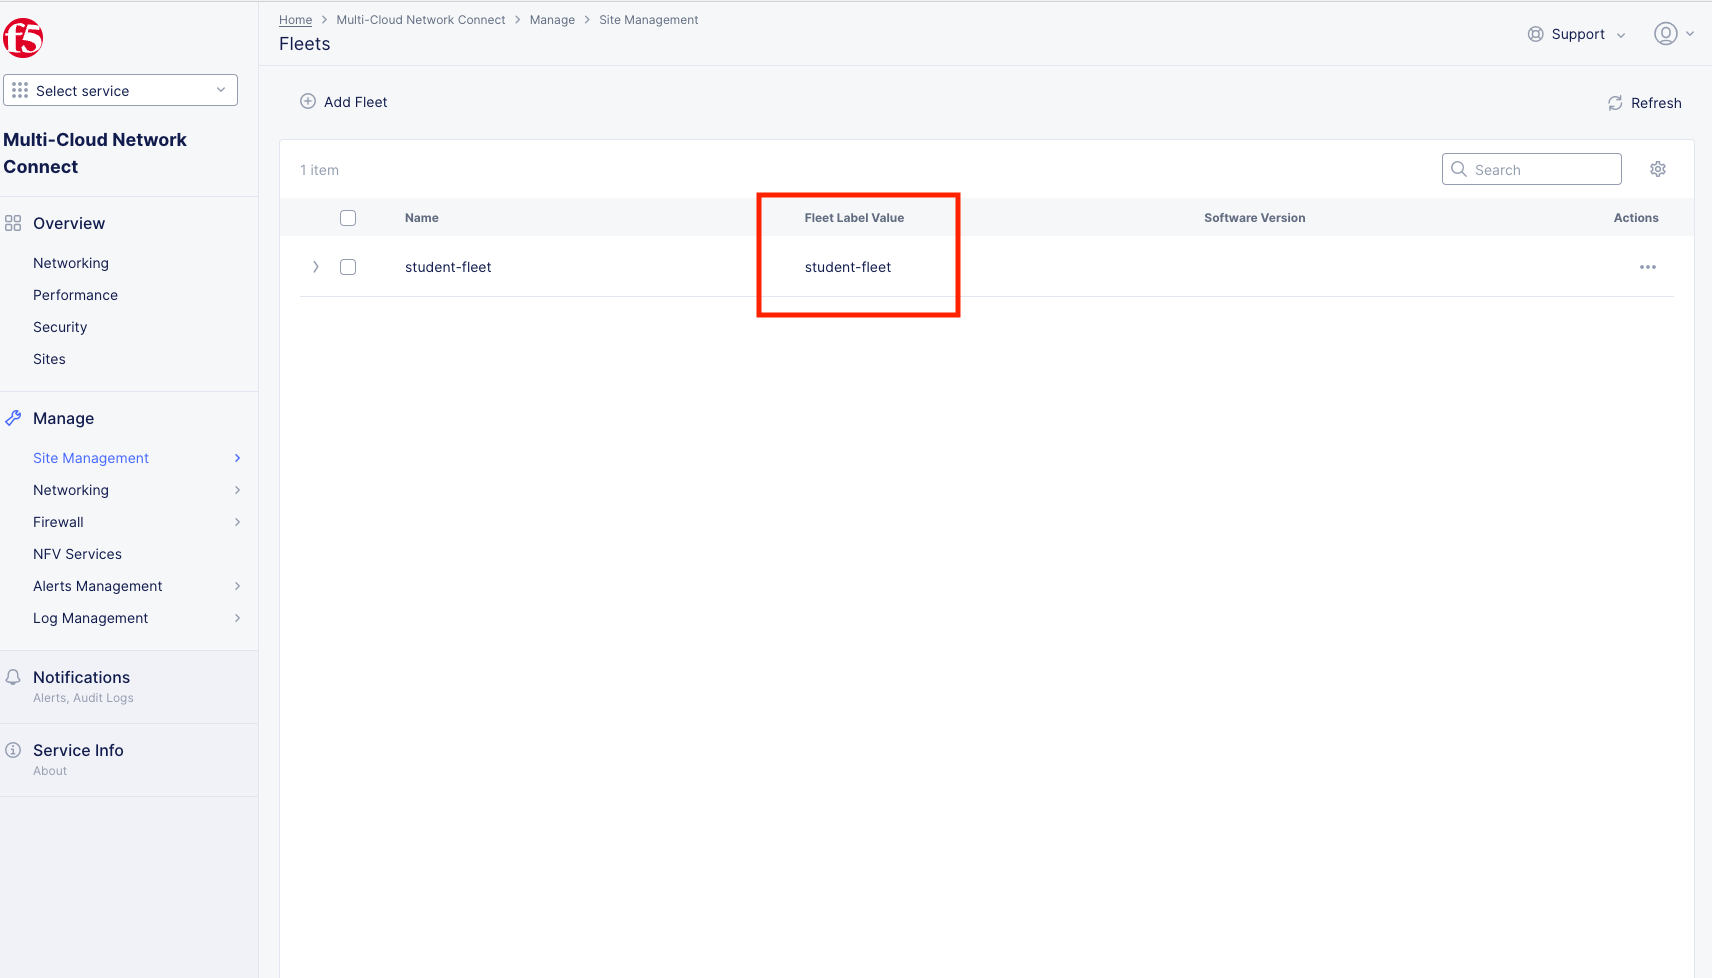
Note the Fleet Label Value of the student-fleet. The label is also named student-fleet.
Bringing up the Connection
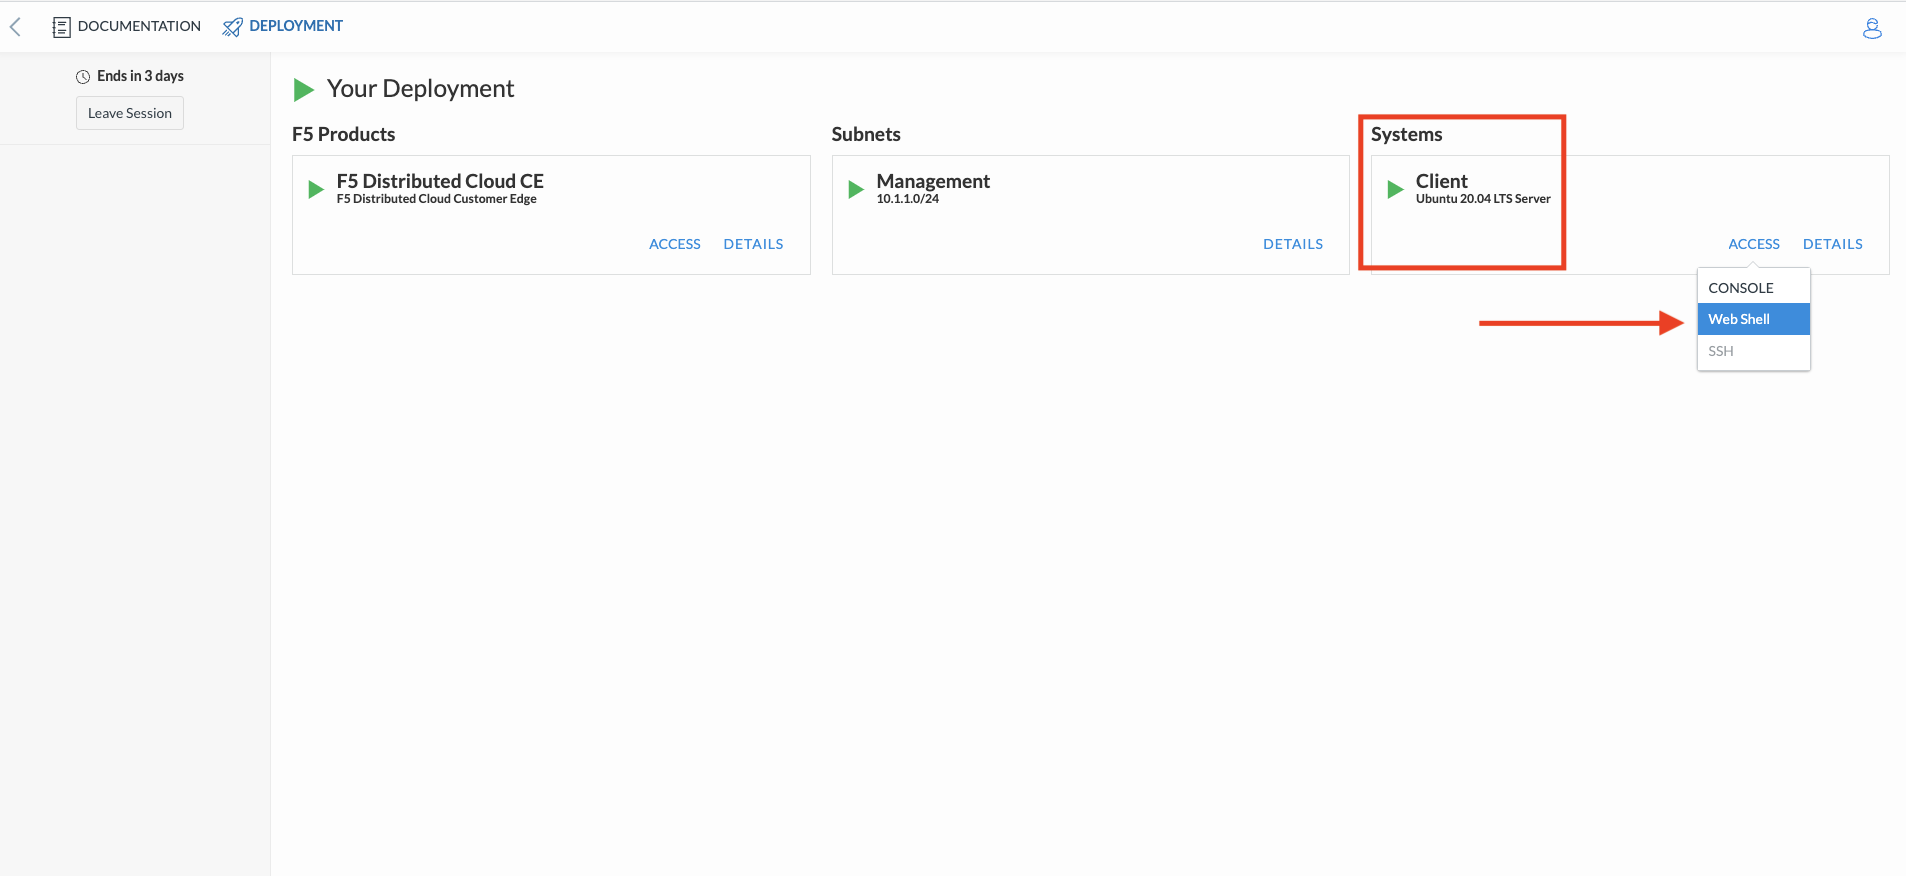
From your UDF environment browser tab, click on Access >> Web Shell on the Ubuntu Client. This will open a new tab to a Web Shell.
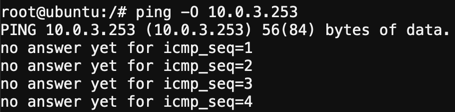
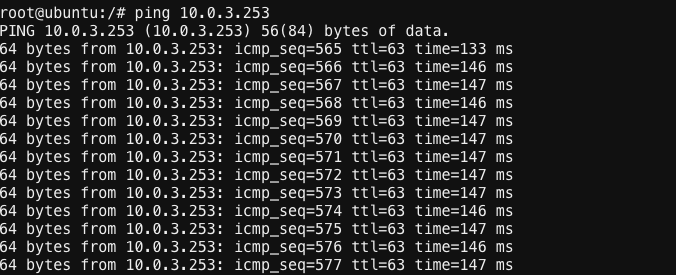
The workload in AWS has an IP address of 10.0.3.253
Type ping -O 10.0.3.253 and hit Enter. You WILL NOT get a response. Continue the ping in the steps below.
Note
-O is the uppercase letter “O”
Back in the XC Console, navigate to Multi-Cloud Network Connect >> Sites and find your “animal-name” Click the 3 buttons under the Action Menu under “your animal name” and select Manage Configuration.
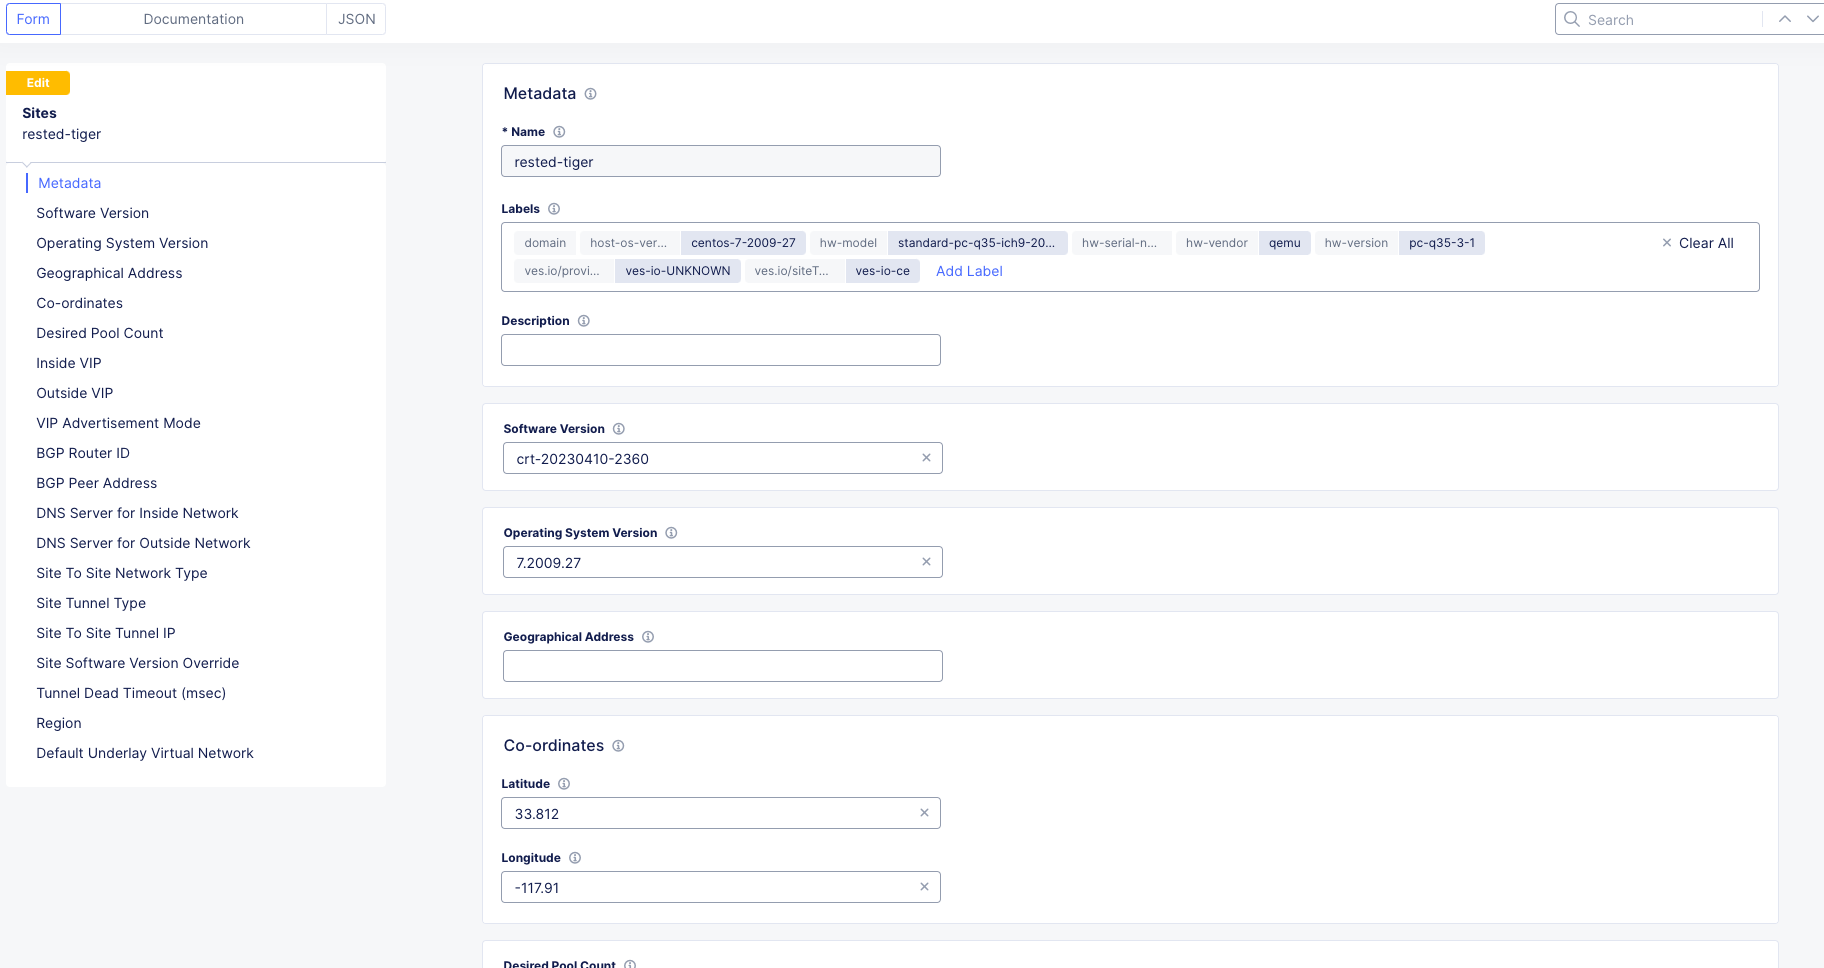
In the top right click Edit Configuration.
You should be here. We will be adding a Fleet Label to tag our CE Node into the fleet.
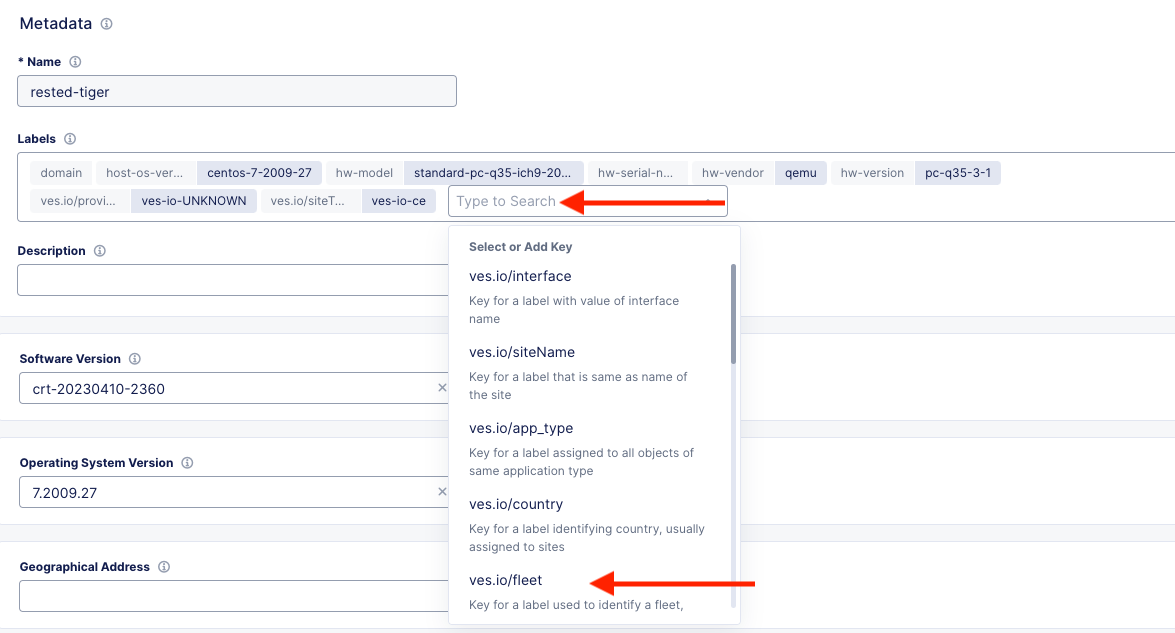
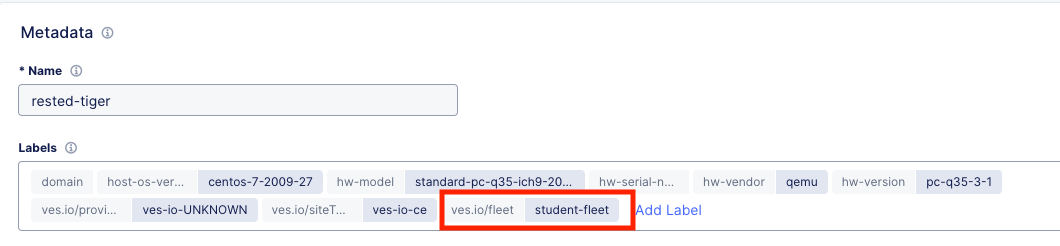
Click Add Label under the Labels section and select the label ves.io/fleet. For the value click on student-fleet, scroll down, Save and Exit.
It should look like this:
Check back on your web shell tab with the ping going. Success!!
Important
If you want to tear down this connectivity it is as easy as removing the label.
In XC Console, navigate to Multi-Cloud Network Connect >> Sites and click directly on your “animal-name” and finally click on the Tools menu on the top, far right.
Note
If you do not see the Tools menu there should be a right chevron “>” that will allow you to access additional menu items.
Click on Show Routes
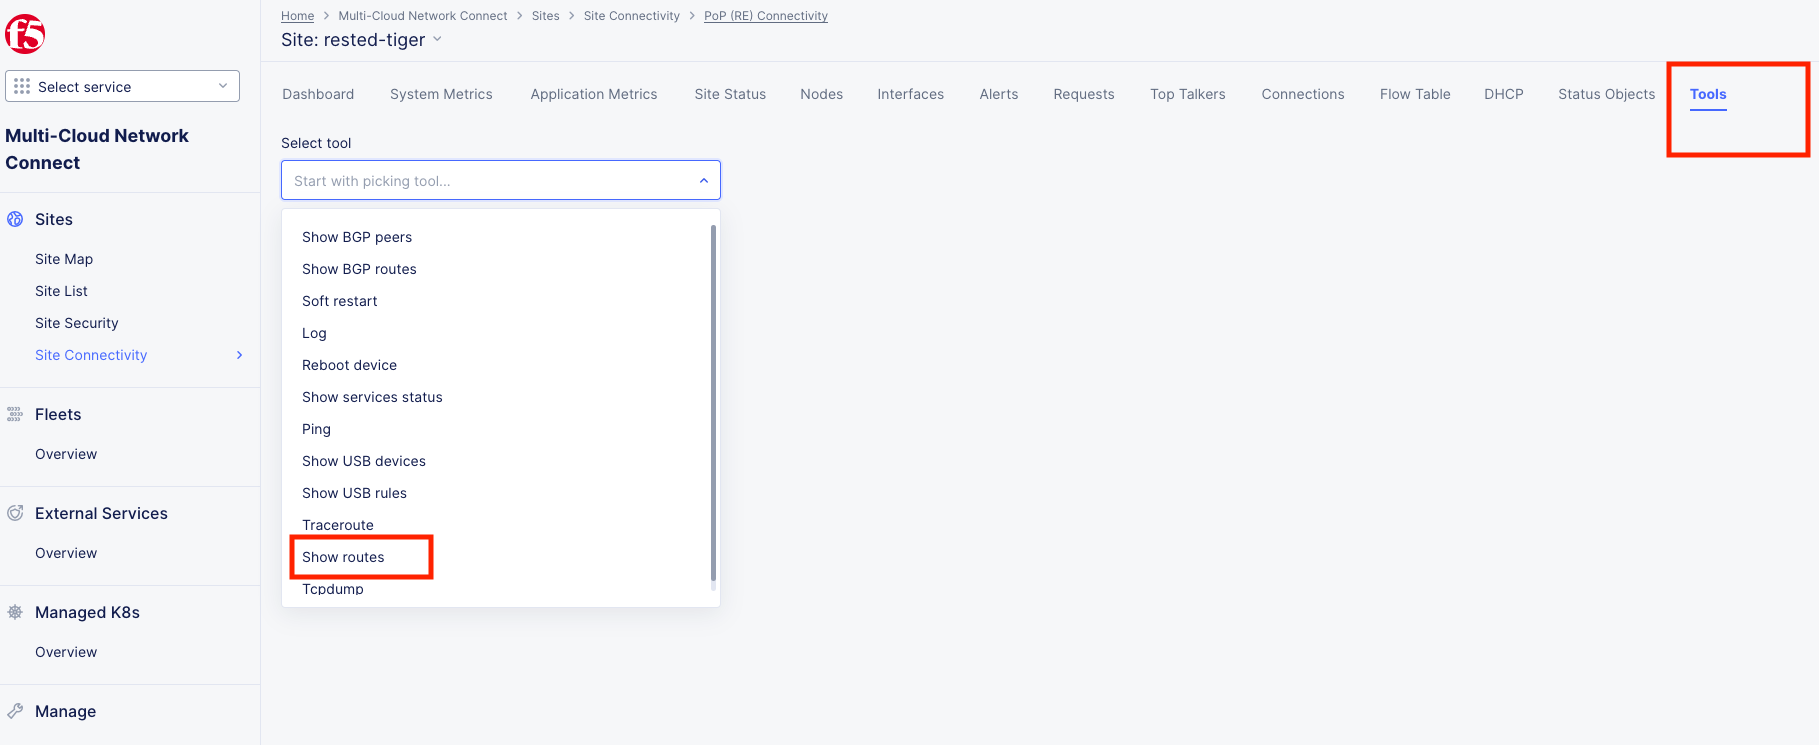
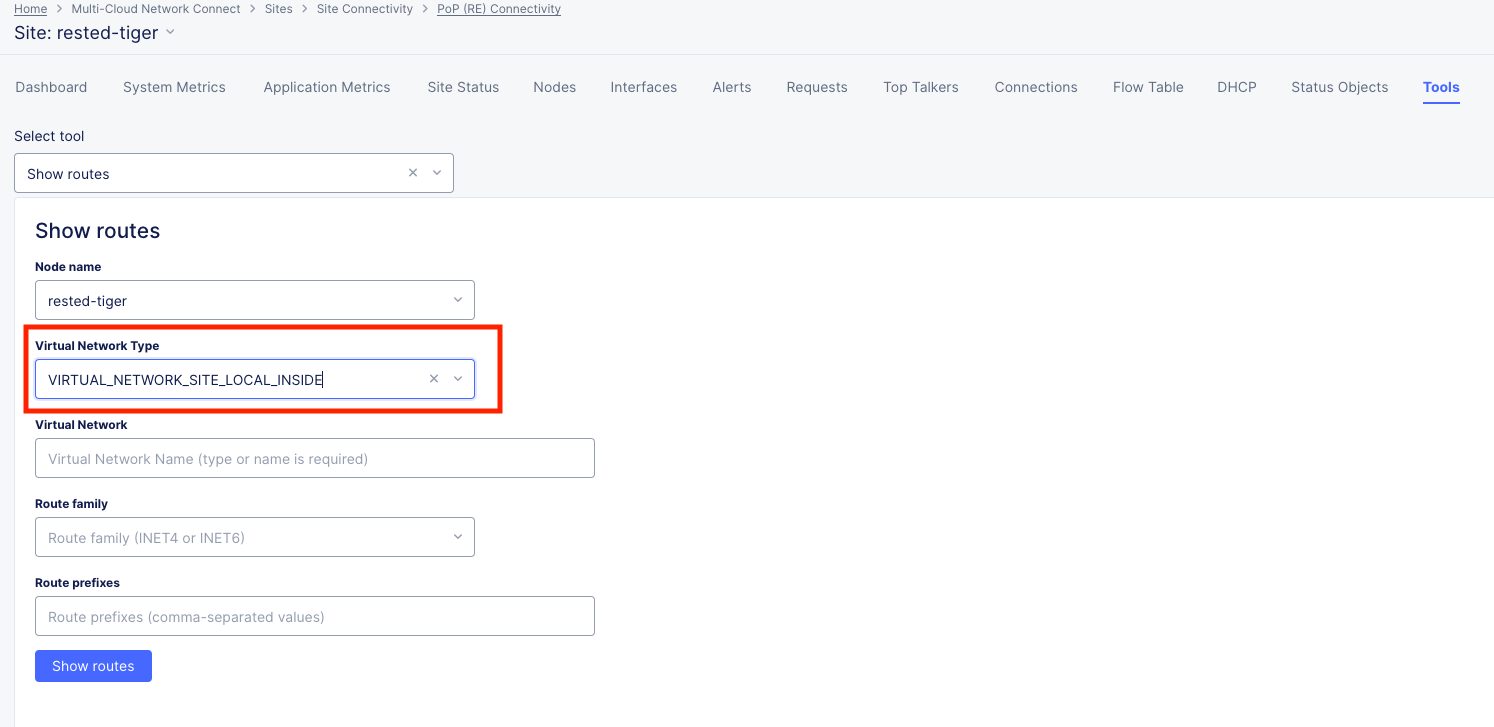
Set Virtual Network Type to: VIRTUAL_NETWORK_SITE_LOCAL_INSIDE and click the blue Show routes button
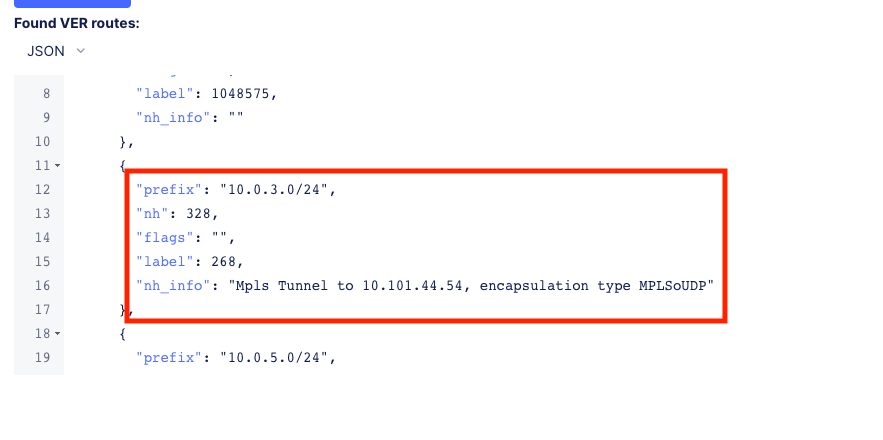
Scroll down to see the AWS subnet route “10.0.3.0/24 being advertised through the tunnel.
Routing is good, now let’s test some other ports. Go back to the web shell where you ran a ping. We will now test 2 ports that we know the server is listening on.
Port 80 - Simple Web page
Port 8080 - Diagnostic tool
Our first test will be to port 80. In the web shell type: curl --head http://10.0.3.253
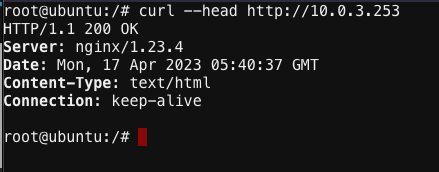
Next, push the keyboard “up arrow ” and run the same command but targeted at port 8080 like this: curl --head http://10.0.3.253:8080
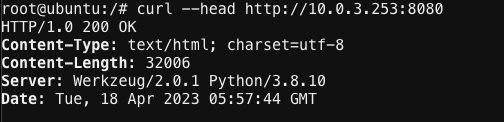
Important
If you are not getting a “200 OK” response, please see a lab assistant before moving on.
Note
We now have to close port 8080 per the ACME Corp security department requirement.
Enhanced Firewall Policy
You will now configure the F5 Distributed Cloud Enhanced Firewall to provide network security between these sites. Custom Enhanced Firewall policies make it possible to define intent-based rules, such as allowing only traffic to/from sites wit a specific label, like “ves.io/fleet in ‘student-fleet’”” in your deployed site above. Additional criteria for rules can include tags belonging to resources that live in public clouds, such as the AWS VPC name or any other discoverable attribute.
Note
Due to lab architecture, we will only be able to configure the policies but not apply. We will show you the final step to apply your policy for reference, but you will not actually be able to apply or test.
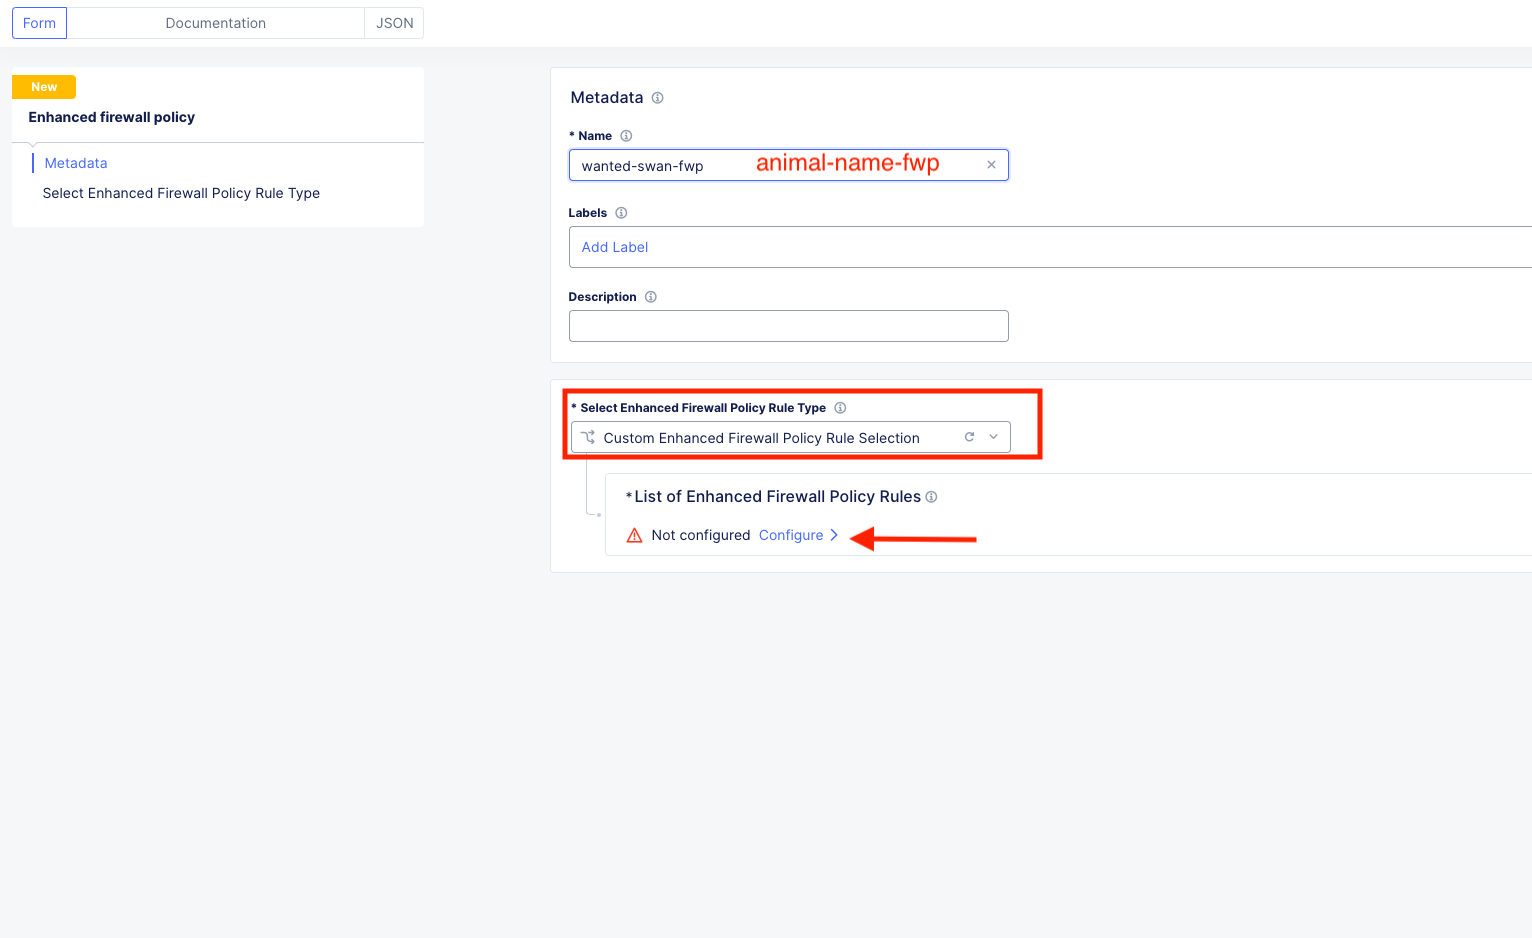
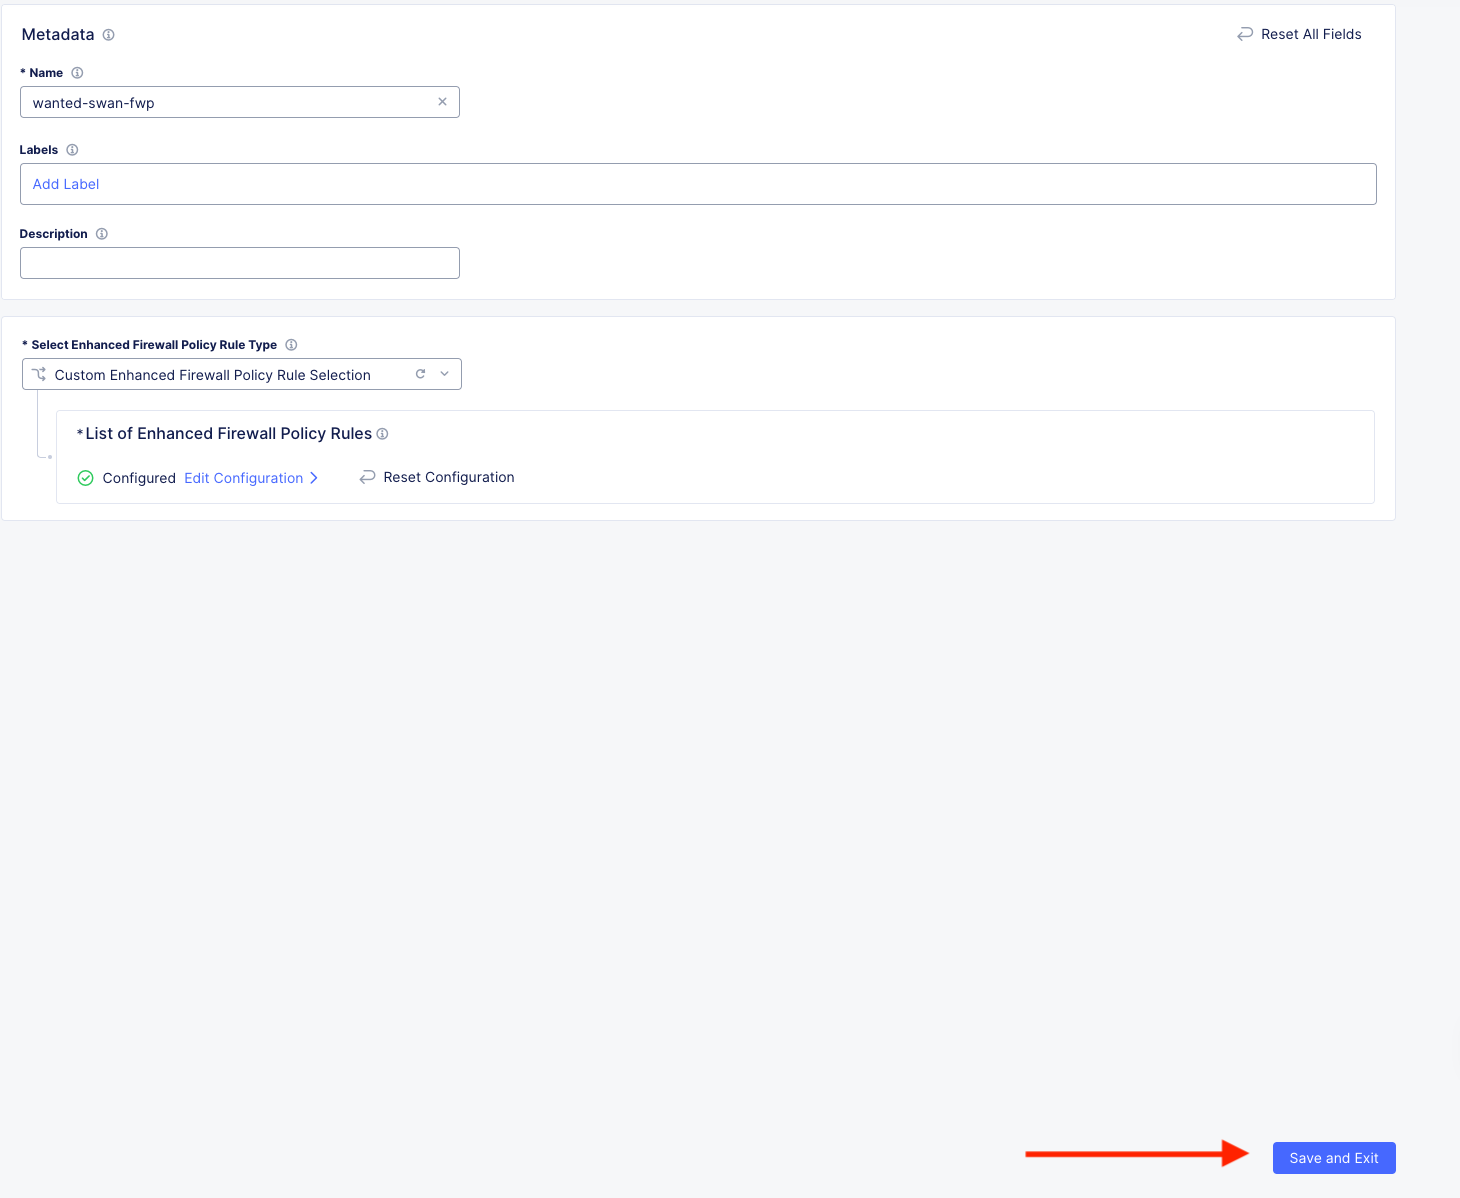
Navigate to Manage >> Firewall >> Enhanced Firewall Policies and click Add Enhanced Firewall Policy.
Variable |
Value |
|---|---|
Name |
[animal-name]-fwp |
Select Enhanced Firewall Policy Rule Type |
Custom Enhanced Firewall Policy Rule Selection |
Click the blue Configure hyperlink.
Click on Add Item to bring up the Rules creation screen. Here you will notice several powerful “Enhanced” Source and Destination Traffic filters.
Variable |
Value |
|---|---|
Name |
[animal-name]-allow-80 |
Source Traffic Filter |
IPv4 Prefix List >> Click Configure and add 10.1.1.0/24 then click Apply. |
Destination Traffic Filter |
IPv4 Prefix List >> Click Configure and add 10.0.3.0/24 then click Apply. |
Select Type of Traffic to Match |
Match Protocol and Port Ranges |
Match Protocol and Port Ranges |
TCP >> click Add Item and add 80. |
Action |
Allow |
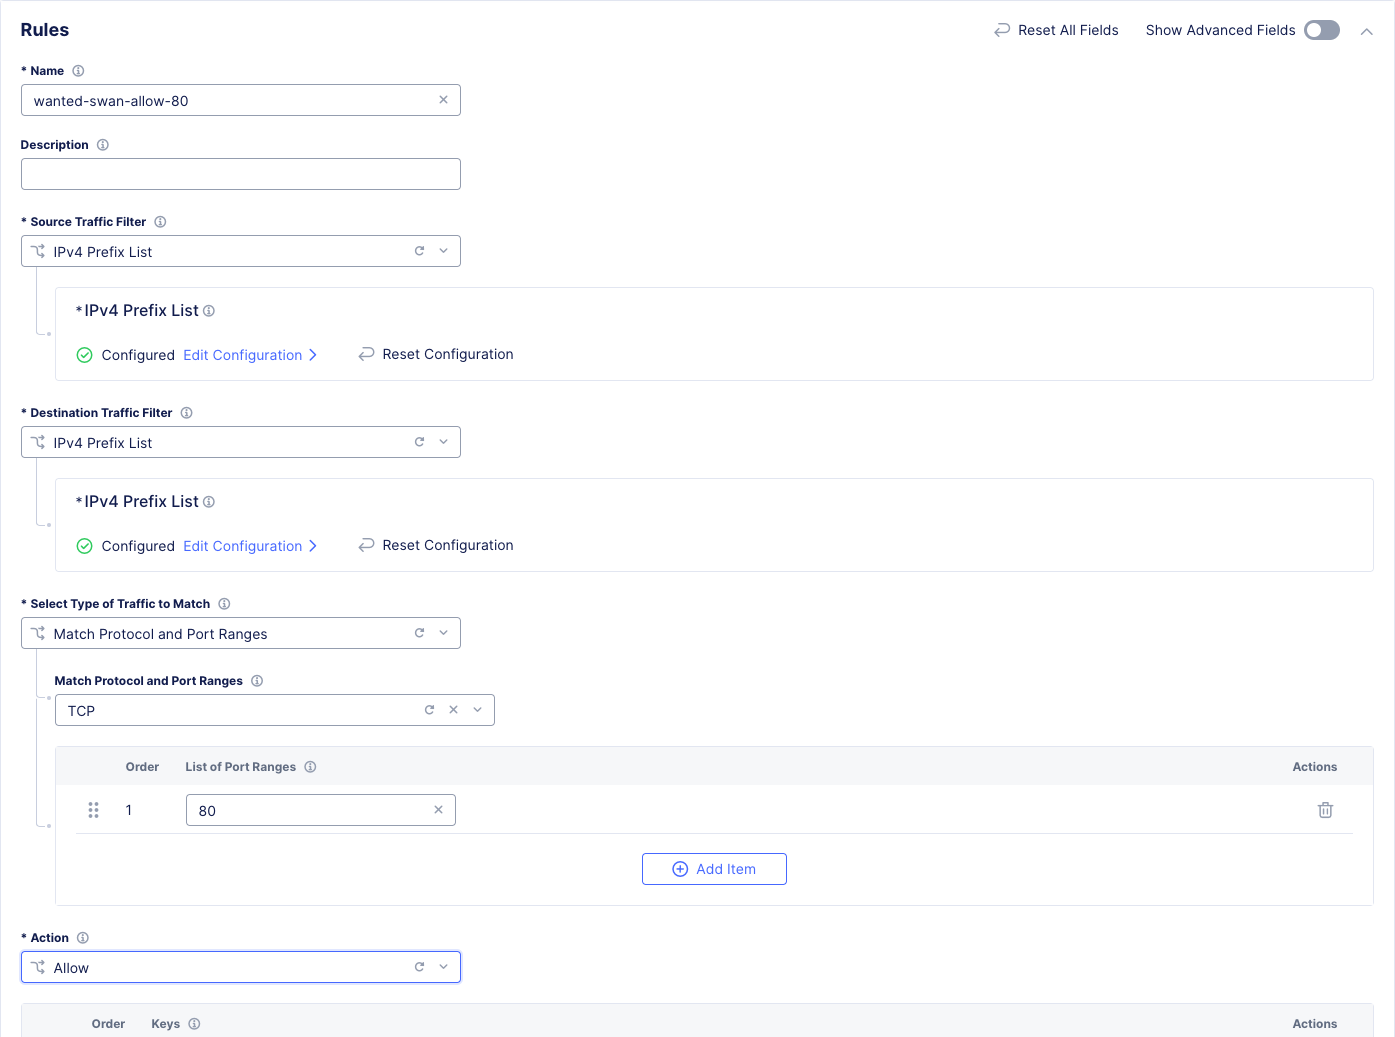
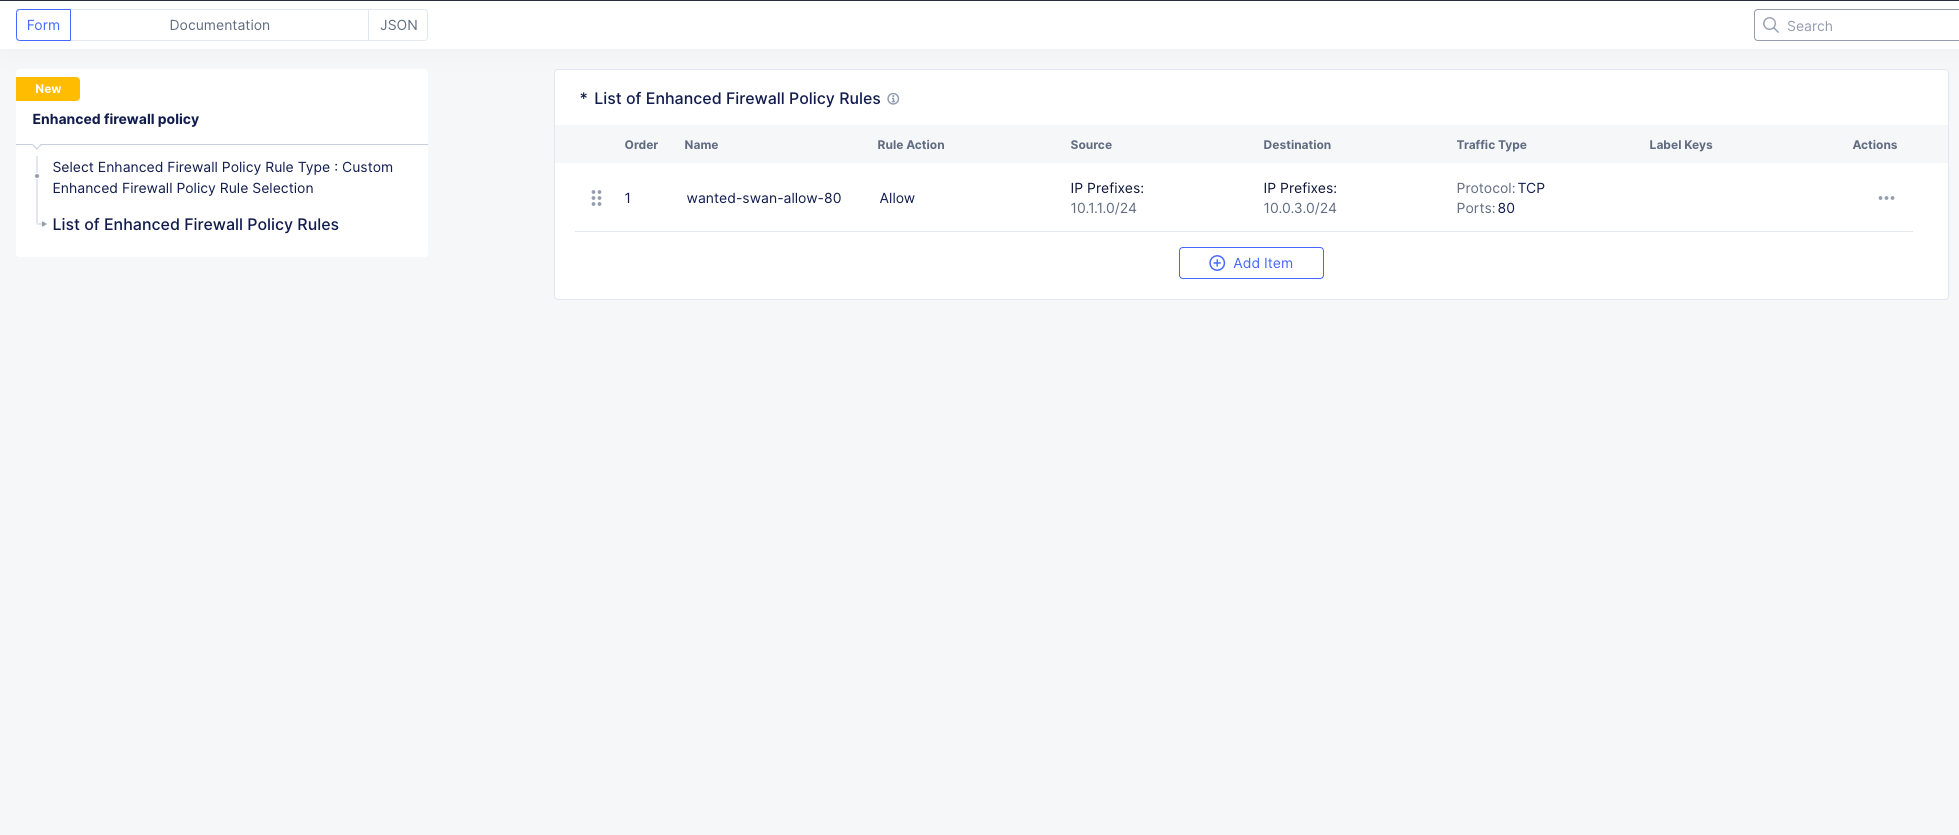
Click Apply and your screen should look like this:
Now we will create the default deny to prevent any other traffic between these two networks.
Click Add Item again to add another rule to the Enhanced Firewall Policy.
Variable |
Value |
|---|---|
Name |
[animal-name]-deny-all |
Source Traffic Filter |
IPv4 Prefix List >> Click Configure and add 10.1.1.0/24 then click Apply. |
Destination Traffic Filter |
IPv4 Prefix List >> Click Configure and add 10.0.3.0/24 then click Apply. |
Select Type of Traffic to Match |
Match All Traffic |
Action |
Deny |
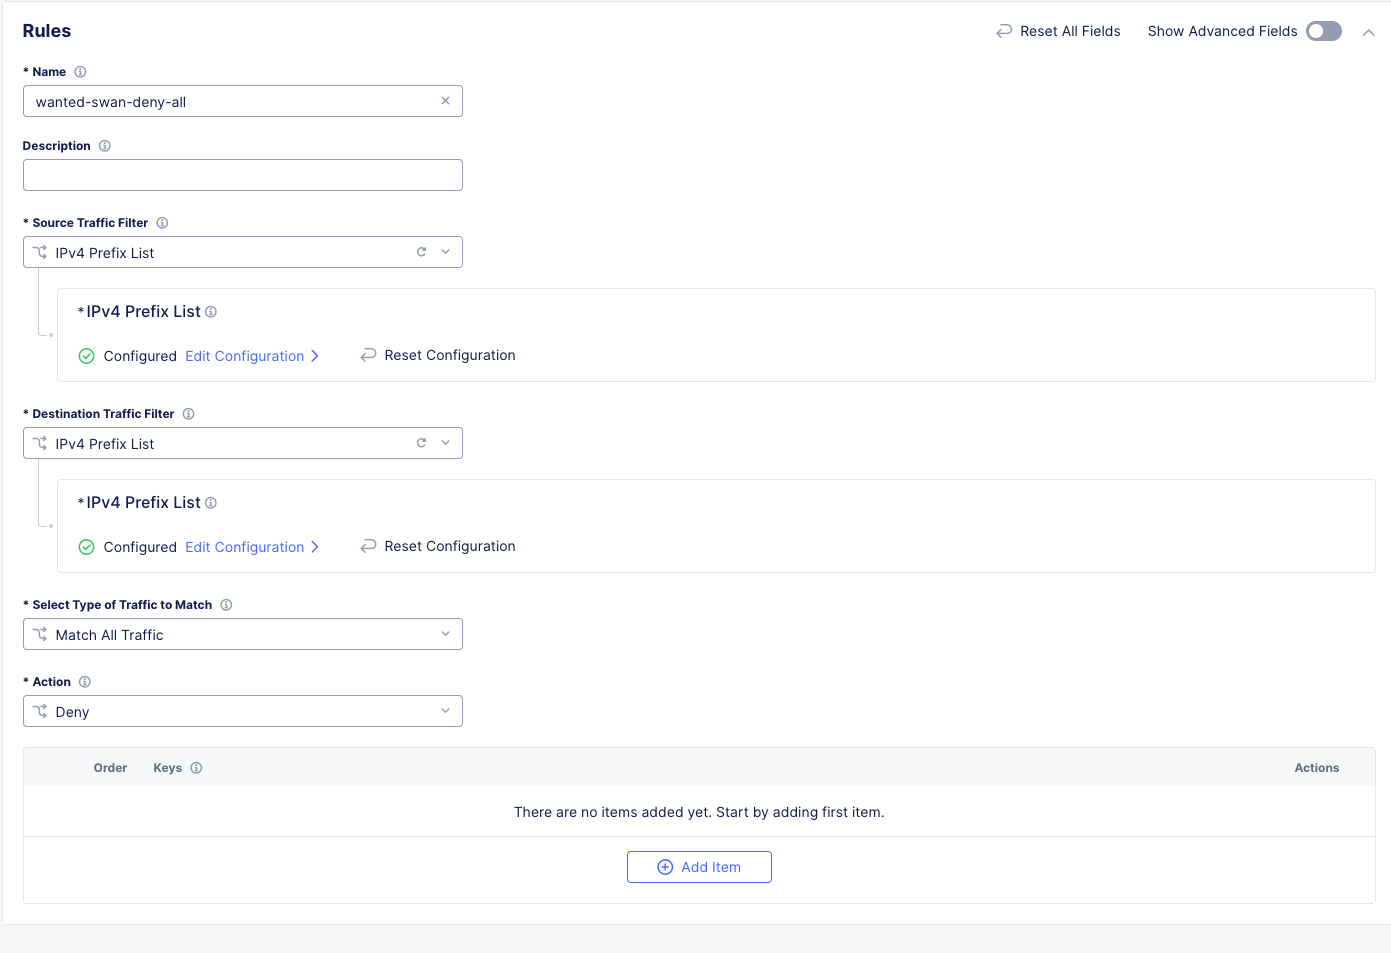
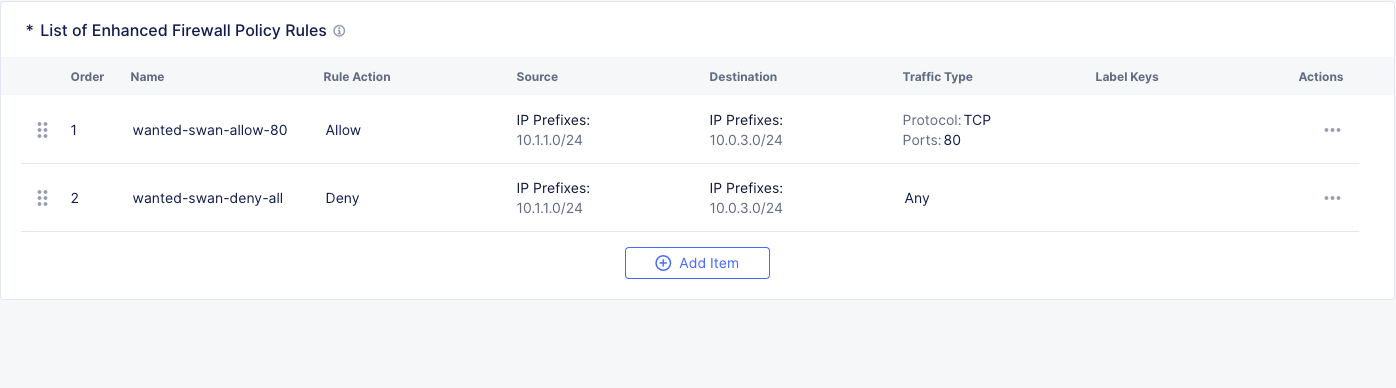
Click Apply and your screen should look like this:
Click Apply and Save and Exit.
Summary
You have now created the firewall policy necessary to secure these two networks. Outside of the lab environment you would now add this policy to the fleet by managing your fleet and adding an Enhanced Firewall policy.
Logging
Customers often ask about the logging options with F5 Distributed Cloud. There are two main options for logging.
Global Logging - Logging related to activities that occur within Distributed Cloud and on the Regional Edges such as load balancers or WAAP/Bot policy.
Site Local Logging - Logging related to activities that occur within the Customer Edge Boundary such as load balancers or WAAP/Bot policies runnning locally on an XC Node.
Note
This is the last “Read Only” lab section. Our apologies for the inconvenience.
Global Logging:
To observe (NOT configure) the Global Logging configuration options, in the side-menu, browse to Manage >> Log Management >> Global Log Receiver and click Add Global Log Receiver.
Take particular notice of the different Log Types and Receiver Configurations which include AWS, Azure and Splunk options to namedrop a few.
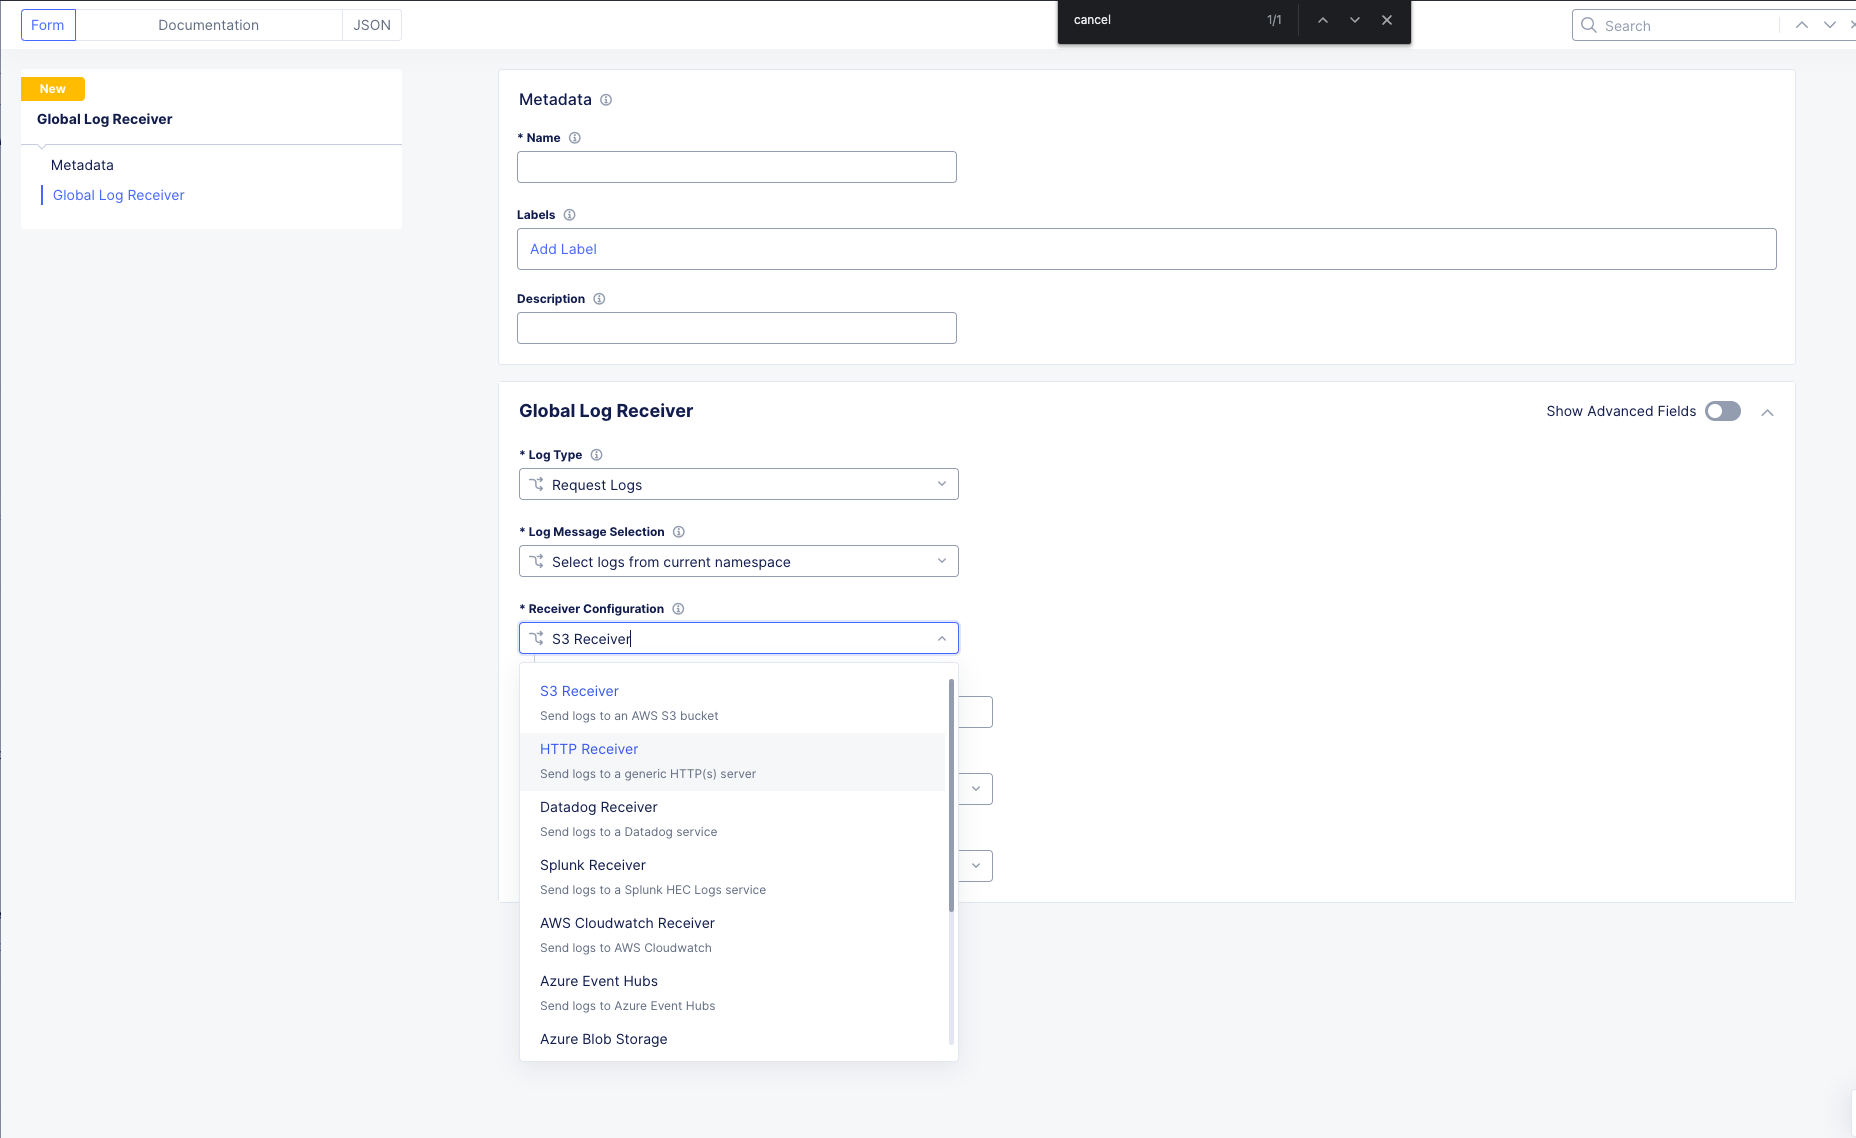
Click Cancel and Exit and Discard any changes.
Site Local Logging:
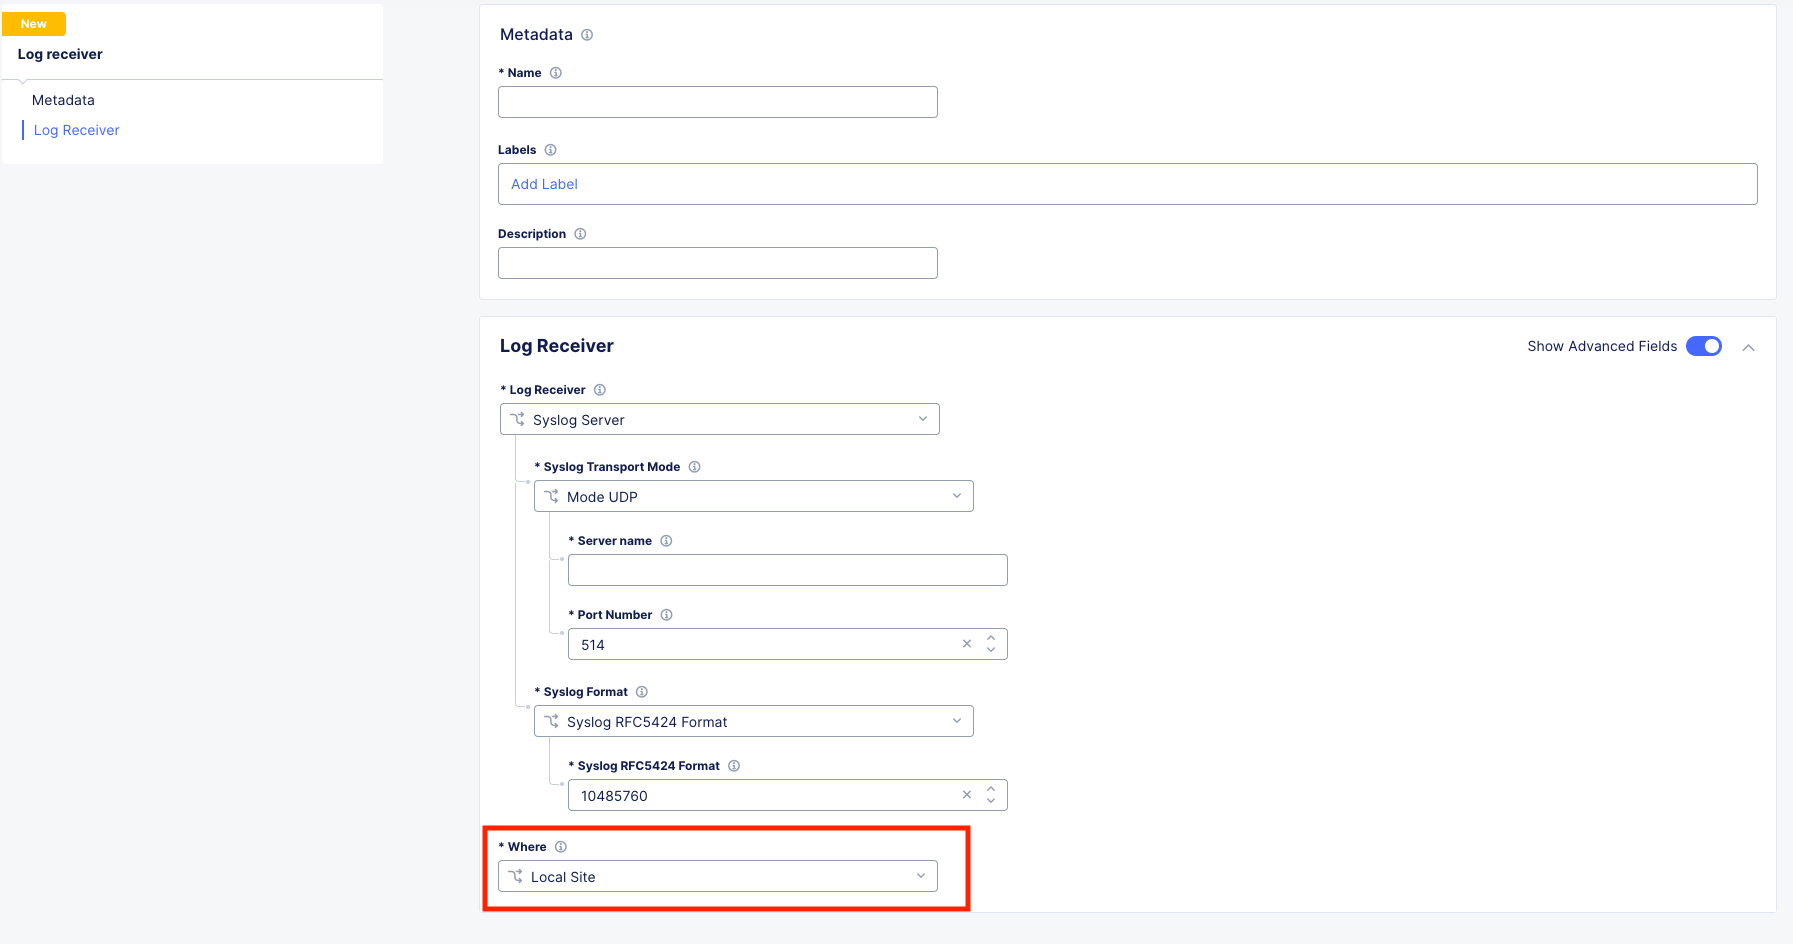
To observe (NOT configure) the Site Local Logging configuration options, in the side-menu, browse to Manage >> Log Management >> Log Receiver and click Add Log Receiver.
Click on the Show Advanced Fields button on the right and take note of the Where
Click Cancel and Exit and Discard any changes.
Applying Site Local Logging:
To observe (NOT configure) the application of the Site Local Logging profile, browse to Manage >> Site Management >> Fleets, click the 3 button Action menu and click Manage Configuration.
Scroll down to observe the Logs Streaming field under Advanced Configuration. Outside of the lab environment, you would enable this and select your Log Receiver profile.
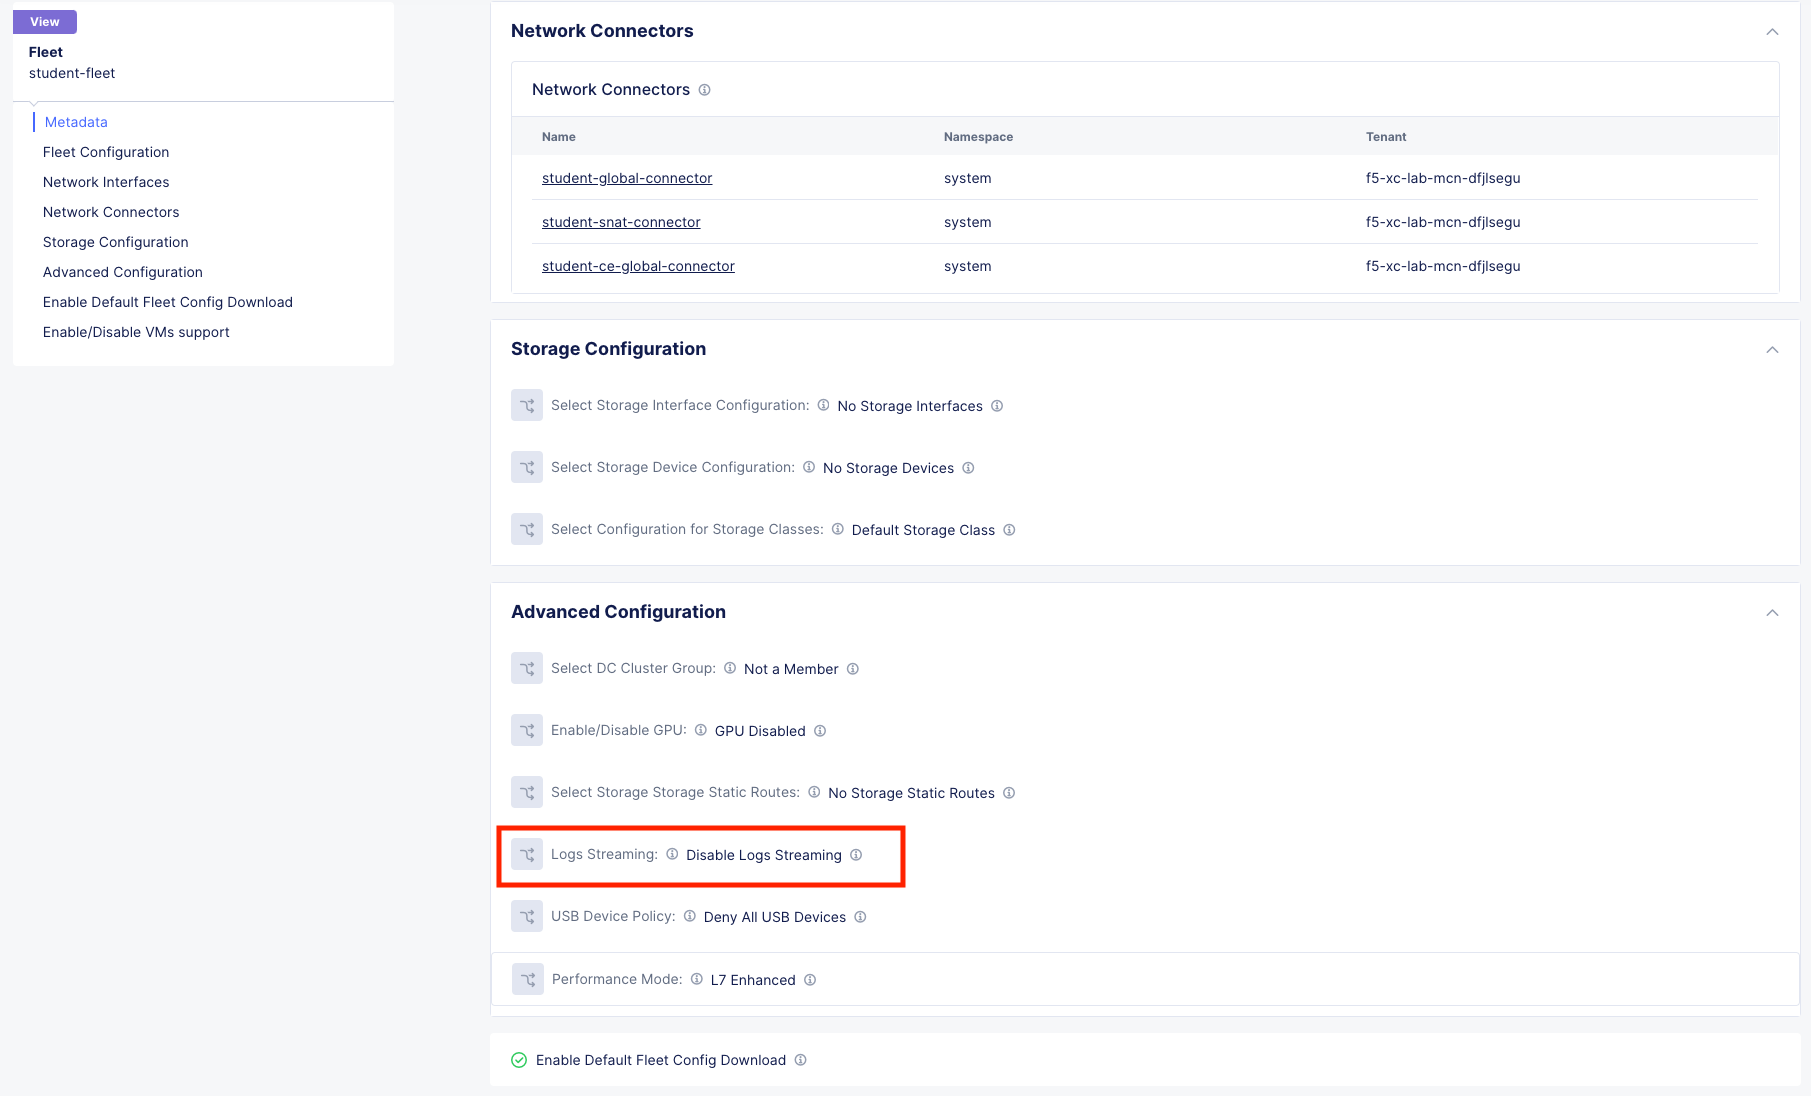
Click Cancel and Exit.
You can now feel free to explore the Multi-Cloud Network Connect Site menus while everyone is getting caught up.
Navigate to Overview > Sites and then to the tab view of Site Map to see an overview with the health of all deployed sites. For site security, navigate to Overview > Security > Firewall Events to review the firewall logs, and finally, go to the Service Info section at the bottom of the left-hand frame, and click on About to learn more about Network Connect.