NGINX Modern Apps > Class 1 - Intro to NGINX Plus > Module 3: Introduction to the NGINX Plus API Source | Edit on
NGINX Plus API Live Monitoring
Introduction
The NGINX Plus API supports other features in addition to live activity monitoring, including dynamic configuration of upstream server groups and key-value stores.
Live examples:
- A sample configuration file for the NGINX Plus API
- Live dashboard example: demo.nginx.com
- Raw JSON output: demo.nginx.com/api
- Swagger-UI: demo.nginx.com/swagger-ui
- API YAML: demo.nginx.com/swagger-ui/nginx_api.yaml
Learning Objectives
By the end of the lab you will be able to:
- Use demo.nginx.com for demo purposes
- Use the NGINX Plus API to read live monitoring metrics on NGINX Plus
- Interact with the NGINX Plus API using both Postman and cURL
Exercise 1: Explore the Live Activity Monitoring JSON Feed from demo.nginx.com using Postman:
When you access the API, NGINX Plus returns a JSON formatted document containing the current statistics. You can request complete statistics at /api/[api-version]/, where [api-version] is the version number of the NGINX Plus API.
Lets look at the Live Activity Monitoring JSON Feed in detail.
In this section, we will use Postman to interact with the NGINX API. In the Optional section below, we can reproduce the same steps using curl
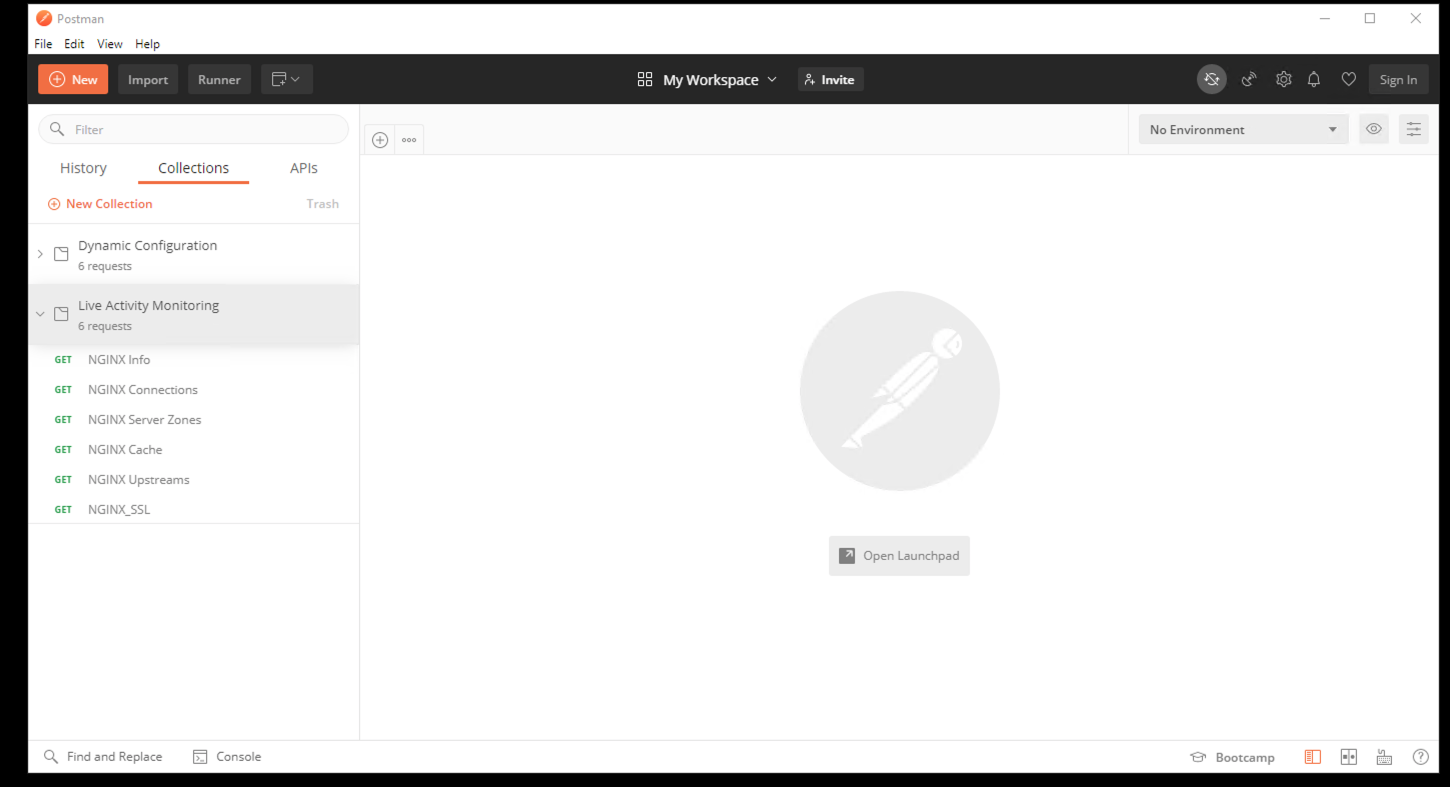
Open Postman using the shortcut found on the desktop. If prompted to update Postman click on Dismiss.
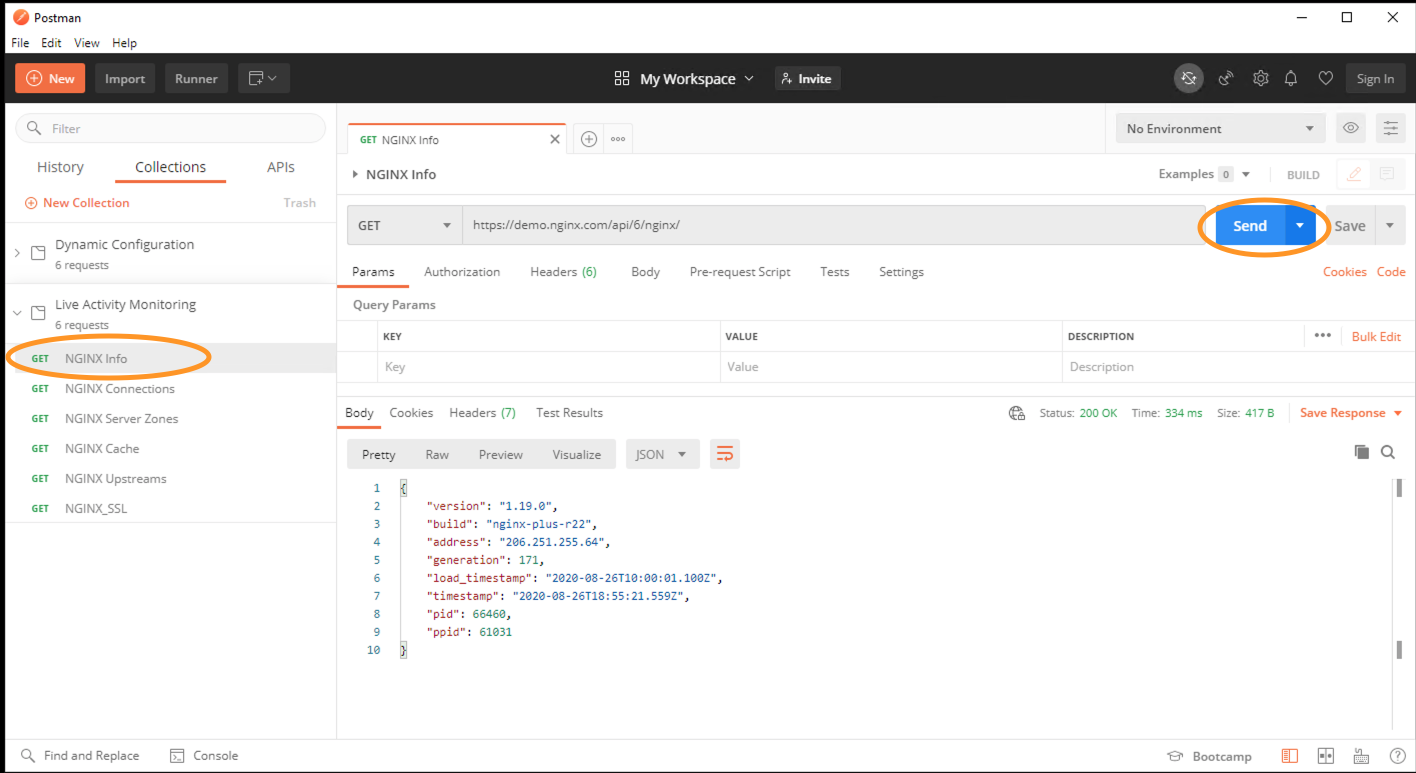
Within the Live Activity Monitoring collection, click on the NGINX Info request and then click on the Send button. The /api/api-version/nginx/ API endpoint is used to retrieve basic version, uptime, and identification information.
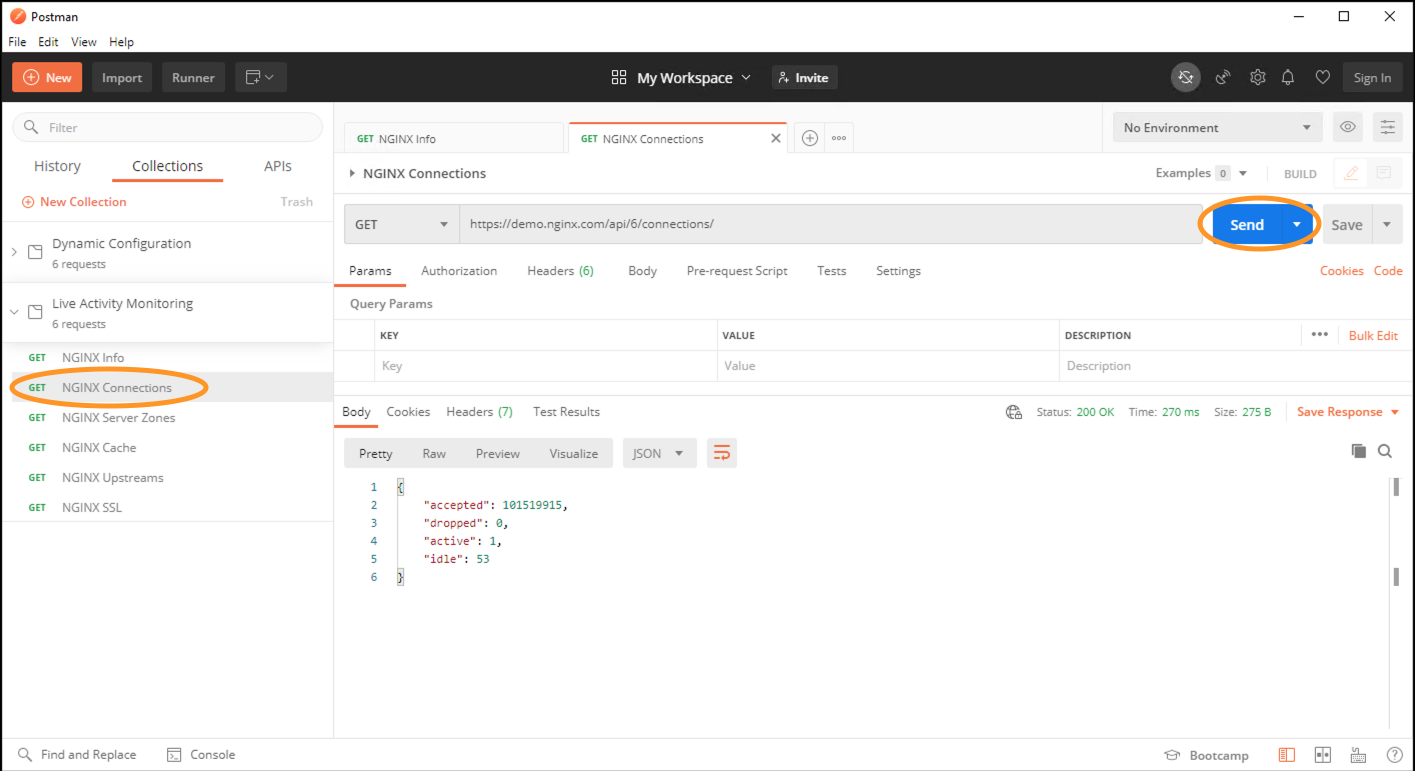
Next click on NGINX Connections request and then click on the Send button. The /api/api-version/connections/ API endpoint is used to retrieve total active and idle connections.
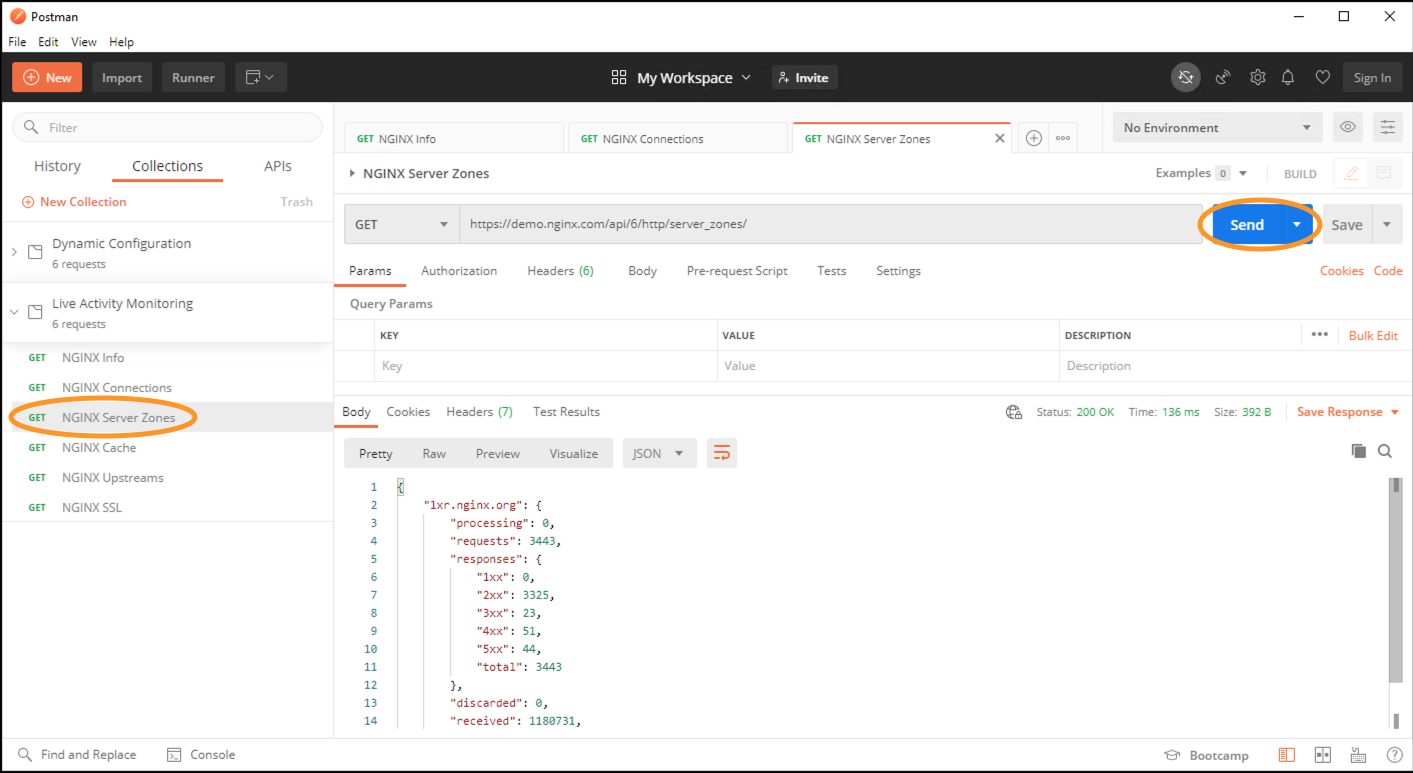
Click on the NGINX Server Zones request and then click on the Send button. The /api/api-version/http/server_zones/ API endpoint is used to retrieve request and response counts for each HTTP status zone.
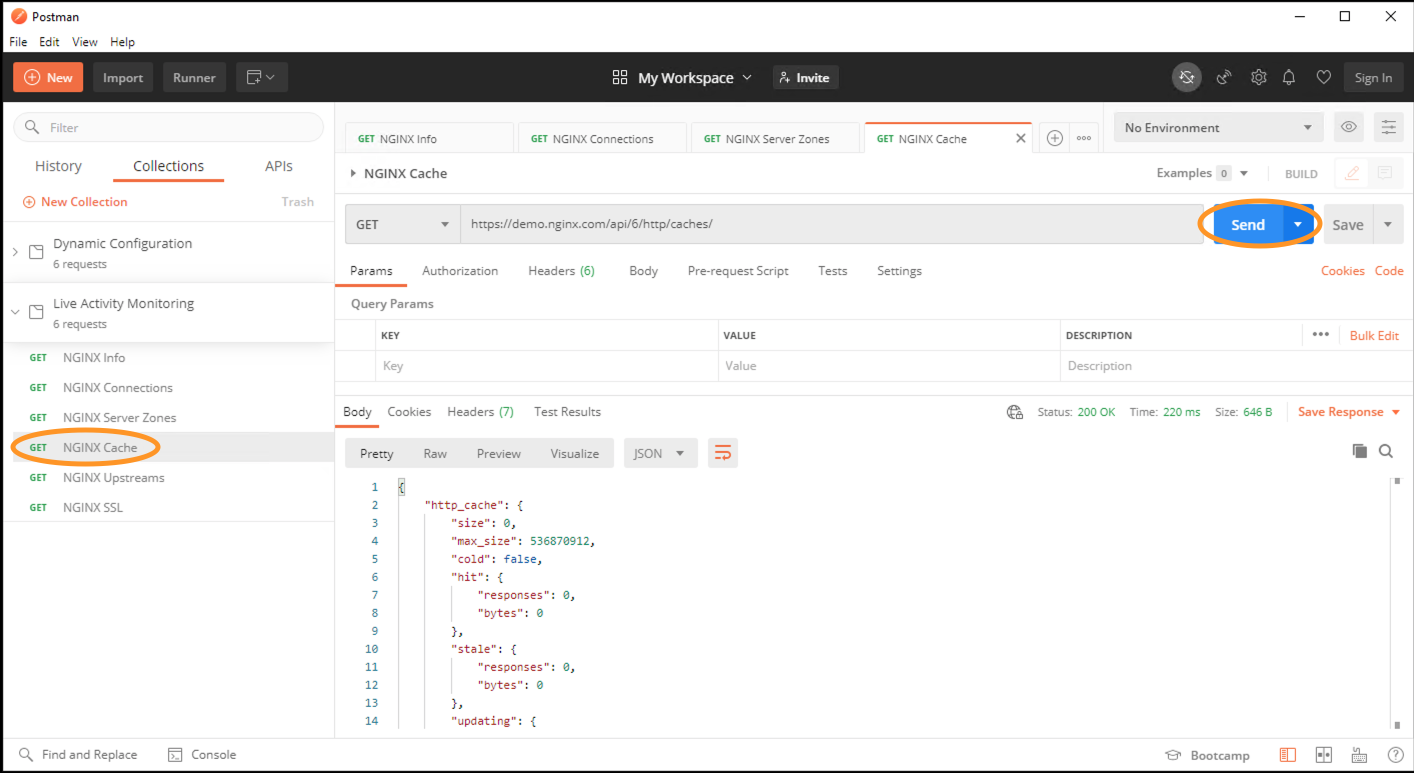
Click on the NGINX Cache request and then click on the Send button. The /api/api-version/http/caches/ API endpoint is used to retrieve instrumentation for each named cache zone.
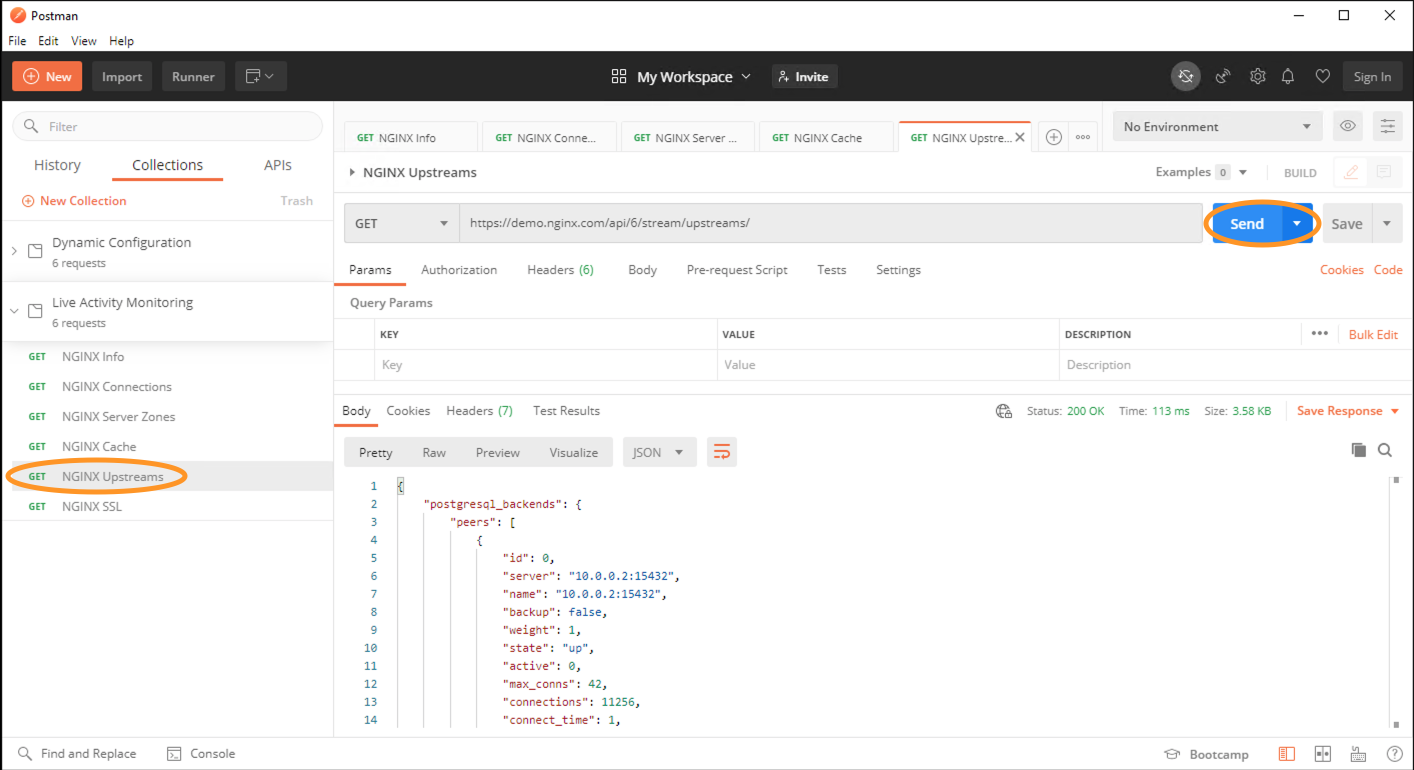
Click on the NGINX Upstreams request and then click on the Send button. The /api/api-version/stream/upstreams/ API endpoint is used to retrieve request and response counts, response time, health-check status, and uptime statistics per server in each TCP/UDP upstream group.
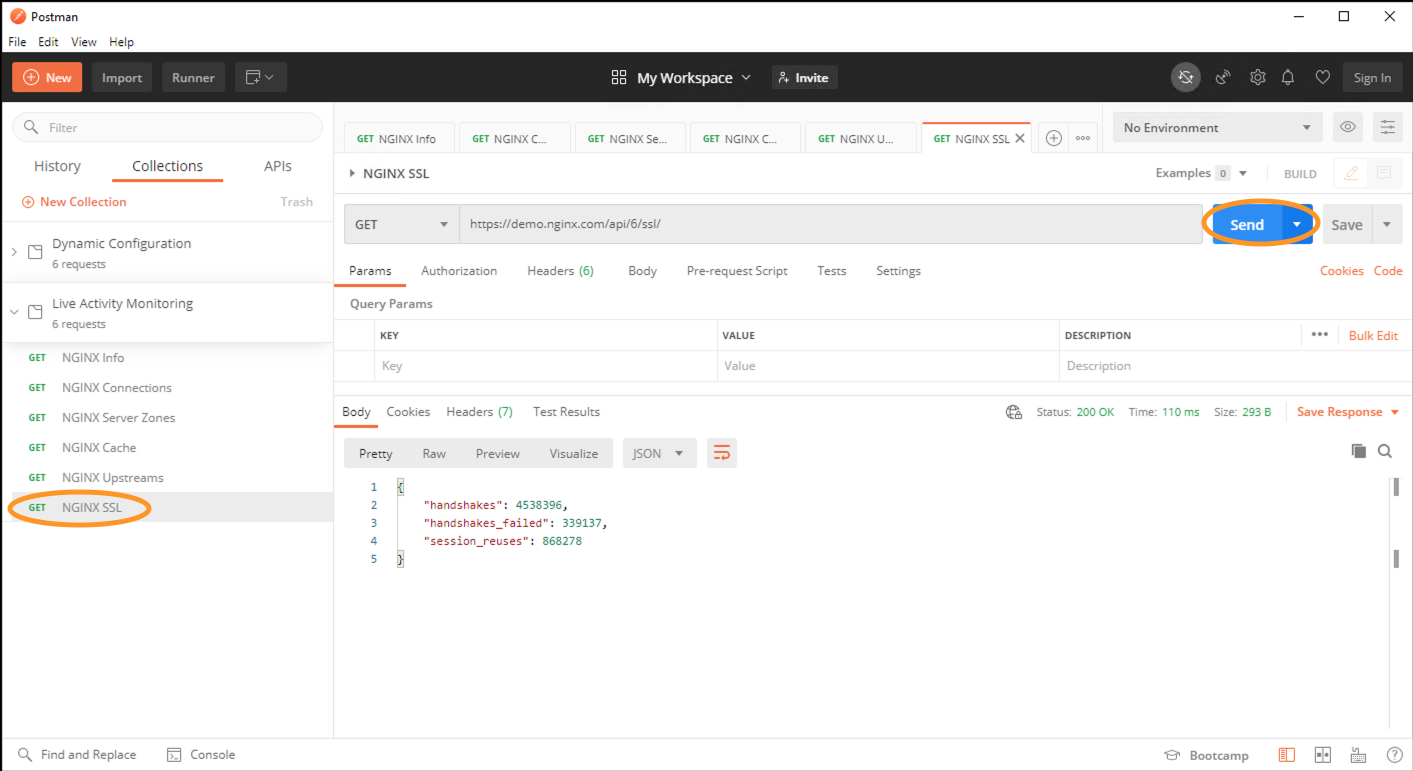
Click on the NGINX SSL request and then click on the Send button. The /api/api-version/ssl/ API endpoint is used to retrieve SSL/TLS statistics.
Optional: Explore the Live Activity Monitoring JSON Feed from demo.nginx.com using cURL:
In this section, we will use curl to interact with the NGINX API.
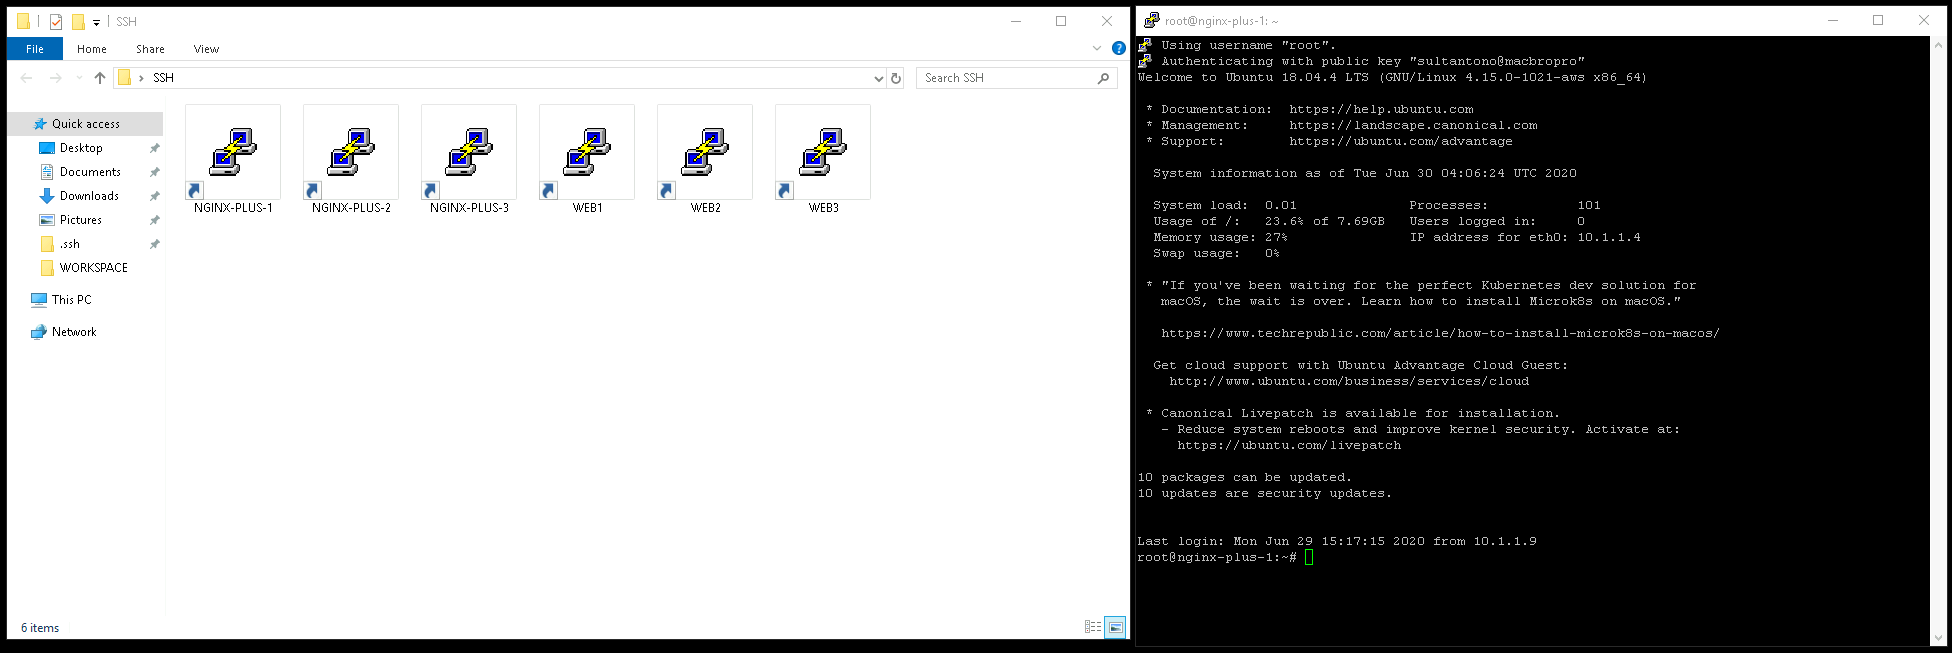
In the SSH folder found on the desktop, open the NGINX-PLUS-1 session.
Attention
If you receive the PuTTY Seurity Alert click Yes to continue
In the Terminal Window, using curl and jq for JSON formatting, make a request to the API endpoint, /api/api-version/nginx/ to retrieve basic version, uptime, and identification information.
curl -s https://demo.nginx.com/api/6/nginx/ | jq

Note
You should see output similar to the following
{
  "version": "1.19.0",
  "build": "nginx-plus-r22",
  "address": "206.251.255.64",
  "generation": 55,
  "load_timestamp": "2020-06-30T03:00:00.120Z",
  "timestamp": "2020-06-30T04:09:57.399Z",
  "pid": 24706,
  "ppid": 61031
}
Using curl and jq, make a request to the API endpoint, /api/api-version/connections/ to retrieve total active and idle connections.
curl -s https://demo.nginx.com/api/6/connections/ | jq
Note
You should see output similar to the following
{
  "accepted": 32284461,
  "dropped": 0,
  "active": 1,
  "idle": 55
}
Using curl and jq, make a request to the API endpoint, /api/api-version/http/server_zones/ to retrieve request and response counts for each HTTP status zone.
curl -s https://demo.nginx.com/api/6/http/server_zones/ | jq
Note
You should see output similar to the following
{
    "hg.nginx.org": {
        "processing": 0,
        "requests": 0,
        "responses": {
            "1xx": 0,
            "2xx": 0,
            "3xx": 0,
            "4xx": 0,
            "5xx": 0,
            "total": 0
        },
        "discarded": 0,
        "received": 0,
        "sent": 0
    },
    "trac.nginx.org": {
        "processing": 0,
        "requests": 0,
        "responses": {
            "1xx": 0,
            "2xx": 0,
            "3xx": 0,
            "4xx": 0,
            "5xx": 0,
            "total": 0
        },
        "discarded": 0,
        "received": 0,
        "sent": 0
    },
    "lxr.nginx.org": {
        "processing": 0,
        "requests": 2635,
        "responses": {
            "1xx": 0,
            "2xx": 2505,
            "3xx": 17,
            "4xx": 76,
            "5xx": 37,
            "total": 2635
        },
        "discarded": 0,
        "received": 856154,
        "sent": 62626264
    }
}
Using curl and jq, make a request to the API endpoint, /api/api-version/http/caches/ to retrieve instrumentation for each named cache zone
curl -s https://demo.nginx.com/api/6/http/caches/ | jq
Note
You should see output similar to the following
{
  "http_cache": {
    "size": 0,
    "max_size": 536870912,
    "cold": false,
    "hit": {
      "responses": 0,
      "bytes": 0
    },
    "stale": {
      "responses": 0,
      "bytes": 0
    },
    "updating": {
      "responses": 0,
      "bytes": 0
    },
    "revalidated": {
      "responses": 0,
      "bytes": 0
    },
    "miss": {
      "responses": 0,
      "bytes": 0,
      "responses_written": 0,
      "bytes_written": 0
    },
    "expired": {
      "responses": 0,
      "bytes": 0,
      "responses_written": 0,
      "bytes_written": 0
    },
    "bypass": {
      "responses": 0,
      "bytes": 0,
      "responses_written": 0,
      "bytes_written": 0
    }
  }
}
Using curl and jq, make a request to the API endpoint, /api/api-version/stream/upstreams/ to retrieve request and response counts, response time, health-check status, and uptime statistics per server in each TCP/UDP upstream group
curl -s https://demo.nginx.com/api/6/stream/upstreams/ | jq
Note
You should see output similar to the following
{
  "postgresql_backends": {
    "peers": [
      {
        "id": 0,
        "server": "10.0.0.2:15432",
        "name": "10.0.0.2:15432",
        "backup": false,
        "weight": 1,
        "state": "up",
        "active": 0,
        "max_conns": 42,
        "connections": 9250,
        "connect_time": 1,
        "first_byte_time": 1,
        "response_time": 1,
        "sent": 952750,
        "received": 1850000,
        "fails": 0,
        "unavail": 0,
        "health_checks": {
          "checks": 5564,
          "fails": 0,
          "unhealthy": 0,
          "last_passed": true
        },
        "downtime": 0,
        "selected": "2020-06-23T17:43:55Z"
      },
      {
        "id": 1,
        "server": "10.0.0.2:15433",
        "name": "10.0.0.2:15433",
        "backup": false,
        "weight": 1,
        "state": "up",
        "active": 0,
        "connections": 9250,

       }
Using curl and jq, make a request to the API endpoint, /api/api-version/ssl/ to retrieve SSL/TLS statistics
curl -s https://demo.nginx.com/api/6/ssl/ | jq
Note
You should see output similar to the following
{
  "handshakes": 784975,
  "handshakes_failed": 70687,
  "session_reuses": 122210
}