NGINX Modern Apps > Class 18 - Mastering cloud-native app delivery: Unlocking advanced capabilities and use cases with F5’s ADCaaS (NGINXaaS) Source | Edit on
Module 3:Azure Montoring / Logging Analytics
Introduction
In this lab, you will explore Azure based monitoring and Logging capabilities. You will create the basic access log_format within NGINX for Azure resource. As the basic log_format only contains a fraction of the information, you will then extend it and create a new log_format to include much more information, especially about the Upstream backend servers. You will add access logging to your NGINX for Azure resource and finally capture/see those logs within Azure monitoring tools.
| NGINX aaS | Docker |
|---|---|
 |
 |
Learning Objectives
By the end of the lab you will be able to:
- Enable basic log format within NGINX for Azure resource
- Create enhance log format with additional logging metrics
- Test access logs within log analytics workspace
- Explore Azure Monitoring for NGINX for Azure
Pre-Requisites
- Within your NGINX for Azure resource, you must have enabled sending metrics to Azure monitor.
- You must have created
Log Analytics workspace. - You must have created an Azure diagnostic settings resource that will stream the NGINX logs to the Log Analytics workspace.
- See
Lab1for instructions if you missed any of the above steps.
Enable basic log format
Within Azure portal, open your resource group and then open your NGINX for Azure resource (nginx4a). From the left pane click on
Settings > NGINX Configuration. This should open the configuration editor section. Opennginx.conffile.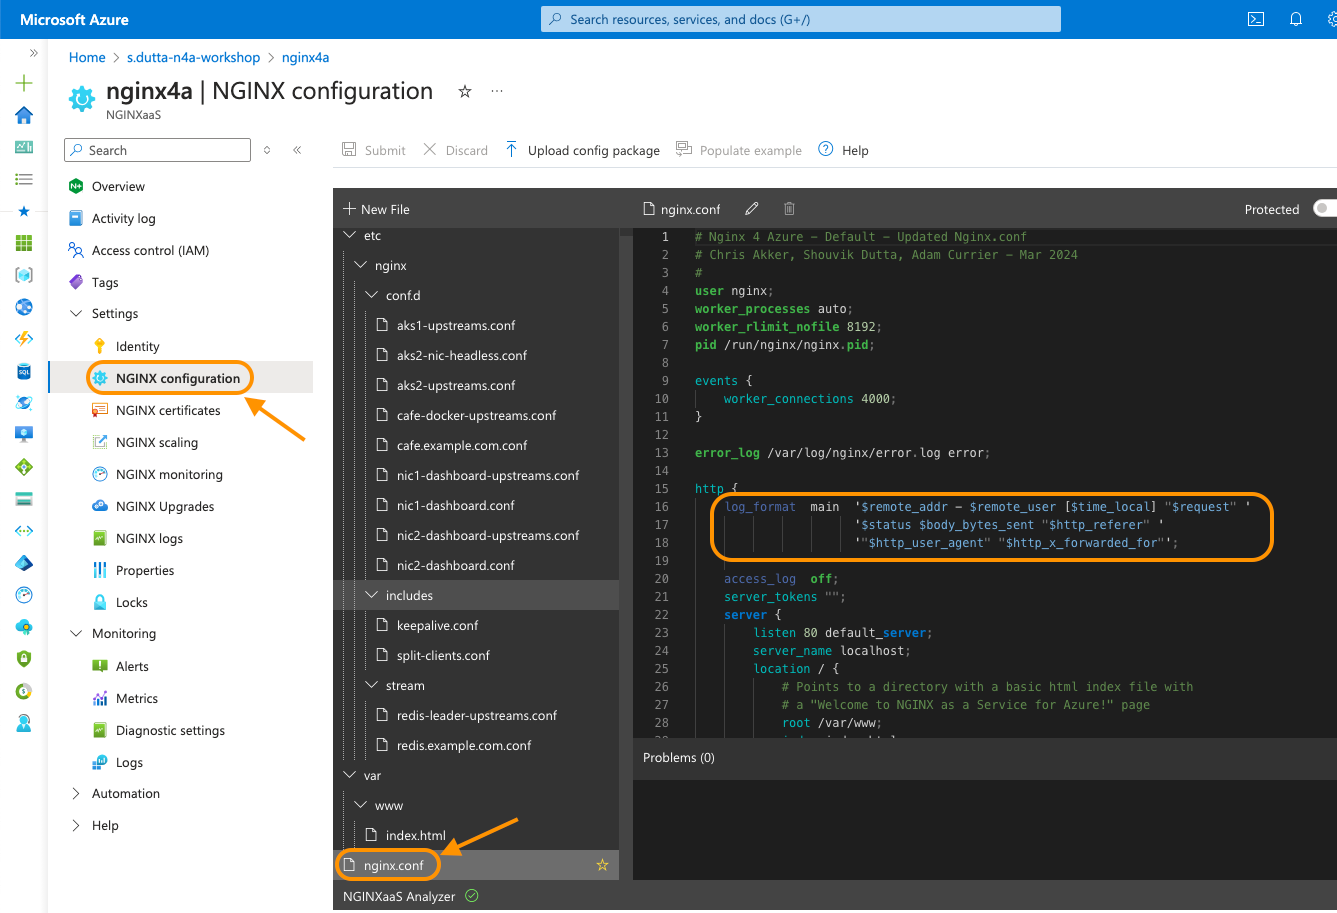
You will notice in previous labs, you have added the default basic log format inside the
httpblock within thenginx.conffile as highlighted in above screenshot. You will make use of this log format initially to capture some useful metrics within NGINX logs.log_format main '$remote_addr - $remote_user [$time_local] "$request" ' '$status $body_bytes_sent "$http_referer" ' '"$http_user_agent" "$http_x_forwarded_for"';
Update the
access_logdirective to enable logging. Within this directive, you will pass the full path of the log file (eg./var/log/nginx/access.log) and also themainlog format referenced above. Click onSubmitto apply the changes.access_log /var/log/nginx/access.log main;
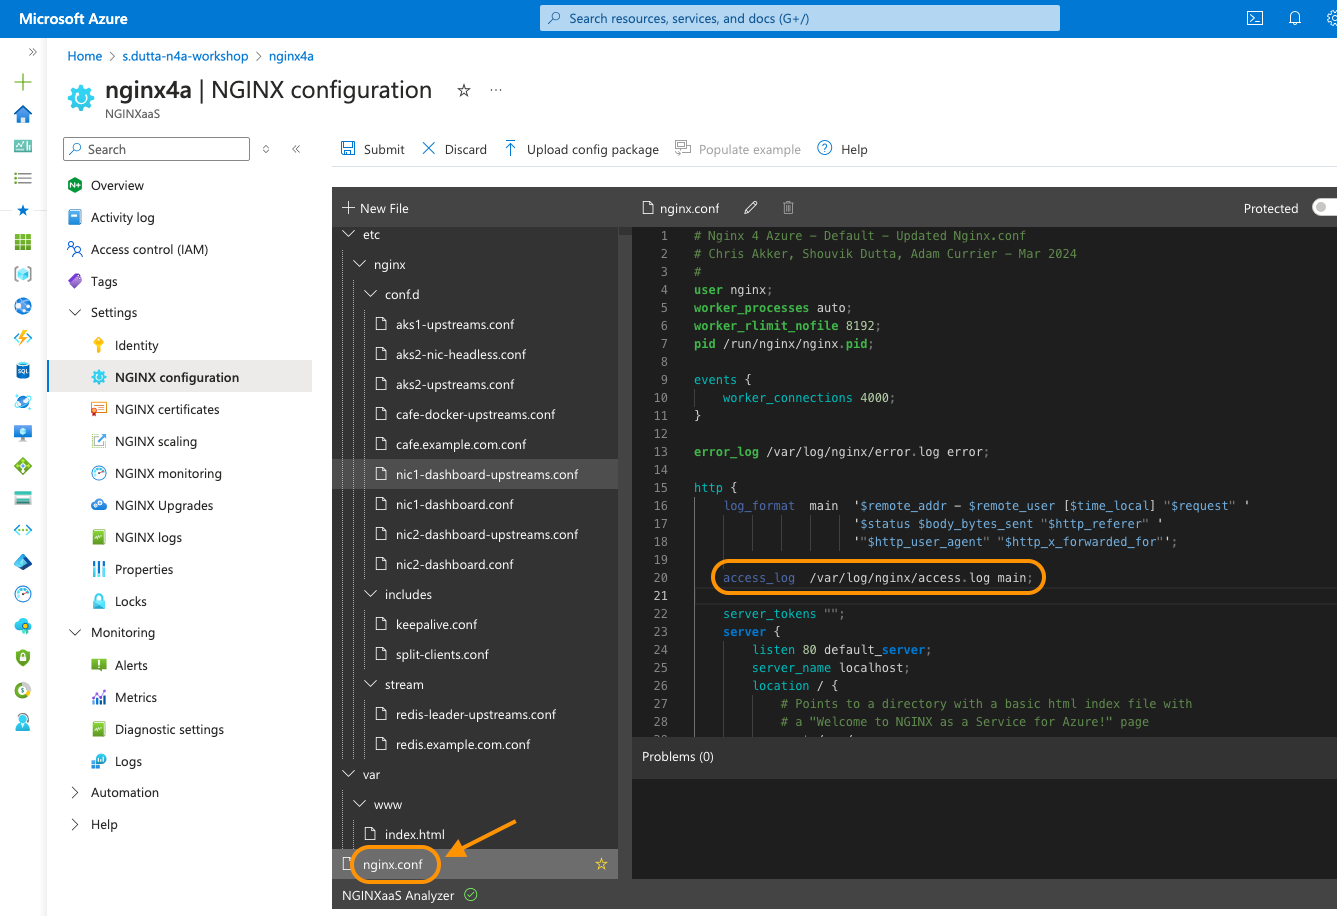
In subsequent sections you will test out the logs inside log analytics workspace.
Create enhance log format with additional logging metrics
In this section you will create an extended log format which you will
use with cafe.example.com server’s access log.
Within the NGINX for Azure resource (nginx4a), open the
Settings > NGINX Configurationpane.Within the
nginx.conffile, in the http context (just after the “log_format main” directive), add a new extended log format namedmain_extas shown in the below screenshot. Click onSubmitto save the config file# Extended Log Format log_format main_ext 'remote_addr="$remote_addr", ' '[time_local=$time_local], ' 'request="$request", ' 'status="$status", ' 'http_referer="$http_referer", ' 'body_bytes_sent="$body_bytes_sent", ' 'Host="$host", ' 'sn="$server_name", ' 'request_time=$request_time, ' 'http_user_agent="$http_user_agent", ' 'http_x_forwarded_for="$http_x_forwarded_for", ' 'request_length="$request_length", ' 'upstream_address="$upstream_addr", ' 'upstream_status="$upstream_status", ' 'upstream_connect_time="$upstream_connect_time", ' 'upstream_header_time="$upstream_header_time", ' 'upstream_response_time="$upstream_response_time", ' 'upstream_response_length="$upstream_response_length", ';
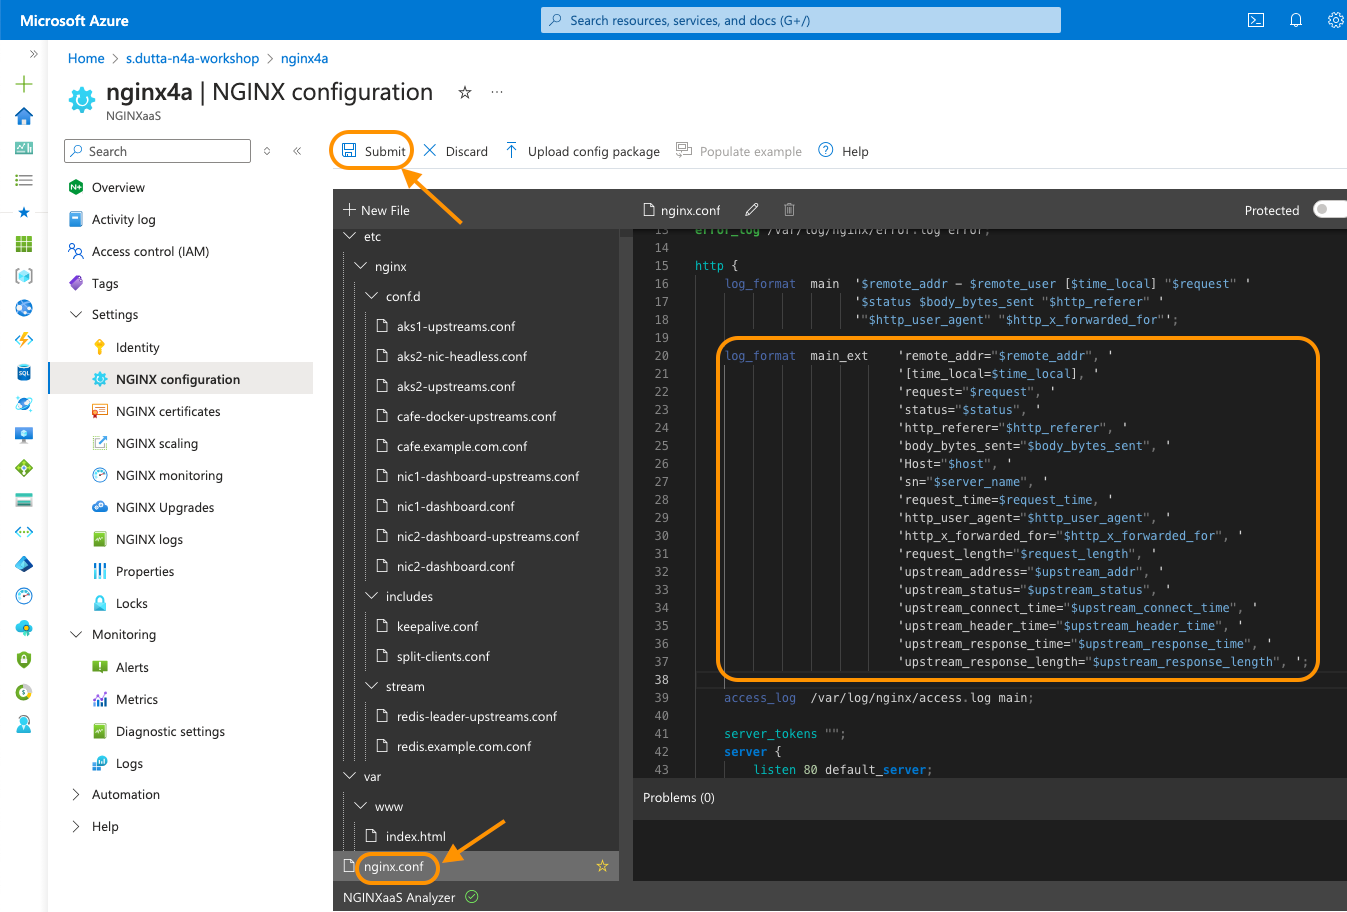
Once the extended log format has been created, open
cafe.example.com.conffile and update theaccess_logto make use of the extended log format as shown in the below screenshot. Be sureaccess_logis not still set to main in /etc/nginx/nginx.conf. If it is, comment that line out by adding a “#” to the beginning of the line. Click onSubmitto apply the changes.access_log /var/log/nginx/cafe.example.com.log main_ext;
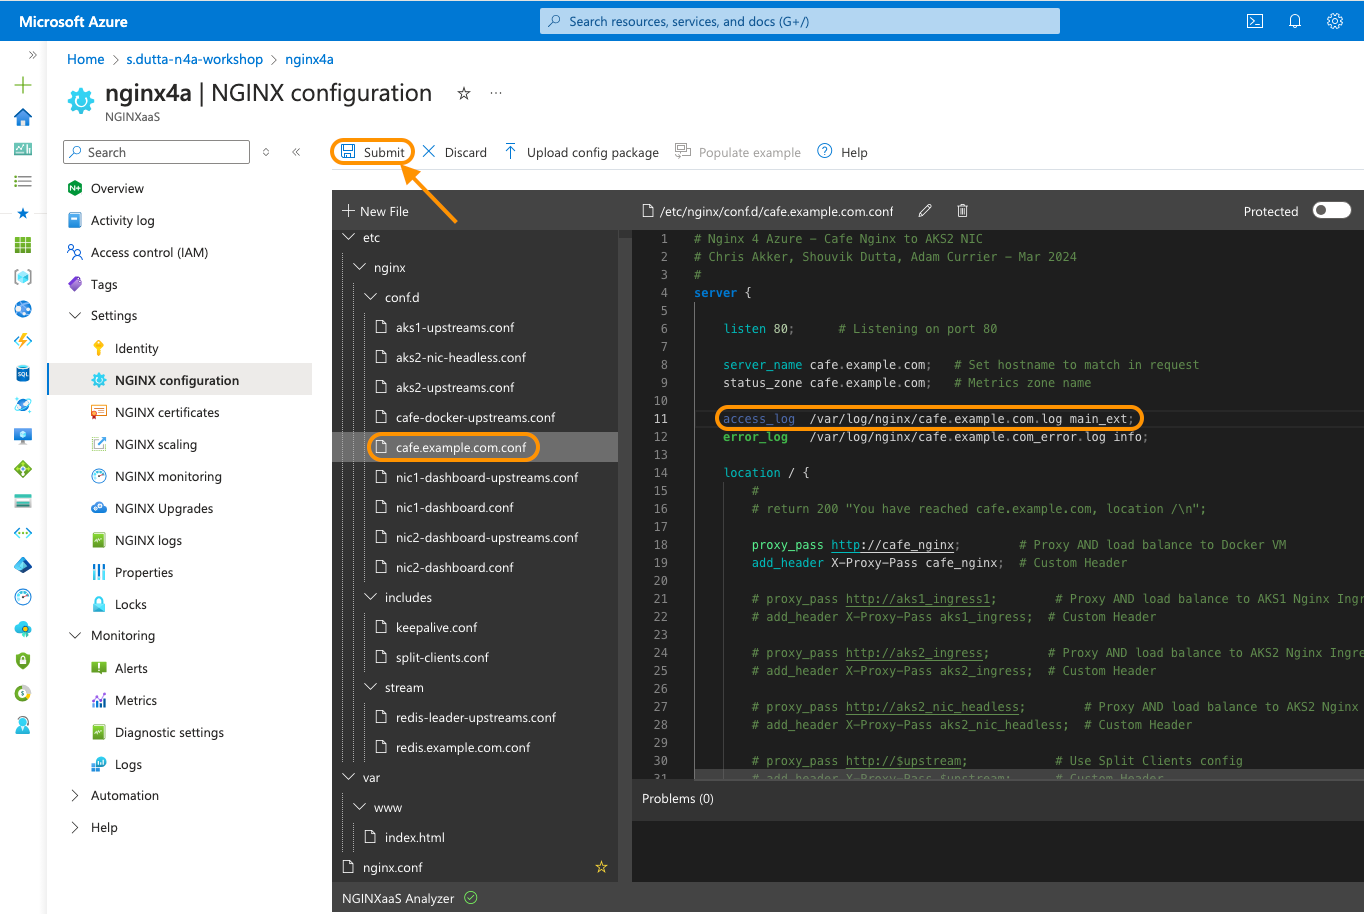
In the next section, you will test out the extended log format within inside log analytics workspace.
Test the access logs within log analytics workspace
To test out access logs, generate some traffic on your
cafe.example.comserver.You can generate some traffic using your local Docker Desktop. Start and run the
WRKload generation tool from a container using below command to generate traffic:Make request to the default server block which is using the
mainlog format for access logging by running below command.sudo docker run --name wrk --rm elswork/wrk -t4 -c200 -d1m --timeout 2s http://$MY_N4A_IP
Make request to the
cafe.example.comserver block which is using themain_extlog format for access logging by running below command.sudo docker run --name wrk --rm elswork/wrk -t4 -c200 -d1m --timeout 2s -H 'Host: cafe.example.com' http://$MY_N4A_IP/coffee
Within Azure portal, open your NGINX for Azure resource (nginx4a). From the left pane click on
Monitoring > Logs. (If you receive a pop-up tutorial window you can dismiss it.)NGINXaaSmay already be selected as the Resource type in the top-middle of the page. If not, Select Resource type from drop down and then type in NGINXaaS in the search box. This should open a new Query pane. SelectResource typefrom drop down and then type innginxin the search box. This should show all the sample queries related to NGINX for Azure. UnderShow NGINXaaS access logsclick onRunbutton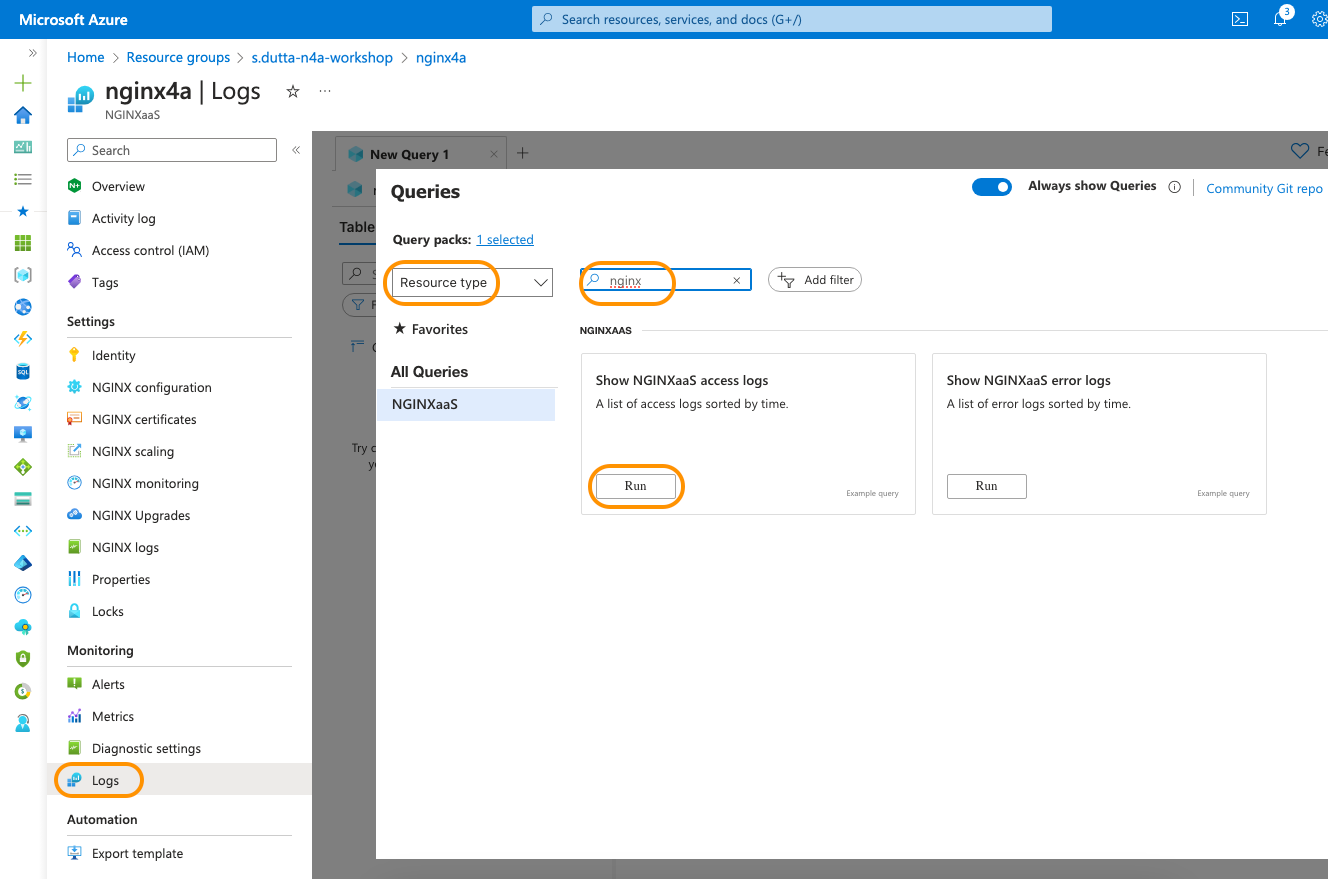
This should open a
new querywindow, which is made up of a query editor pane at the top and query result pane at the bottom as shown in the below screenshot.
NOTE: The logs may take couple of minutes to show up. If the results pane doesn’t show the logs then wait for a minute and then click on the
Runbutton to run the query again.Azure makes use of Kusto Query Language(KQL) to query logs. Have a look in the references section to learn more about KQL.
You will modify the default query to show logs for
cafe.example.comserver block. Update the default query with the below query in the query editor pane. Click on theRunbutton to execute the query.// Show NGINXaaS access logs // A list of access logs sorted by time. NGXOperationLogs | where FilePath == "/var/log/nginx/cafe.example.com.log" | sort by TimeGenerated desc | project TimeGenerated, FilePath, Message | limit 100

Within the Results pane, expand one of the logs to look into its details. You can also hover your mouse over the message to show the message details as shown in below screenshot. Note that the message follows the
main_extlog format.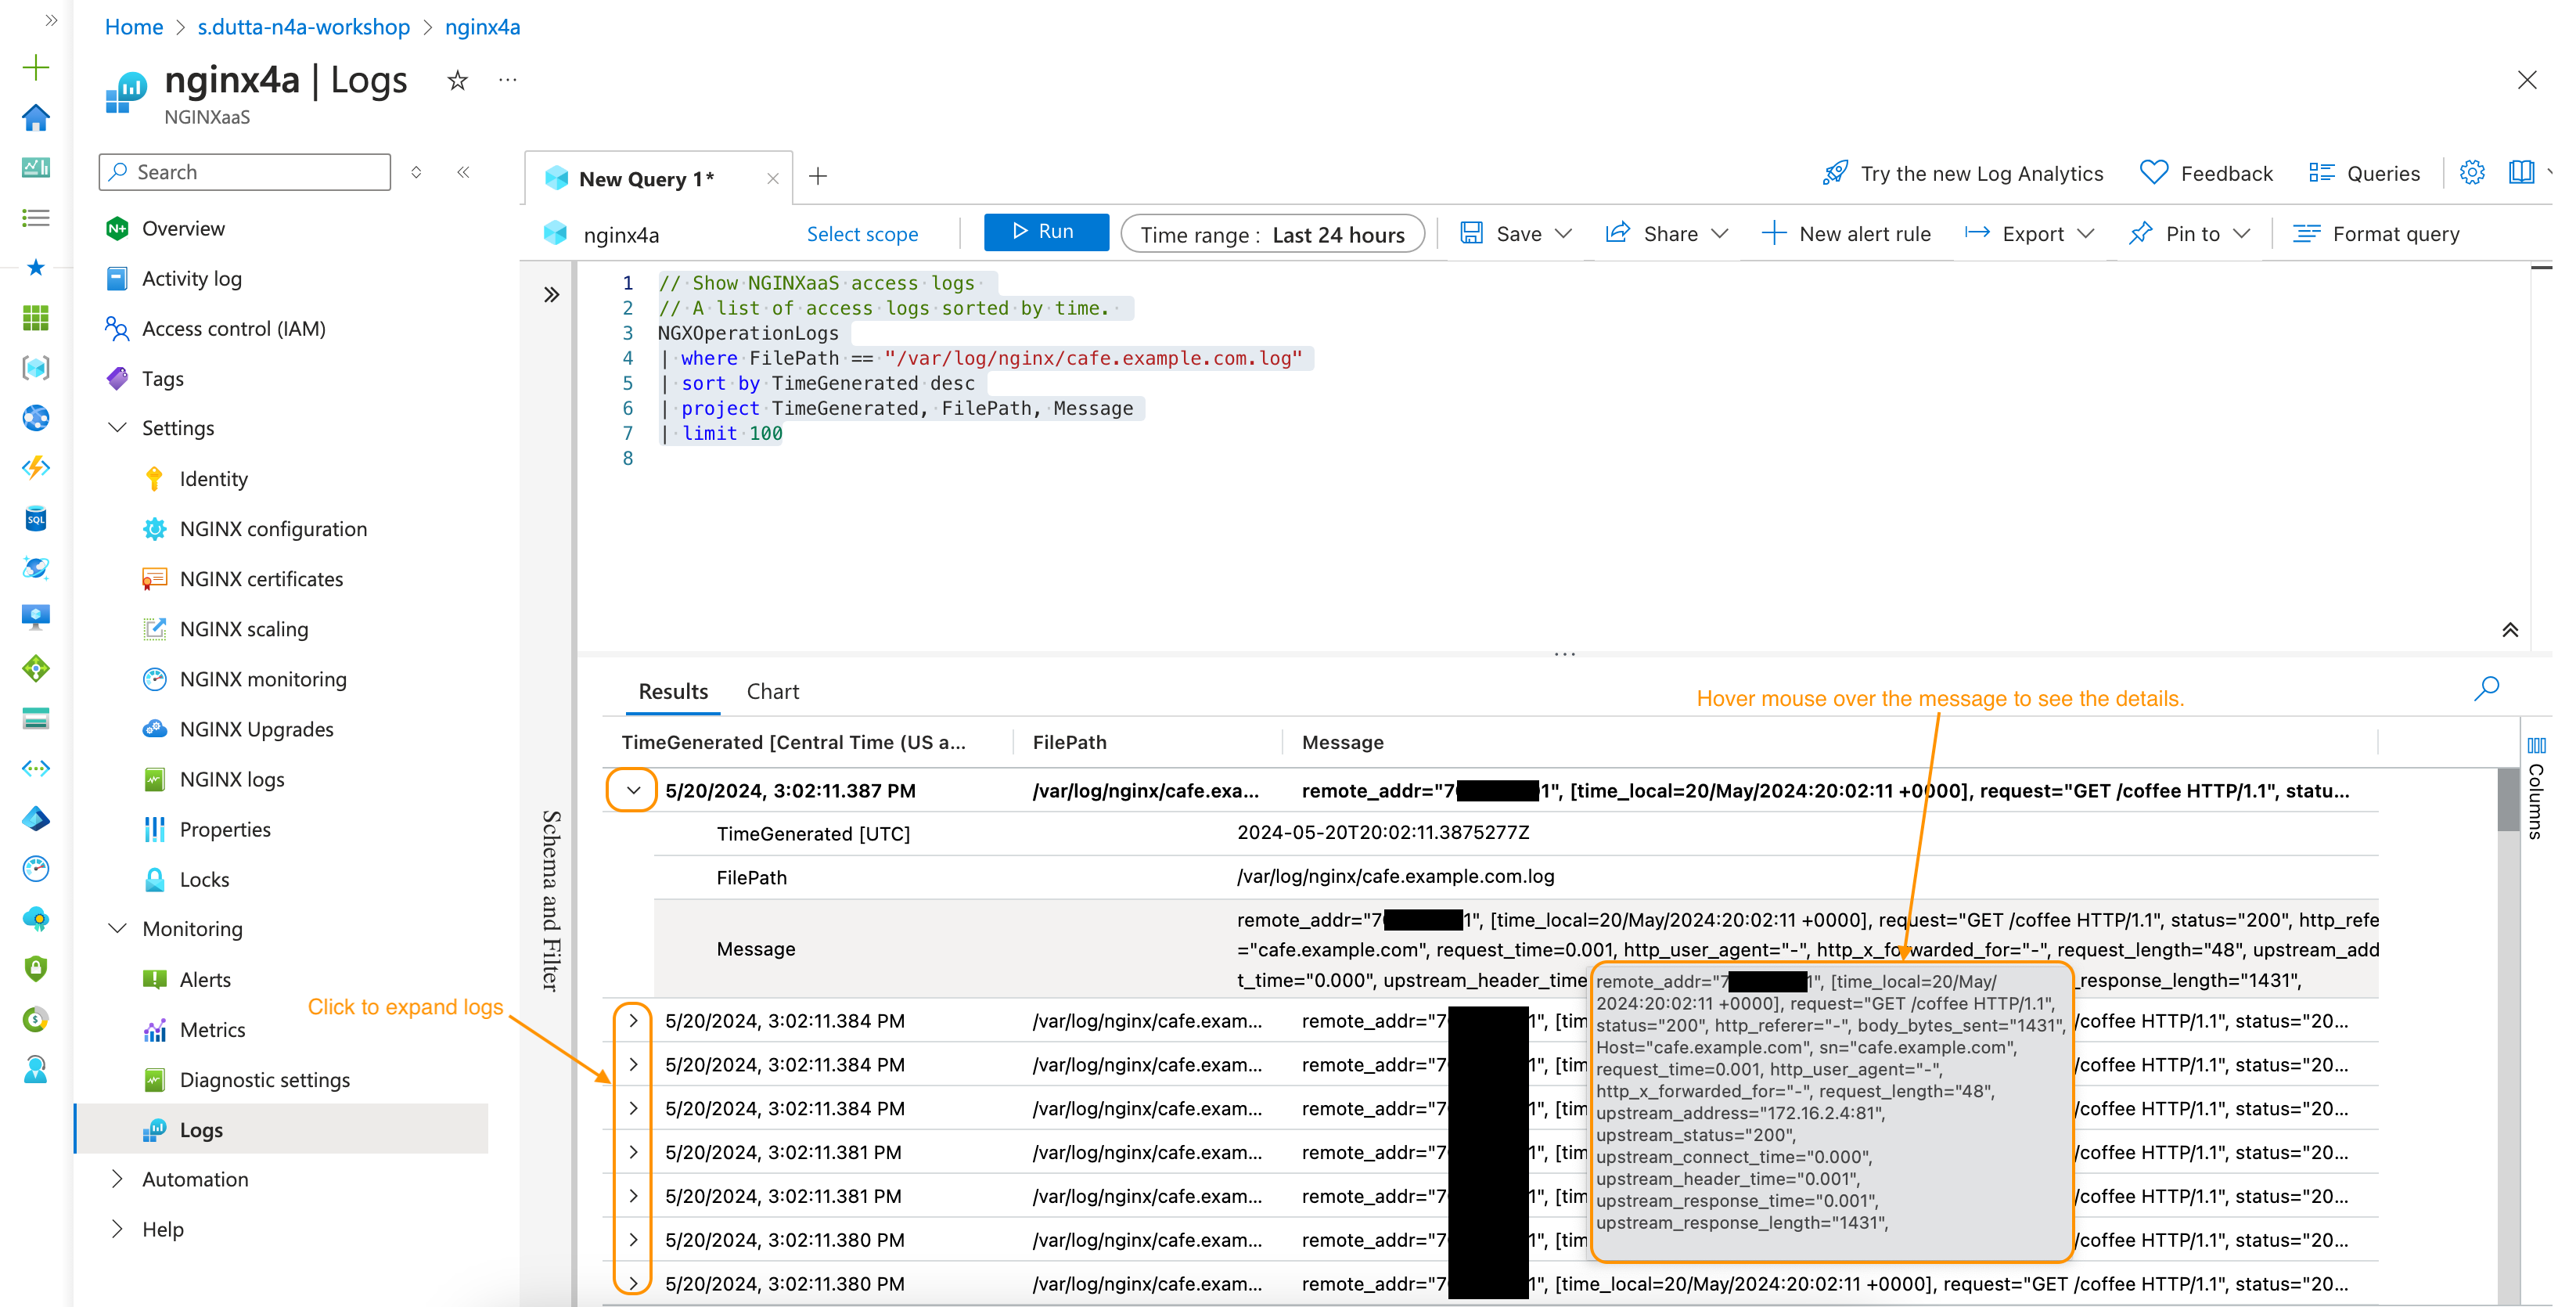
You can save the custom query if you wish by clicking on the
Savebutton and then selectingSave as query. Within theSave as querypane provide a query name and optional description and then finally click onSavebutton.
Explore Azure Monitoring for NGINX for Azure
Now generate some steady traffic using your local Docker Desktop. Start and run the
WRKload generation tool from a container using below command to generate traffic:sudo docker run --name wrk --rm elswork/wrk -t4 -c200 -d30m --timeout 2s http://cafe.example.com/coffee
The above command would run for 30 minutes and send request to
http://cafe.example.com/coffeeusing 4 threads and 200 connections.Within Azure portal, open your NGINX for Azure resource (nginx4a). From the left pane click on
Monitoring > Metrics. This should open a new Chart pane as shown in below screenshot.
For the first chart, within Metric Namespace drop-down, select
NGINXaaS standard metrics. For the Metric drop-down, selectServer zone HTTP requests. For the Aggregation , selectSum.Click on the Apply Splitting button. Within the Values drop-down, select
server_zone. From top right change the Time range toLast 30 minutesand click onApply. This should generate a chart similar to the below screenshot.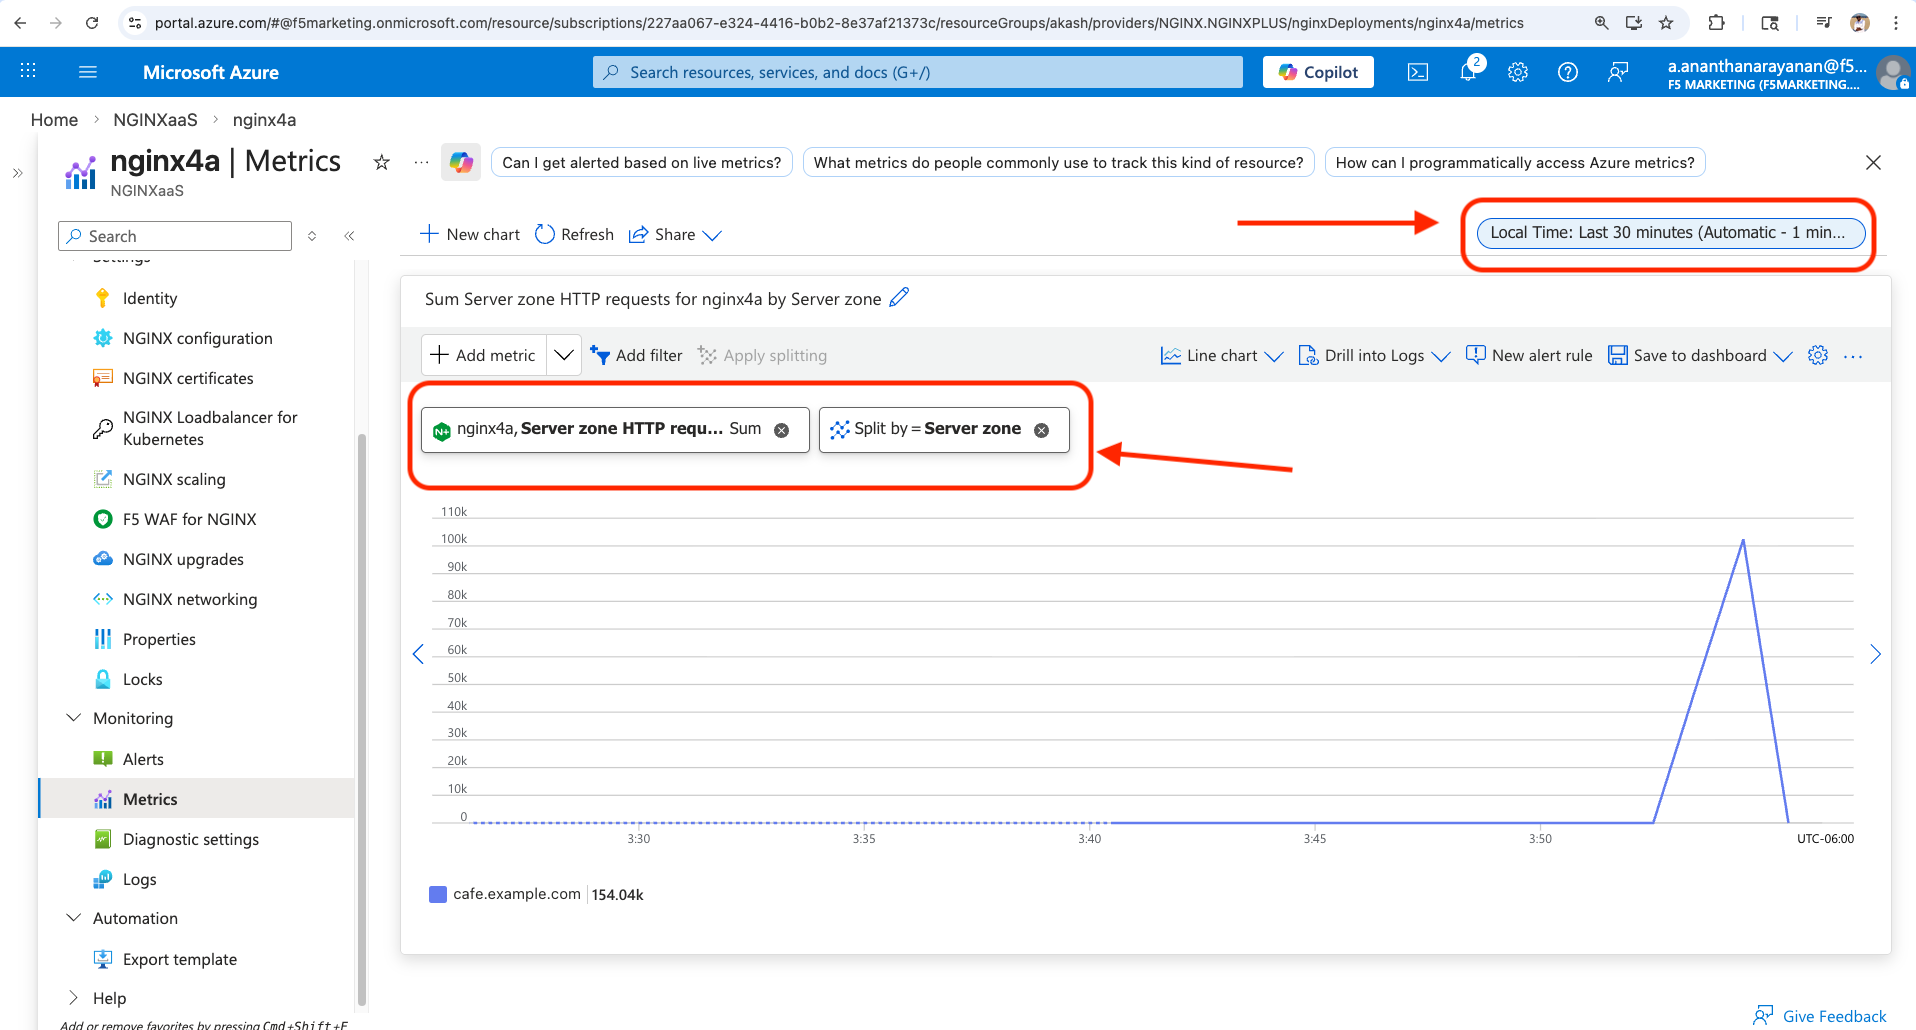
You will now save this chart in a new custom dashboard. Within the chart pane, click on
Save to dashboard > Pin to dashboard.Within the
Pin to dashboardpane, select theCreate newtab to create your new custom dashboard. Provide a name for your custom dashboard. Once done click onCreate and pinbutton to finish dashboard creation.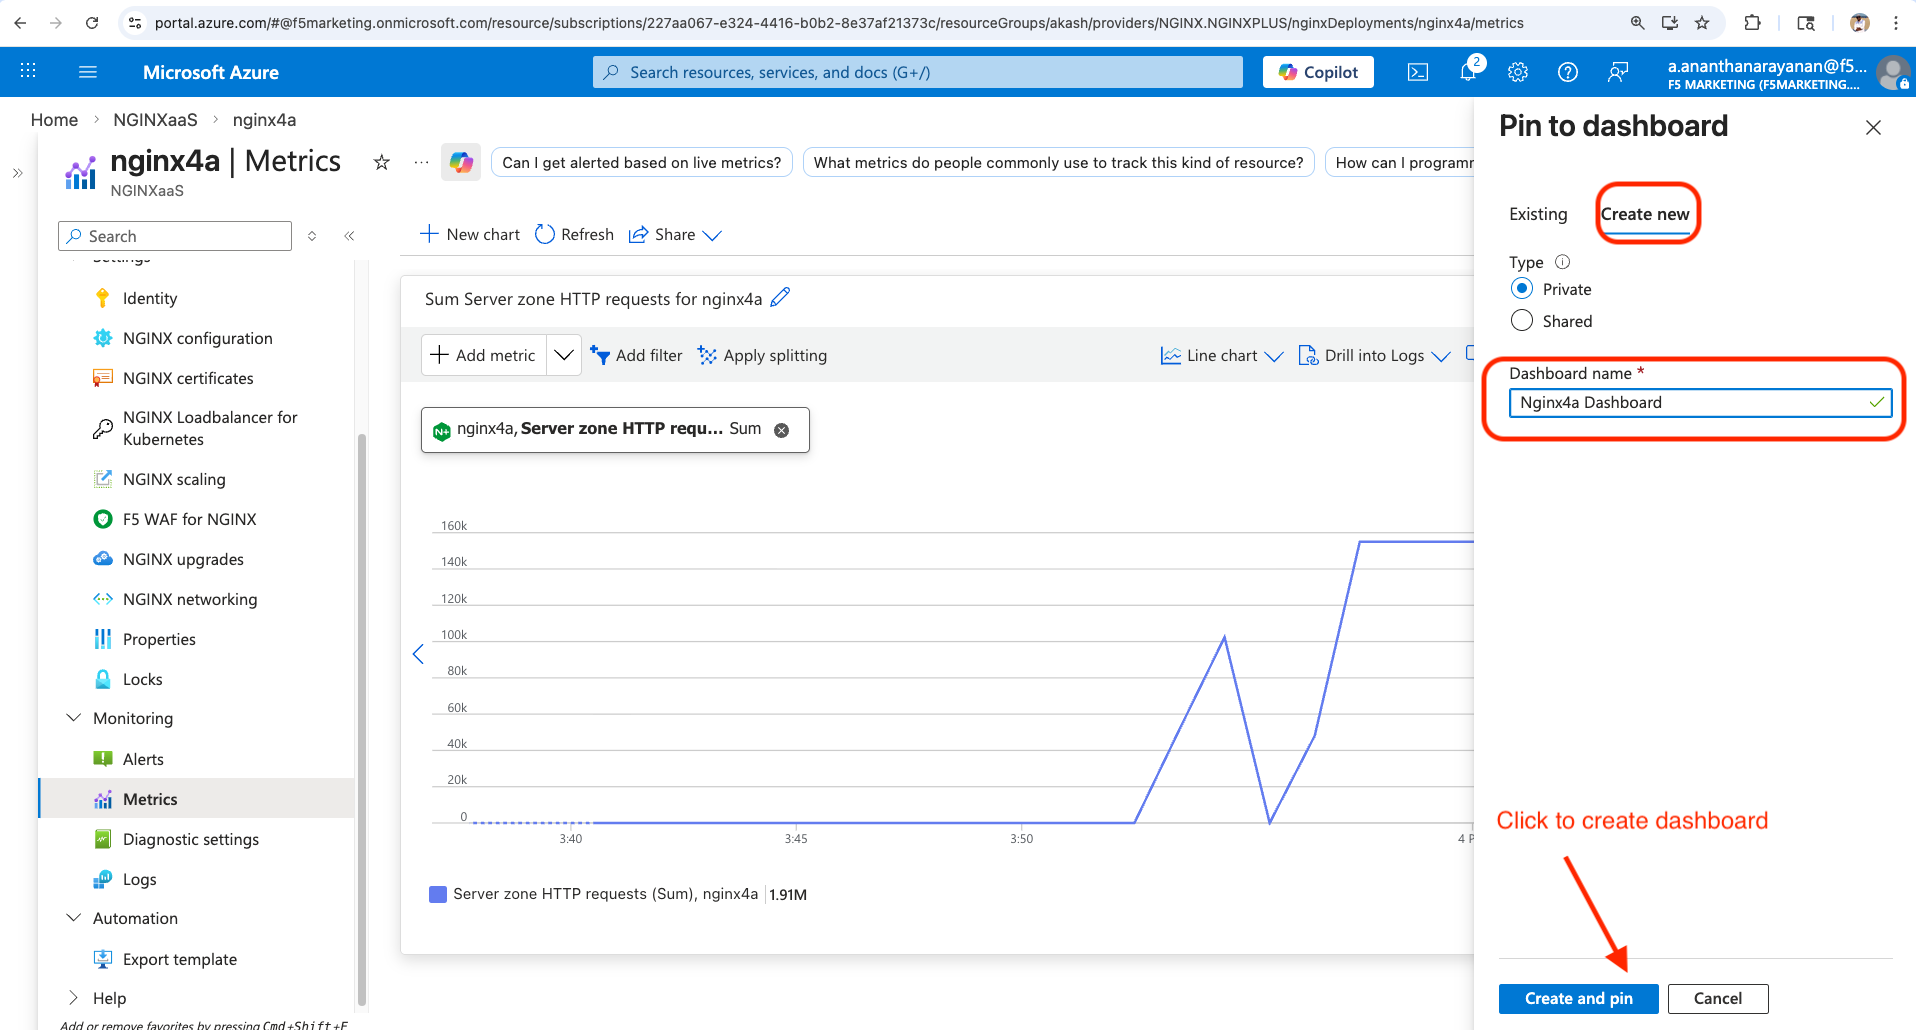
To view your newly created dashboard, within Azure portal, search for
Dashboardand selectDashboard hub.This should open the
Dashboard hubpage. From the top drop-down select your custom dashboard name (Nginx4a Dashboardin the screenshot). This should open your custom dashboard which includes the pinned server request chart.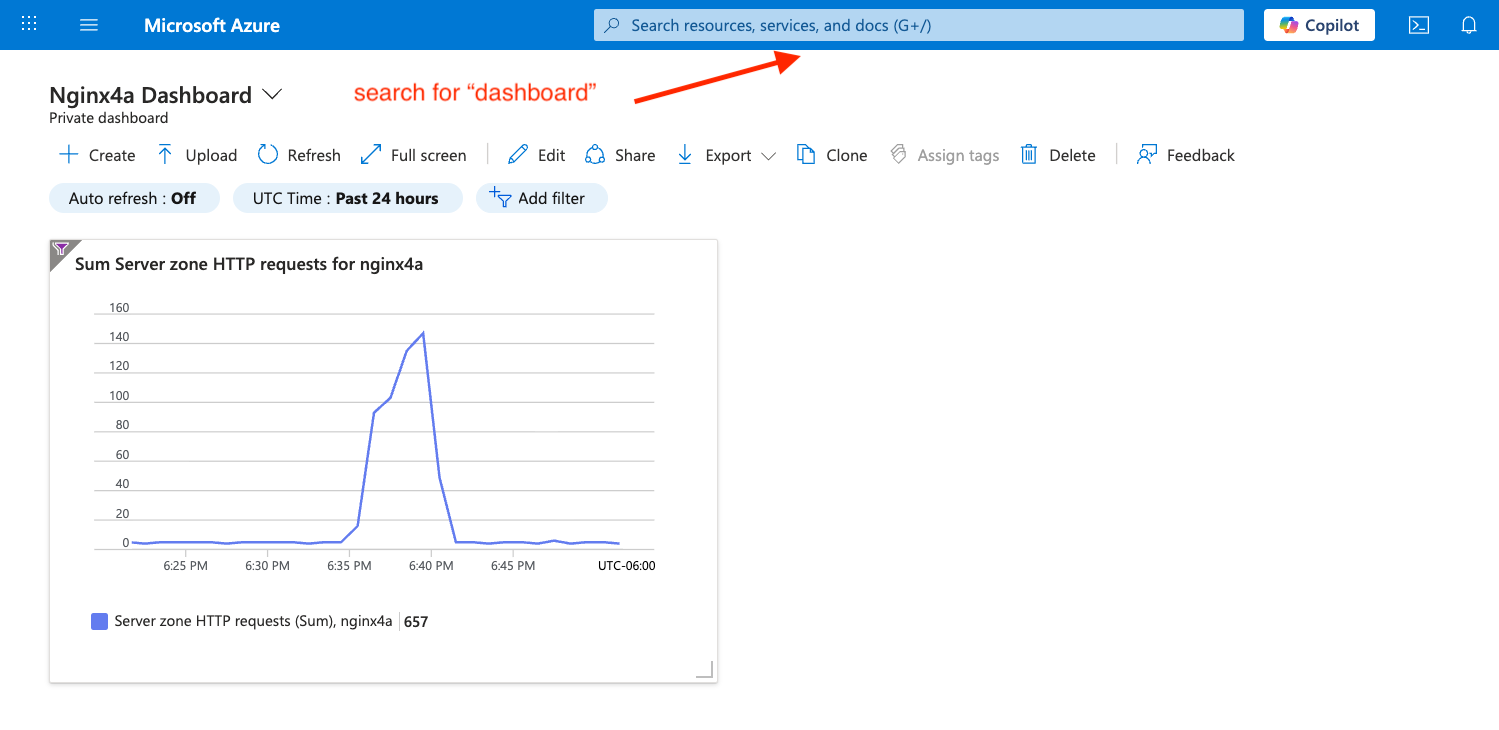
Now you will add some more charts to your newly created dashboard. Navigate back to NGINX for Azure resource (nginx4a) and from the left pane click on
Monitoring > Metrics.Within the chart pane, click on Metric Namespace drop-down and select
NGINXaaS standard metrics. For the Metrics drop-down, selectupstream server response. For the Aggregation drop-down, selectAvg.Click on the Add filter button. Within the Property drop-down, select
upstream. Leave the Operator to=. In values drop-down,cafe_nginx.Click on the Apply Splitting button. Within the Values drop-down, select
upstream. From top right change the Time range toLast 30 minutesand click onApply. This should generate a chart similar to below screenshot.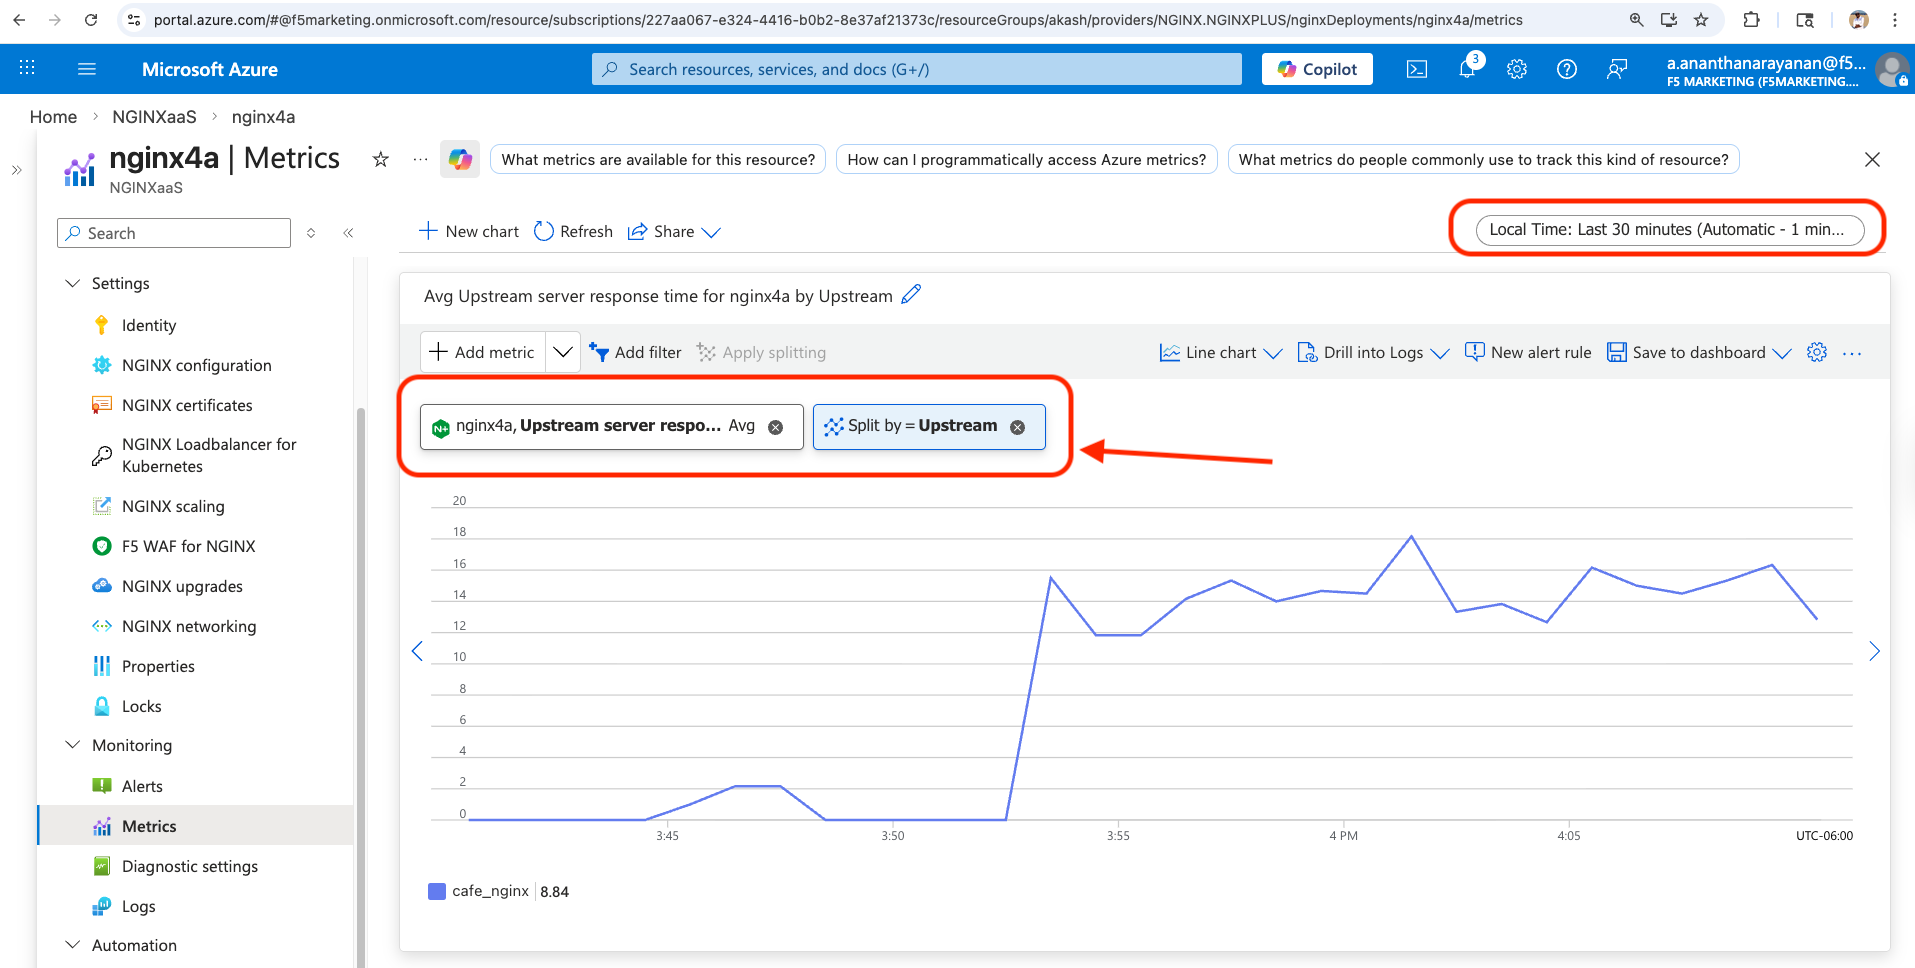
You will now pin this chart to your custom dashboard. Within the chart pane, click on
Save to dashboard > Pin to dashboard.Within the
Pin to dashboardpane, by default theExistingtab should be open with your recently created dashboard selected. Click onPinbutton to pin the chart to your dashboard.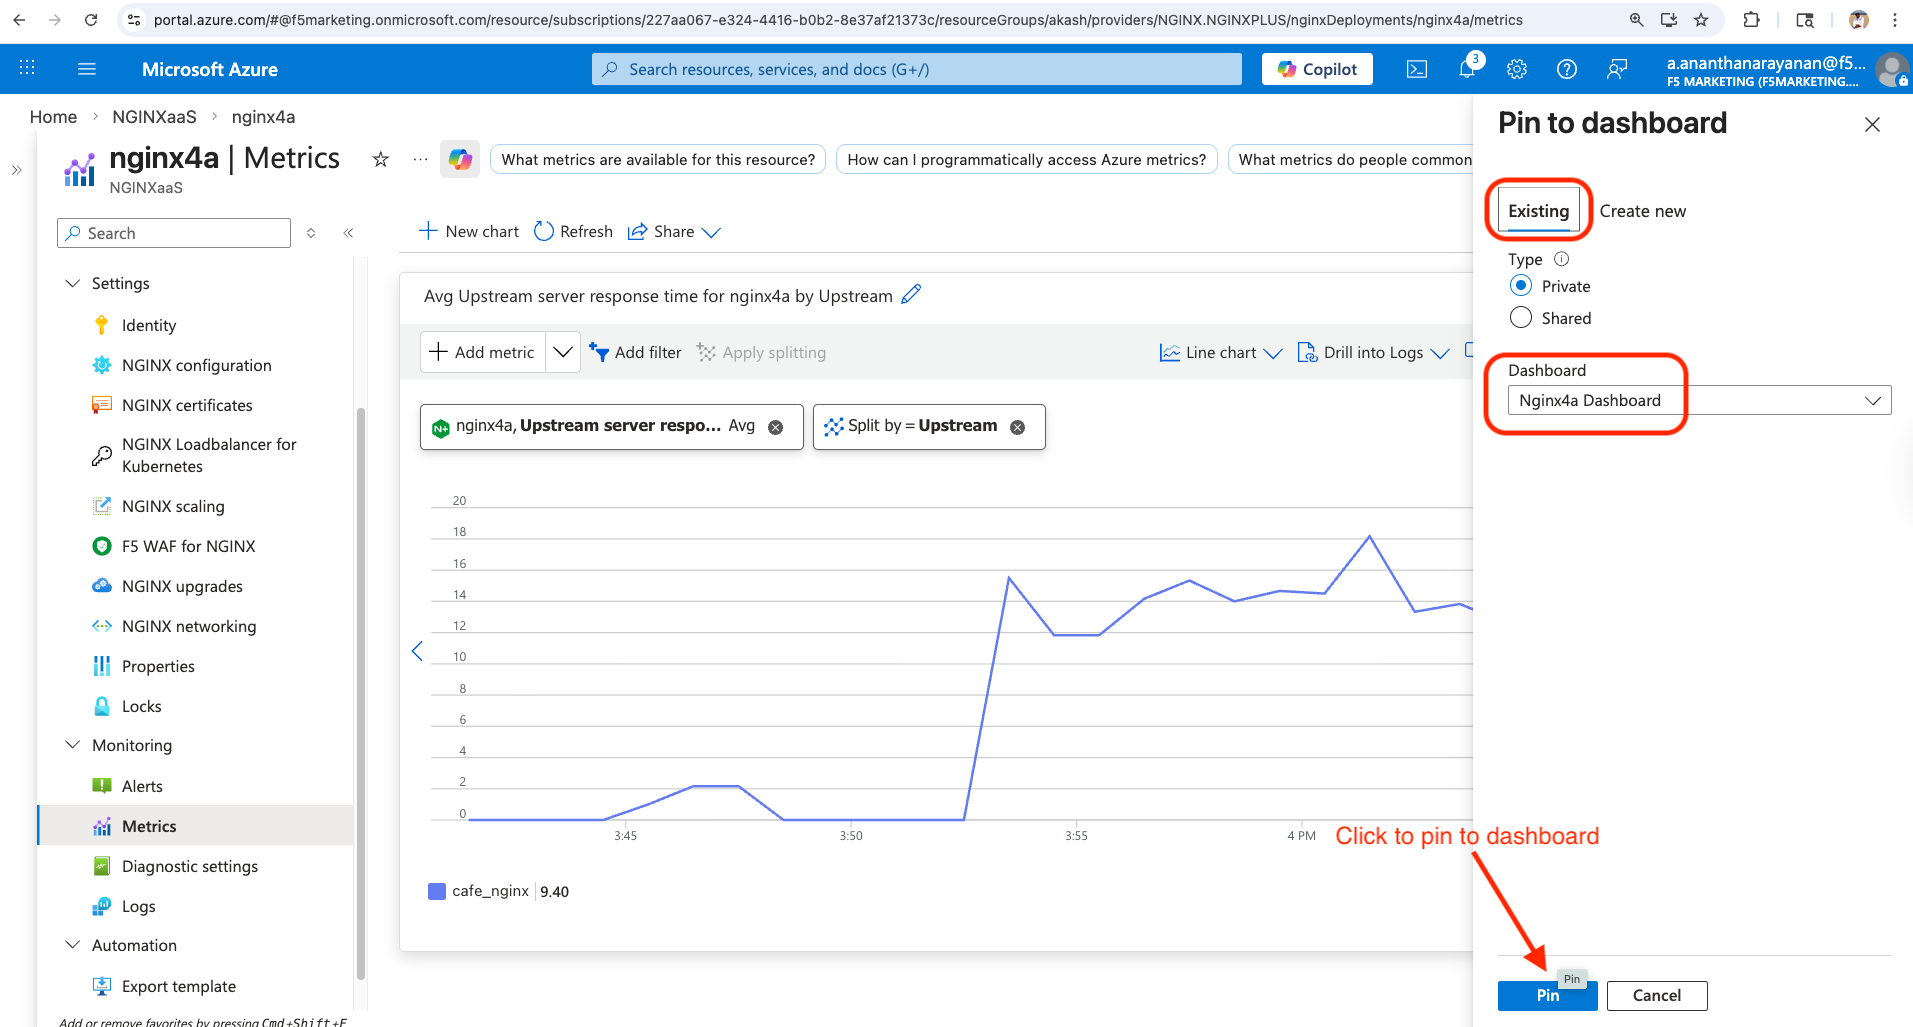
Navigate back to
Dashboardresource within Azure portal and select your dashboard. You will notice that the chart that you recently pinned shows up in your dashboard.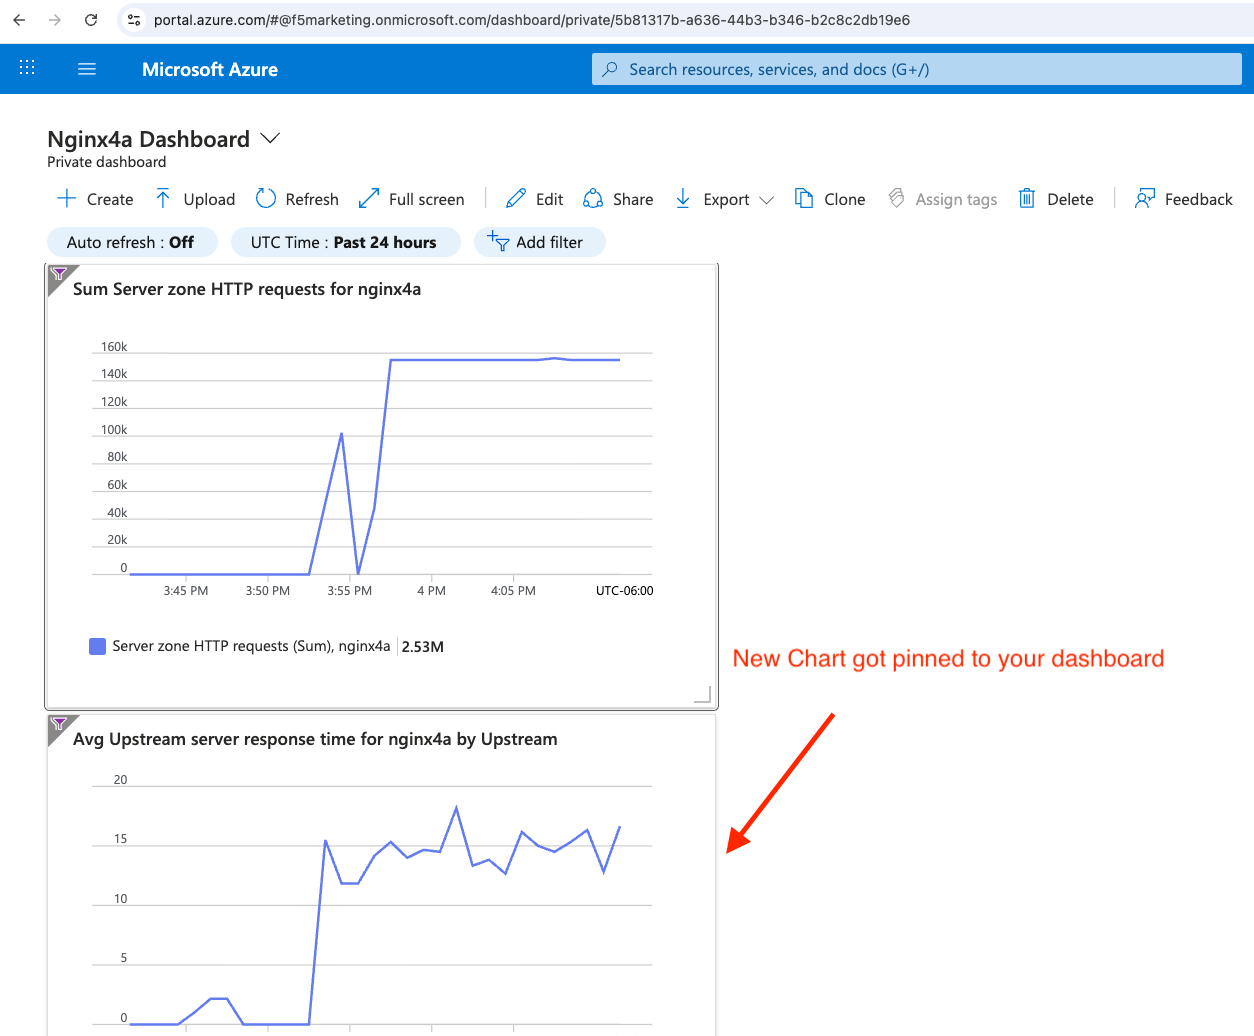
You can also edit your dashboard by clicking on the pencil icon to reposition/resize charts as per your taste.
Please look into the References section to check the metric catalog and explore various other metrics available with NGINX for Azure. Feel free to play around and pin multiple metrics to your dashboard.
This completes Lab3.