F5 rSeries Planning Guide Source |
Monitoring rSeries
With the introduction of a new F5OS platform layer, anyone deploying rSeries will need to know the important things for them to monitor to ensure proper health and performance of the system. In addition to getting F5’s recommendation on what to monitor, administrators will require details on how to get access to that information.
Some admins may want CLI commands to monitor, or API calls to query the system, and others may prefer the webUI. Many customers also use SNMP to monitor and be alerted of system issues and events. For SNMP integrations F5 will provide specific SNMP OID’s that an admin can monitor, and what traps are available for alerting. The following sections will outline what sort of monitoring and alerting is available with the new F5OS layer in rSeries. Alerting/monitoring inside the tenants themselves does not change except at the lower network layers.
Accessing the F5OS API
The F5OS platform API’s for the rSeries appliances can be reached on port 8888. In this document we will use the Postman tool to access rSeries F5OS platform layer API’s. You can download the Postman tool at:
https://www.postman.com/downloads/
You may also use Curl to get API status. The following curl command is pointed at the F5OS IP address on port 8888. The example below is using basic authentication. You can request output in JSON by using the following Accept header:
$ curl -k https://<Appliance1-IP>:8888/restconf/yang-library-version --header 'Accept: application/yang-data+json' -u admin:<password>
Or you can alter the Accept header to receive output in XML format:
$ curl -k https://<Appliance1-IP>:8888/restconf/yang-library-version --header 'Accept: application/yang-data+xml' -u admin:<password>
Hardware and System Component Monitoring
Hardware and System Component Monitoring from the CLI
Show Components from the CLI
High level appliance status can be obtained by using the show components command, this will include all the subsystems:
appliance-1# show components
components component lcd
state serial-no sub0872g00d5
state empty false
components component platform
state description    "BIG-IP r5900"
state serial-no      f5-vdvh-bfwi
state part-no        "200-0411-02 REV 2"
state empty          false
state tpm-integrity-status Valid
state memory available 6973112320
state memory free 1112055808
state memory used-percent 95
state temperature current 25.9
state temperature average 25.7
state temperature minimum 24.5
state temperature maximum 26.8
                                                                                UPDATE
NAME                        NAME  VALUE                              CONFIGURABLE  STATUS
-------------------------------------------------------------------------------------------
QAT0                        -     Lewisburg C62X Crypto/Compression  false         -
QAT1                        -     Lewisburg C62X Crypto/Compression  false         -
QAT2                        -     Lewisburg C62X Crypto/Compression  false         -
fw-version-bios             -     1.02.108.1                         false         none
fw-version-bios-me          -     4.4.4.58                           false         none
fw-version-cpld             -     02.0A.00                           false         none
fw-version-drive-m.2.slot1  -     EDA7602Q                           false         none
fw-version-drive-nvme0      -     EDA7602Q                           false         none
fw-version-lcd-app          -     1.01.057.00.1                      false         none
fw-version-lcd-bootloader   -     1.01.027.00.1                      false         none
fw-version-lcd-ui           -     1.5.1                              false         none
fw-version-lop-app          -     1.00.214.0.1                       false         none
fw-version-lop-bootloader   -     1.02.062.0.1                       false         none
fw-version-sirr             -     1.1.29                             false         none

                                                                                                                        READ                             WRITE
DISK                                                                                    TOTAL  READ    READ    READ     LATENCY  WRITE  WRITE   WRITE    LATENCY
NAME     MODEL                       VENDOR   VERSION   SERIAL NO       SIZE      TYPE  IOPS   IOPS    MERGED  BYTES    MS       IOPS   MERGED  BYTES    MS
------------------------------------------------------------------------------------------------------------------------------------------------------------------
nvme0n1  SAMSUNG MZ1LB960HAJQ-00007  Samsung  EDA7602Q  S435NA0NA05748  733.00GB  nvme  10000  106370  90831   5018531  31839    24160  28636   1340660  35097

cpu state cpu-utilization thread cpu
cpu state cpu-utilization current 3
cpu state cpu-utilization five-second-avg 2
cpu state cpu-utilization one-minute-avg 2
cpu state cpu-utilization five-minute-avg 2
CPU               CORE                           THREAD
INDEX  CACHESIZE  CNT   FREQ           STEPPING  CNT     MODELNAME
-----------------------------------------------------------------------------------------------------
0      24576(KB)  16    2899.951(MHz)  6         32      Intel(R) Xeon(R) Silver 4314 CPU @ 2.40GHz

                        FIVE    ONE     FIVE
THREAD                   SECOND  MINUTE  MINUTE
INDEX   THREAD  CURRENT  AVG     AVG     AVG
-------------------------------------------------
0       cpu0    2        1       1       1
1       cpu1    1        1       1       1
2       cpu2    1        1       1       1
3       cpu3    1        1       3       3
4       cpu4    1        1       4       3
5       cpu5    2        1       3       3
6       cpu6    5        2       3       3
7       cpu7    2        2       3       3
8       cpu8    2        3       2       3
9       cpu9    1        3       3       2
10      cpu10   2        2       3       3
11      cpu11   3        2       2       3
12      cpu12   1        1       2       3
13      cpu13   0        2       3       3
14      cpu14   2        5       3       3
15      cpu15   8        3       3       3
16      cpu16   3        1       2       2
17      cpu17   0        0       1       1
18      cpu18   0        0       1       1
19      cpu19   5        2       4       3
20      cpu20   3        1       2       3
21      cpu21   1        1       2       2
22      cpu22   0        1       1       3
23      cpu23   0        1       3       2
24      cpu24   4        1       3       2
25      cpu25   4        2       2       3
26      cpu26   13       6       2       3
27      cpu27   9        3       2       2
28      cpu28   10       4       3       3
29      cpu29   4        2       2       2
30      cpu30   2        1       2       4
31      cpu31   19       7       3       2

FPGA
INDEX   VERSION
-----------------
asw_0   71.2.7
atse_0  72.2.5

components component psu-1
state serial-no S92031RC1991
state part-no M1845
state empty false
psu-stats psu-current-in 1.718
psu-stats psu-current-out 26.562
psu-stats psu-voltage-in 204.5
psu-stats psu-voltage-out 12.062
psu-stats psu-temperature-1 33.0
psu-stats psu-temperature-2 44.0
psu-stats psu-temperature-3 48.0
psu-stats psu-fan-1-speed 9760
appliance-1#
Show Component State Only from the CLI
If you just want the state and not all the details:
appliance-1# show components component state
components component lcd
state serial-no sub0872g00d5
state empty false
components component platform
state description    "BIG-IP r5900"
state serial-no      f5-vdvh-bfwi
state part-no        "200-0411-02 REV 2"
state empty          false
state tpm-integrity-status Valid
state memory available 6973259776
state memory free 1123016704
state memory used-percent 95
state temperature current 26.0
state temperature average 25.7
state temperature minimum 24.5
state temperature maximum 26.8
components component psu-1
state serial-no S92031RC1991
state part-no M1845
state empty false
appliance-1#
Show Component Properties from the CLI
This command shows the firmware version of the various subsystems:
appliance-1# show components component properties
                                                                                            UPDATE
NAME      NAME                        NAME  VALUE                              CONFIGURABLE  STATUS
-----------------------------------------------------------------------------------------------------
lcd
platform  QAT0                        -     Lewisburg C62X Crypto/Compression  false         -
        QAT1                        -     Lewisburg C62X Crypto/Compression  false         -
        QAT2                        -     Lewisburg C62X Crypto/Compression  false         -
        fw-version-bios             -     1.02.108.1                         false         none
        fw-version-bios-me          -     4.4.4.58                           false         none
        fw-version-cpld             -     02.0A.00                           false         none
        fw-version-drive-m.2.slot1  -     EDA7602Q                           false         none
        fw-version-drive-nvme0      -     EDA7602Q                           false         none
        fw-version-lcd-app          -     1.01.057.00.1                      false         none
        fw-version-lcd-bootloader   -     1.01.027.00.1                      false         none
        fw-version-lcd-ui           -     1.5.1                              false         none
        fw-version-lop-app          -     1.00.214.0.1                       false         none
        fw-version-lop-bootloader   -     1.02.062.0.1                       false         none
        fw-version-sirr             -     1.1.29                             false         none
psu-1

appliance-1#
Show Power Supply Status from the CLI
Or you can view individual subsystems. High level power supply status can be obtained by using the show components component <psu-#> command:
appliance-1# show components component psu-
    PSU      PSU      PSU      PSU      PSU          PSU          PSU          PSU
    CURRENT  CURRENT  VOLTAGE  VOLTAGE  TEMPERATURE  TEMPERATURE  TEMPERATURE  FAN 1
NAME   IN       OUT      IN       OUT      1            2            3            SPEED
-----------------------------------------------------------------------------------------
psu-1  1.703    26.312   204.5    12.078   33.0         44.0         48.0         9792

appliance-1# show components component psu-1
components component psu-1
state serial-no S92031RC1991
state part-no M1845
state empty false
psu-stats psu-current-in 1.718
psu-stats psu-current-out 26.75
psu-stats psu-voltage-in 204.0
psu-stats psu-voltage-out 12.062
psu-stats psu-temperature-1 33.0
psu-stats psu-temperature-2 44.0
psu-stats psu-temperature-3 48.0
psu-stats psu-fan-1-speed 9760
appliance-1#
High level power supply stats can be obtained by using the show components component psu-stats command:
appliance-1# show components component psu-stats
    PSU      PSU      PSU      PSU      PSU          PSU          PSU          PSU
    CURRENT  CURRENT  VOLTAGE  VOLTAGE  TEMPERATURE  TEMPERATURE  TEMPERATURE  FAN 1
NAME   IN       OUT      IN       OUT      1            2            3            SPEED
-----------------------------------------------------------------------------------------
psu-1  1.703    26.0     204.0    12.062   33.0         44.0         48.0         9792

appliance-1#
Show LCD Status from the CLI
High level chassis LCD status can be obtained by using the show components component lcd command:
appliance-1# show components component lcd
components component lcd
state serial-no sub0872g00d5
state empty false
appliance-1#
Show CPU Status from the CLI
You can view stats on the platform CPU and basic utilization with the command show components component cpu:
appliance-1# show components component cpu
FIVE ONE FIVE FIVE ONE FIVE
SECOND MINUTE MINUTE CPU CORE THREAD THREAD SECOND MINUTE MINUTE
NAME THREAD CURRENT AVG AVG AVG INDEX CACHESIZE CNT FREQ STEPPING CNT MODELNAME INDEX THREAD CURRENT AVG AVG AVG
---------------------------------------------------------------------------------------------------------------------------------------------------------------------------------------------------------
platform cpu 2 1 2 2 0 24576(KB) 16 2899.951(MHz) 6 32 Intel(R) Xeon(R) Silver 4314 CPU @ 2.40GHz 0 cpu0 0 0 1 1
1 cpu1 0 0 1 1
2 cpu2 0 1 1 1
3 cpu3 1 2 3 3
4 cpu4 2 1 2 3
5 cpu5 2 3 3 3
6 cpu6 4 2 2 3
7 cpu7 4 3 3 3
8 cpu8 17 5 3 3
9 cpu9 4 2 2 3
10 cpu10 3 1 3 3
11 cpu11 3 1 3 3
12 cpu12 2 1 3 3
13 cpu13 2 1 4 3
14 cpu14 3 1 3 3
15 cpu15 2 1 3 3
16 cpu16 3 2 2 2
17 cpu17 0 1 1 1
18 cpu18 0 0 1 1
19 cpu19 2 1 2 2
20 cpu20 2 2 3 3
21 cpu21 3 1 3 3
22 cpu22 1 1 2 2
23 cpu23 4 1 3 2
24 cpu24 7 3 4 3
25 cpu25 1 1 6 4
26 cpu26 1 1 2 3
27 cpu27 1 1 3 2
28 cpu28 3 1 2 3
29 cpu29 2 1 3 3
30 cpu30 2 1 3 3
31 cpu31 2 1 2 2
appliance-1#
Show Storage Status from the CLI
You can view stats on the storage subsystem:
appliance-1# show components component storage
                                                                                                                                READ                             WRITE
        DISK                                                                                    TOTAL  READ    READ    READ     LATENCY  WRITE  WRITE   WRITE    LATENCY
NAME      NAME     MODEL                       VENDOR   VERSION   SERIAL NO       SIZE      TYPE  IOPS   IOPS    MERGED  BYTES    MS       IOPS   MERGED  BYTES    MS
----------------------------------------------------------------------------------------------------------------------------------------------------------------------------
platform  nvme0n1  SAMSUNG MZ1LB960HAJQ-00007  Samsung  EDA7602Q  S435NA0NA05748  733.00GB  nvme  10000  106370  90831   5018531  31839    24160  28636   1340660  35097

appliance-1#
Hardware and System Component Monitoring from the API
Appliance Component Status from the API
The overall appliance component status can be queried via the following API command:
GET https://{{rseries_appliance1_ip}}:8888/restconf/data/openconfig-platform:components
{
"openconfig-platform:components": {
"component": [
{
"name": "lcd",
"config": {
"name": "lcd"
},
"state": {
"serial-no": "sub0872g00d5",
"empty": false
}
},
{
"name": "platform",
"config": {
"name": "platform"
},
"state": {
"description": "BIG-IP r5900",
"serial-no": "f5-vdvh-bfwi",
"part-no": "200-0411-02 REV 2",
"empty": false,
"f5-platform:tpm-integrity-status": "Valid",
"f5-platform:memory": {
"available": "6870933504",
"free": "1400750080",
"used-percent": 95
},
"f5-platform:temperature": {
"current": "31.0",
"average": "30.8",
"minimum": "29.9",
"maximum": "32.0"
}
},
"properties": {
"property": [
{
"name": "QAT0",
"config": {
"name": "QAT0"
},
"state": {
"value": "Lewisburg C62X Crypto/Compression",
"configurable": false
}
},
{
"name": "QAT1",
"config": {
"name": "QAT1"
},
"state": {
"value": "Lewisburg C62X Crypto/Compression",
"configurable": false
}
},
{
"name": "QAT2",
"config": {
"name": "QAT2"
},
"state": {
"value": "Lewisburg C62X Crypto/Compression",
"configurable": false
}
},
{
"name": "fw-version-bios",
"config": {
"name": "fw-version-bios"
},
"state": {
"value": "1.02.108.1",
"configurable": false,
"f5-platform:update-status": "none"
}
},
{
"name": "fw-version-bios-me",
"config": {
"name": "fw-version-bios-me"
},
"state": {
"value": "4.4.4.58",
"configurable": false,
"f5-platform:update-status": "none"
}
},
{
"name": "fw-version-cpld",
"config": {
"name": "fw-version-cpld"
},
"state": {
"value": "02.0A.00",
"configurable": false,
"f5-platform:update-status": "none"
}
},
{
"name": "fw-version-drive-m.2.slot1",
"config": {
"name": "fw-version-drive-m.2.slot1"
},
"state": {
"value": "EDA7602Q",
"configurable": false,
"f5-platform:update-status": "none"
}
},
{
"name": "fw-version-drive-nvme0",
"config": {
"name": "fw-version-drive-nvme0"
},
"state": {
"value": "EDA7602Q",
"configurable": false,
"f5-platform:update-status": "none"
}
},
{
"name": "fw-version-lcd-app",
"config": {
"name": "fw-version-lcd-app"
},
"state": {
"value": "1.01.057.00.1",
"configurable": false,
"f5-platform:update-status": "none"
}
},
{
"name": "fw-version-lcd-bootloader",
"config": {
"name": "fw-version-lcd-bootloader"
},
"state": {
"value": "1.01.027.00.1",
"configurable": false,
"f5-platform:update-status": "none"
}
},
{
"name": "fw-version-lcd-ui",
"config": {
"name": "fw-version-lcd-ui"
},
"state": {
"value": "1.5.1",
"configurable": false,
"f5-platform:update-status": "none"
}
},
{
"name": "fw-version-lop-app",
"config": {
"name": "fw-version-lop-app"
},
"state": {
"value": "1.00.214.0.1",
"configurable": false,
"f5-platform:update-status": "none"
}
},
{
"name": "fw-version-lop-bootloader",
"config": {
"name": "fw-version-lop-bootloader"
},
"state": {
"value": "1.02.062.0.1",
"configurable": false,
"f5-platform:update-status": "none"
}
},
{
"name": "fw-version-sirr",
"config": {
"name": "fw-version-sirr"
},
"state": {
"value": "1.1.29",
"configurable": false,
"f5-platform:update-status": "none"
}
}
]
},
"storage": {
"state": {
"f5-platform:disks": {
"disk": [
{
"disk-name": "nvme0n1",
"state": {
"model": "SAMSUNG MZ1LB960HAJQ-00007",
"vendor": "Samsung",
"version": "EDA7602Q",
"serial-no": "S435NA0NA05748",
"size": "733.00GB",
"type": "nvme",
"disk-io": {
"total-iops": "10685",
"read-iops": "113950",
"read-merged": "100807",
"read-bytes": "5961474",
"read-latency-ms": "35349",
"write-iops": "27668",
"write-merged": "31954",
"write-bytes": "1462612",
"write-latency-ms": "34517"
}
}
}
]
}
}
},
"cpu": {
"state": {
"f5-platform:processors": {
"processor": [
{
"cpu-index": 0,
"state": {
"cachesize": "24576(KB)",
"core-cnt": "16",
"freq": "2899.951(MHz)",
"stepping": "6",
"thread-cnt": "32",
"modelname": "Intel(R) Xeon(R) Silver 4314 CPU @ 2.40GHz"
}
}
]
},
"f5-platform:cpu-utilization": {
"thread": "cpu",
"current": 1,
"five-second-avg": 2,
"one-minute-avg": 3,
"five-minute-avg": 3
},
"f5-platform:cpu-threads": {
"cpu-thread": [
{
"thread-index": 0,
"thread": "cpu0",
"current": 0,
"five-second-avg": 0,
"one-minute-avg": 1,
"five-minute-avg": 1
},
{
"thread-index": 1,
"thread": "cpu1",
"current": 0,
"five-second-avg": 0,
"one-minute-avg": 1,
"five-minute-avg": 1
},
{
"thread-index": 2,
"thread": "cpu2",
"current": 0,
"five-second-avg": 0,
"one-minute-avg": 1,
"five-minute-avg": 1
},
{
"thread-index": 3,
"thread": "cpu3",
"current": 0,
"five-second-avg": 1,
"one-minute-avg": 1,
"five-minute-avg": 1
},
{
"thread-index": 4,
"thread": "cpu4",
"current": 3,
"five-second-avg": 2,
"one-minute-avg": 4,
"five-minute-avg": 4
},
{
"thread-index": 5,
"thread": "cpu5",
"current": 0,
"five-second-avg": 1,
"one-minute-avg": 2,
"five-minute-avg": 1
},
{
"thread-index": 6,
"thread": "cpu6",
"current": 2,
"five-second-avg": 2,
"one-minute-avg": 3,
"five-minute-avg": 3
},
{
"thread-index": 7,
"thread": "cpu7",
"current": 2,
"five-second-avg": 2,
"one-minute-avg": 3,
"five-minute-avg": 3
},
{
"thread-index": 8,
"thread": "cpu8",
"current": 0,
"five-second-avg": 2,
"one-minute-avg": 3,
"five-minute-avg": 4
},
{
"thread-index": 9,
"thread": "cpu9",
"current": 1,
"five-second-avg": 2,
"one-minute-avg": 3,
"five-minute-avg": 3
},
{
"thread-index": 10,
"thread": "cpu10",
"current": 0,
"five-second-avg": 1,
"one-minute-avg": 3,
"five-minute-avg": 3
},
{
"thread-index": 11,
"thread": "cpu11",
"current": 1,
"five-second-avg": 4,
"one-minute-avg": 3,
"five-minute-avg": 4
},
{
"thread-index": 12,
"thread": "cpu12",
"current": 3,
"five-second-avg": 4,
"one-minute-avg": 4,
"five-minute-avg": 4
},
{
"thread-index": 13,
"thread": "cpu13",
"current": 1,
"five-second-avg": 2,
"one-minute-avg": 3,
"five-minute-avg": 3
},
{
"thread-index": 14,
"thread": "cpu14",
"current": 2,
"five-second-avg": 3,
"one-minute-avg": 3,
"five-minute-avg": 3
},
{
"thread-index": 15,
"thread": "cpu15",
"current": 3,
"five-second-avg": 9,
"one-minute-avg": 4,
"five-minute-avg": 3
},
{
"thread-index": 16,
"thread": "cpu16",
"current": 2,
"five-second-avg": 1,
"one-minute-avg": 1,
"five-minute-avg": 1
},
{
"thread-index": 17,
"thread": "cpu17",
"current": 0,
"five-second-avg": 1,
"one-minute-avg": 1,
"five-minute-avg": 1
},
{
"thread-index": 18,
"thread": "cpu18",
"current": 1,
"five-second-avg": 1,
"one-minute-avg": 1,
"five-minute-avg": 1
},
{
"thread-index": 19,
"thread": "cpu19",
"current": 3,
"five-second-avg": 4,
"one-minute-avg": 8,
"five-minute-avg": 8
},
{
"thread-index": 20,
"thread": "cpu20",
"current": 0,
"five-second-avg": 1,
"one-minute-avg": 2,
"five-minute-avg": 3
},
{
"thread-index": 21,
"thread": "cpu21",
"current": 6,
"five-second-avg": 5,
"one-minute-avg": 5,
"five-minute-avg": 5
},
{
"thread-index": 22,
"thread": "cpu22",
"current": 0,
"five-second-avg": 1,
"one-minute-avg": 2,
"five-minute-avg": 3
},
{
"thread-index": 23,
"thread": "cpu23",
"current": 3,
"five-second-avg": 2,
"one-minute-avg": 3,
"five-minute-avg": 3
},
{
"thread-index": 24,
"thread": "cpu24",
"current": 1,
"five-second-avg": 1,
"one-minute-avg": 4,
"five-minute-avg": 3
},
{
"thread-index": 25,
"thread": "cpu25",
"current": 1,
"five-second-avg": 2,
"one-minute-avg": 3,
"five-minute-avg": 3
},
{
"thread-index": 26,
"thread": "cpu26",
"current": 0,
"five-second-avg": 1,
"one-minute-avg": 2,
"five-minute-avg": 2
},
{
"thread-index": 27,
"thread": "cpu27",
"current": 0,
"five-second-avg": 1,
"one-minute-avg": 3,
"five-minute-avg": 3
},
{
"thread-index": 28,
"thread": "cpu28",
"current": 0,
"five-second-avg": 1,
"one-minute-avg": 4,
"five-minute-avg": 3
},
{
"thread-index": 29,
"thread": "cpu29",
"current": 0,
"five-second-avg": 10,
"one-minute-avg": 3,
"five-minute-avg": 3
},
{
"thread-index": 30,
"thread": "cpu30",
"current": 1,
"five-second-avg": 2,
"one-minute-avg": 4,
"five-minute-avg": 4
},
{
"thread-index": 31,
"thread": "cpu31",
"current": 0,
"five-second-avg": 1,
"one-minute-avg": 2,
"five-minute-avg": 3
}
]
}
}
},
"integrated-circuit": {
"state": {
"f5-platform:fpgas": {
"fpga": [
{
"fpga-index": "asw_0",
"state": {
"version": "71.2.7"
}
},
{
"fpga-index": "atse_0",
"state": {
"version": "72.2.5"
}
}
]
}
}
}
},
{
"name": "psu-1",
"config": {
"name": "psu-1"
},
"state": {
"serial-no": "S92031RC1991",
"part-no": "M1845",
"empty": false
},
"f5-fan-psu-stats:psu-stats": {
"psu-current-in": "1.718",
"psu-current-out": "26.375",
"psu-voltage-in": "204.5",
"psu-voltage-out": "12.062",
"psu-temperature-1": "38.0",
"psu-temperature-2": "48.0",
"psu-temperature-3": "54.0",
"psu-fan-1-speed": 9632
}
}
]
}
}
LCD Status from the API
The appliance LCD panel status can be queried via the following API command:
GET https://{{rseries_appliance1_ip}}:8888/restconf/data/openconfig-platform:components/component=lcd
{
    "openconfig-platform:component": [
        {
            "name": "lcd",
            "config": {
                "name": "lcd"
            },
            "state": {
                "serial-no": "sub0872g00d5",
                "empty": false
            }
        }
    ]
}
Power Supply Status from the API
The rSeries appliance may have 1 or 2 power supplies installed. Each can be queried via the following API command. Substitute psu-1, or psu-2 (for dual power systems) at the end of the API call:
GET https://{{rseries_appliance1_ip}}:8888/restconf/data/openconfig-platform:components/component=psu-1
{
    "openconfig-platform:component": [
        {
            "name": "psu-1",
            "config": {
                "name": "psu-1"
            },
            "state": {
                "serial-no": "S92031RC1991",
                "part-no": "M1845",
                "empty": false
            },
            "f5-fan-psu-stats:psu-stats": {
                "psu-current-in": "1.718",
                "psu-current-out": "26.375",
                "psu-voltage-in": "204.0",
                "psu-voltage-out": "12.046",
                "psu-temperature-1": "38.0",
                "psu-temperature-2": "48.0",
                "psu-temperature-3": "53.0",
                "psu-fan-1-speed": 9600
            }
        }
    ]
}
Storage Status from the API
You may query the status of the disks within the rSeries appliance:
GET https://{{rseries_appliance1_ip}}:8888/restconf/data/openconfig-platform:components/component=platform/storage
{
    "openconfig-platform:storage": {
        "state": {
            "f5-platform:disks": {
                "disk": [
                    {
                        "disk-name": "nvme0n1",
                        "state": {
                            "model": "SAMSUNG MZ1LB960HAJQ-00007",
                            "vendor": "Samsung",
                            "version": "EDA7602Q",
                            "serial-no": "S435NA0NA05748",
                            "size": "733.00GB",
                            "type": "nvme",
                            "disk-io": {
                                "total-iops": "10685",
                                "read-iops": "113950",
                                "read-merged": "100807",
                                "read-bytes": "5961474",
                                "read-latency-ms": "35349",
                                "write-iops": "27668",
                                "write-merged": "31954",
                                "write-bytes": "1462612",
                                "write-latency-ms": "34517"
                            }
                        }
                    }
                ]
            }
        }
    }
}
CPU Status from the API
You can query the details about the CPUs within each rSeries device. Every CPU thread (vCPU) will display Current, 5 Seconds, 1 Minute, and 5 Minute utilization.
GET https://{{rseries_appliance1_ip}}:8888/restconf/data/openconfig-platform:components/component=platform/cpu
Below is the exmaple output for CPU’s:
{
"openconfig-platform:cpu": {
"state": {
"f5-platform:processors": {
"processor": [
{
"cpu-index": 0,
"state": {
"cachesize": "24576(KB)",
"core-cnt": "16",
"freq": "2899.951(MHz)",
"stepping": "6",
"thread-cnt": "32",
"modelname": "Intel(R) Xeon(R) Silver 4314 CPU @ 2.40GHz"
}
}
]
},
"f5-platform:cpu-utilization": {
"thread": "cpu",
"current": 7,
"five-second-avg": 3,
"one-minute-avg": 3,
"five-minute-avg": 3
},
"f5-platform:cpu-threads": {
"cpu-thread": [
{
"thread-index": 0,
"thread": "cpu0",
"current": 0,
"five-second-avg": 0,
"one-minute-avg": 0,
"five-minute-avg": 1
},
{
"thread-index": 1,
"thread": "cpu1",
"current": 0,
"five-second-avg": 0,
"one-minute-avg": 0,
"five-minute-avg": 1
},
{
"thread-index": 2,
"thread": "cpu2",
"current": 0,
"five-second-avg": 0,
"one-minute-avg": 1,
"five-minute-avg": 1
},
{
"thread-index": 3,
"thread": "cpu3",
"current": 2,
"five-second-avg": 1,
"one-minute-avg": 1,
"five-minute-avg": 1
},
{
"thread-index": 4,
"thread": "cpu4",
"current": 5,
"five-second-avg": 3,
"one-minute-avg": 4,
"five-minute-avg": 3
},
{
"thread-index": 5,
"thread": "cpu5",
"current": 8,
"five-second-avg": 2,
"one-minute-avg": 1,
"five-minute-avg": 1
},
{
"thread-index": 6,
"thread": "cpu6",
"current": 3,
"five-second-avg": 2,
"one-minute-avg": 3,
"five-minute-avg": 3
},
{
"thread-index": 7,
"thread": "cpu7",
"current": 13,
"five-second-avg": 5,
"one-minute-avg": 4,
"five-minute-avg": 4
},
{
"thread-index": 8,
"thread": "cpu8",
"current": 7,
"five-second-avg": 4,
"one-minute-avg": 4,
"five-minute-avg": 4
},
{
"thread-index": 9,
"thread": "cpu9",
"current": 3,
"five-second-avg": 2,
"one-minute-avg": 3,
"five-minute-avg": 4
},
{
"thread-index": 10,
"thread": "cpu10",
"current": 7,
"five-second-avg": 3,
"one-minute-avg": 4,
"five-minute-avg": 3
},
{
"thread-index": 11,
"thread": "cpu11",
"current": 19,
"five-second-avg": 6,
"one-minute-avg": 4,
"five-minute-avg": 4
},
{
"thread-index": 12,
"thread": "cpu12",
"current": 5,
"five-second-avg": 2,
"one-minute-avg": 3,
"five-minute-avg": 3
},
{
"thread-index": 13,
"thread": "cpu13",
"current": 5,
"five-second-avg": 2,
"one-minute-avg": 4,
"five-minute-avg": 4
},
{
"thread-index": 14,
"thread": "cpu14",
"current": 16,
"five-second-avg": 6,
"one-minute-avg": 4,
"five-minute-avg": 4
},
{
"thread-index": 15,
"thread": "cpu15",
"current": 6,
"five-second-avg": 2,
"one-minute-avg": 3,
"five-minute-avg": 3
},
{
"thread-index": 16,
"thread": "cpu16",
"current": 2,
"five-second-avg": 1,
"one-minute-avg": 1,
"five-minute-avg": 2
},
{
"thread-index": 17,
"thread": "cpu17",
"current": 1,
"five-second-avg": 1,
"one-minute-avg": 1,
"five-minute-avg": 1
},
{
"thread-index": 18,
"thread": "cpu18",
"current": 1,
"five-second-avg": 1,
"one-minute-avg": 1,
"five-minute-avg": 1
},
{
"thread-index": 19,
"thread": "cpu19",
"current": 35,
"five-second-avg": 18,
"one-minute-avg": 8,
"five-minute-avg": 7
},
{
"thread-index": 20,
"thread": "cpu20",
"current": 2,
"five-second-avg": 1,
"one-minute-avg": 3,
"five-minute-avg": 3
},
{
"thread-index": 21,
"thread": "cpu21",
"current": 6,
"five-second-avg": 5,
"one-minute-avg": 5,
"five-minute-avg": 5
},
{
"thread-index": 22,
"thread": "cpu22",
"current": 4,
"five-second-avg": 1,
"one-minute-avg": 3,
"five-minute-avg": 3
},
{
"thread-index": 23,
"thread": "cpu23",
"current": 5,
"five-second-avg": 2,
"one-minute-avg": 7,
"five-minute-avg": 4
},
{
"thread-index": 24,
"thread": "cpu24",
"current": 21,
"five-second-avg": 8,
"one-minute-avg": 5,
"five-minute-avg": 3
},
{
"thread-index": 25,
"thread": "cpu25",
"current": 8,
"five-second-avg": 2,
"one-minute-avg": 3,
"five-minute-avg": 4
},
{
"thread-index": 26,
"thread": "cpu26",
"current": 4,
"five-second-avg": 1,
"one-minute-avg": 2,
"five-minute-avg": 3
},
{
"thread-index": 27,
"thread": "cpu27",
"current": 5,
"five-second-avg": 1,
"one-minute-avg": 3,
"five-minute-avg": 3
},
{
"thread-index": 28,
"thread": "cpu28",
"current": 4,
"five-second-avg": 1,
"one-minute-avg": 3,
"five-minute-avg": 3
},
{
"thread-index": 29,
"thread": "cpu29",
"current": 3,
"five-second-avg": 3,
"one-minute-avg": 3,
"five-minute-avg": 3
},
{
"thread-index": 30,
"thread": "cpu30",
"current": 2,
"five-second-avg": 1,
"one-minute-avg": 2,
"five-minute-avg": 3
},
{
"thread-index": 31,
"thread": "cpu31",
"current": 3,
"five-second-avg": 2,
"one-minute-avg": 3,
"five-minute-avg": 3
}
]
}
}
}
}
Temperature Status from the API
You can monitor the rSeries Appliance temperature. The output will display the Current, Average, Minimum, and Maximum temperatures.
GET https://{{Appliance1_IP}}:8888/restconf/data/openconfig-platform:components/component=platform/state/f5-platform:temperature
{
    "f5-platform:temperature": {
        "current": "31.2",
        "average": "30.9",
        "minimum": "30.0",
        "maximum": "32.0"
    }
}
Memory Status from the API
The API call below shows the total system memory:
GET https://{{rseries_appliance1_ip}}:8888/restconf/data/openconfig-platform:components/component=platform/state/f5-platform:memory
{
    "f5-platform:memory": {
        "available": "6863855616",
        "free": "1378607104",
        "used-percent": 95
    }
}
Trusted Protection Module Status from the API
rSeries supports the Trusted Protection Module (TPM) to validate certain software has not been tampered with. You can query the last status check which is performed on boot:
GET https://{{rseries_appliance1_ip}}:8888/restconf/data/openconfig-platform:components/component=platform/state/f5-platform:tpm-integrity-status
{
    "f5-platform:tpm-integrity-status": "Valid"
}
Software Health and Status from the CLI
You can monitor the health of the underlying software and hardware using the following CLI commands.
F5 Cluster Status via CLI
This command will display the health of the underlying Kubernetes (K3S) cluster which powers the F5OS layer. They key is the last message at the bottom of the output K3S cluster is ready, this lets you know that the underlying K3S cluster is up running and healthy.
r5900-2# show cluster
cluster state
cluster disk-usage-threshold state warning-limit 85
cluster disk-usage-threshold state error-limit 90
cluster disk-usage-threshold state critical-limit 97
cluster disk-usage-threshold state growth-rate-limit 10
cluster disk-usage-threshold state interval 60
cluster nodes node node-1
state enabled      true
state node-running-state running
state platform fpga-state FPGA_RDY
state platform dma-agent-state DMA_AGENT_RDY
state node-info creation-time 2021-09-30T22:22:29Z
state node-info cpu 32
state node-info pods 110
state node-info memory 15730136Ki
state ready-info ready true
state ready-info last-transition-time 2022-01-17T10:17:36Z
state ready-info message "kubelet is posting ready status"
state out-of-disk-info last-transition-time ""
state out-of-disk-info message ""
state disk-pressure-info disk-pressure false
state disk-pressure-info last-transition-time 2021-11-30T03:14:47Z
state disk-pressure-info message "kubelet has no disk pressure"
state disk-usage used-percent 50
state disk-usage growth-rate 0
state disk-usage status in-range
DISK DATA  DISK DATA
NAME       VALUE
-------------------------
available  56439144448
capacity   117493108736
used       55061983232

TENANT
NAME     QAT DEVICE NAME   BDF
------------------------------------
tenant1  qat_dev_vf00pf00  53:01.0
        qat_dev_vf00pf01  54:01.0
        qat_dev_vf00pf02  55:01.0
        qat_dev_vf01pf00  53:01.1
        qat_dev_vf01pf01  54:01.1
        qat_dev_vf01pf02  55:01.1

NAMESPACE  TYPE    REASON   OBJECT                            MESSAGE
-----------------------------------------------------------------------------------------------
default    Normal  Created  VirtualMachineInstance/tenant1-1  VirtualMachineInstance defined.

STAGE NAME         STATUS  TIMESTAMP            VERSION
--------------------------------------------------------------
K3SClusterInstall  done    2021/09/30-22:22:30  1.21.1.1.7.0
K3SClusterUpgrade  done    2021/11/30-03:06:39  1.21.1.1.8.3

cluster cluster-status summary-status "K3S cluster is initialized and ready for use."
INDEX  STATUS
---------------------------------------------------------------------------------------------
0      2022-01-22 22:13:17.387346 -  applianceMainEventLoop::Orchestration manager startup.
1      2022-01-22 22:13:17.392742 -  Can now ping appliance-1.chassis.local (100.65.60.1).
2      2022-01-22 22:13:17.798753 -  Successfully ssh'd to appliance 127.0.0.1.
3      2022-01-22 22:13:23.293784 -  Appliance 1 is ready in k3s cluster.
4      2022-01-22 22:13:23.293868 -  K3S cluster is ready.
F5 DAG States via CLI
The command below displays the current DAG-states. DAG stands for Disaggregation, which is the process incoming connections go through to determine which TMM processor a connection should be sent to. There are various DAG algorithms that may be configured.
r5900-2# show dag-states
                                        COMMIT                         TENANT                                                     SDAG
TENANT              PUBLISHER  PUBLISH     TENANT    COMMIT      DAG      INSTANCE                                                   TABLE
NAME     PUBLISHER  INSTANCE   TIME        INSTANCE  TIME        VERSION  IDS       SDAG TABLE                                       HASH
--------------------------------------------------------------------------------------------------------------------------------------------
tenant1  dagd       1          1642891753  1         1642891753  16       [ 15 ]    f f f f f f f f f f f f f f f f f f f f f f f f  0

r5900-2#
Show FDB via CLI
The command below displays the Forwarding Database.
r5900-2# show fdb
                                                                                            NDI
MAC ADDRESS        VLAN  TAG TYPE      VLAN  TAG TYPE      VID   ENTRY TYPE   OWNER    AGE  ID    SVC  VTC  SEP  DMS  DID  CMDS  MIRRORING  INTERFACE
-------------------------------------------------------------------------------------------------------------------------------------------------------
00:94:a1:69:35:14  500   tag_type_vid  500   tag_type_vid  500   L2-LISTENER  tenant1  -    4095  8    -    -    -    -    1     -          -
00:94:a1:69:35:14  3010  tag_type_vid  3010  tag_type_vid  3010  L2-LISTENER  tenant1  -    4095  8    -    -    -    -    1     -          -
00:94:a1:69:35:14  3011  tag_type_vid  3011  tag_type_vid  3011  L2-LISTENER  tenant1  -    4095  8    -    -    -    -    1     -          -

r5900-2#
Show FPGA Tables via CLI
r5900-2# show fpga-tables
                                                                                                                                                                                                                                            RX
                                                        MCAST  MCAST                                                                                                                  RX                                                    DST
                                                    TX     RX     TX     RX     RX     RX     RX     RX     RX     RX     RX     TX     TX     TX     TX     TX     TX     TX     TX     MCAST             RX     TX                  TX       DIS    MIRROR  MIRROR
            RX PKT   RX BYTE    TX PKT   TX BYTE    OBUFF  FULL   FULL   COS0   COS1   COS2   COS3   COS4   COS5   COS6   COS7   COS0   COS1   COS2   COS3   COS4   COS5   COS6   COS7   PKT     RX MCAST  MCAST  MCAST    TX MCAST   MCAST    PKT    PKTS    BYTES
NAME        CNT      CNT        CNT      CNT        DROPS  DROPS  DROPS  DROPS  DROPS  DROPS  DROPS  DROPS  DROPS  DROPS  DROPS  DROPS  DROPS  DROPS  DROPS  DROPS  DROPS  DROPS  DROPS  CNT     BYTE CNT  DROPS  PKT CNT  BYTE CNT   DROPS    CNT    CNT     CNT
----------------------------------------------------------------------------------------------------------------------------------------------------------------------------------------------------------------------------------------------------------------------
port0_mod0  741483   106773552  1646401  237965206  0      0      0      0      0      0      0      0      0      0      0      0      0      0      0      0      0      0      0      60      6360      0      1929920  150506676  0        0      0       0
port1_mod0  0        0          0        0          0      0      0      0      0      0      0      0      0      0      0      0      0      0      0      0      0      0      0      0       0         0      0        0          0        0      0       0
port2_mod3  0        0          0        0          0      0      0      0      0      0      0      0      0      0      0      0      0      0      0      0      0      0      0      0       0         0      450      35184      1929470  0      0       0
port3_mod3  0        0          0        0          0      0      0      0      0      0      0      0      0      0      0      0      0      0      0      0      0      0      0      0       0         0      0        0          0        0      0       0
port4_mod4  0        0          0        0          0      0      0      0      0      0      0      0      0      0      0      0      0      0      0      0      0      0      0      0       0         0      450      35184      1929470  0      0       0
port5_mod5  0        0          0        0          0      0      0      0      0      0      0      0      0      0      0      0      0      0      0      0      0      0      0      0       0         0      450      35184      1929470  0      0       0
port6_mod1  372853   54581052   11963    1722672    0      0      0      0      0      0      0      0      0      0      0      0      0      0      0      0      0      0      0      939297  73409046  0      990623   77097630   0        0      0       0
port7_mod2  1273548  183384154  729520   105050880  0      0      0      0      0      0      0      0      0      0      0      0      0      0      0      0      0      0      0      990563  77091270  0      939357   73415406   0        0      0       0

r5900-2#
Show Port-Mappings via CLI
r5900-2# show port-mappings
                                                                            NUM
                                        CAPACITY  ALLOCATED  OVERSUBSCRIBE   ALLOCATED  MAX
NAME       INDEX       PIPELINE GROUP   BW        BW         STATUS          PORTS      PORTS  PORTS
-------------------------------------------------------------------------------------------------------------------------
default-1  PIPELINE-1  PIPELINEGROUP-1  100       200        OVERSUBSCRIBED  5          8      [ 1.0 3.0 4.0 5.0 6.0 ]
           PIPELINE-2  PIPELINEGROUP-1  100       200        OVERSUBSCRIBED  5          8      [ 10.0 2.0 7.0 8.0 9.0 ]

r5900-2#
Show Service-Instances via CLI
r5900-2# show service-instances
                                ATSE
            SLOT  INSTANCE    MOD                      TENANT  SERVICE  NUM   DM           SVC  DOS                                                                                           VLAN
TENANT NAME   ID    ID          ID    SERVICE TYPE       ID      IDS      SEPS  OFFSET  DID  GRP  GRP  TCO  WP  SP  TP  MSS  TC  WIN  WSCALE  SYNACKTTL  SYNACKHOPLIMIT  INDEX  S1  S2  S3  S4  ID    STATE
-------------------------------------------------------------------------------------------------------------------------------------------------------------------------------------------------------------
L2HostLearn   1     713434935   0     ST_SYSTEM_SERVICE  0       [ 2 ]    1     0       15   1    -    -    -   -   -   -    -   -    -       -          -               -      -   -   -   -
SwRbcaster-1  1     4039786245  0     ST_SYSTEM_SERVICE  0       [ 5 ]    1     0       15   3    -    -    -   -   -   -    -   -    -       -          -               -      -   -   -   -
lacpd         1     19377286    0     ST_SYSTEM_SERVICE  0       [ 1 ]    1     2       15   5    -    -    -   -   -   -    -   -    -       -          -               -      -   -   -   -
lldpd         1     1795340596  0     ST_SYSTEM_SERVICE  0       [ 4 ]    1     0       15   2    -    -    -   -   -   -    -   -    -       -          -               -      -   -   -   -
stpd          1     19377286    0     ST_SYSTEM_SERVICE  0       [ 3 ]    1     1       15   4    -    -    -   -   -   -    -   -    -       -          -               -      -   -   -   -
tenant1       1     2823180630  0     ST_TENANT_SERVICE  2       [ 8 ]    2     1       15   6    1    -    -   -   -   -    -   -    -       -          -               -      -   -   -   -

r5900-2#
Show Service-Pods via CLI
r5900-2# show service-pods
                                        SERVICE  POD           POD                                     POD
                        SERVICE         CLUSTER  SLOT  POD     RESTART  POD                            IMAGE
SERVICE NAME            CLUSTER IP      PORT     ID    STATUS  COUNT    STATE    POD MESSAGE           VERSION
----------------------------------------------------------------------------------------------------------------
compute                                 0        1     true    0        Running  Running Successfully  2.4.6
coredns                                 0        1     true    8        Running  Running Successfully  1.8.3
kube-flannel                            0        1     true    8        Running  Running Successfully  0.13.0
kube-multus                             0        1     true    8        Running  Running Successfully  3.6.0
lb-port-443                             0        1     true    8        Running  Running Successfully  v0.2.0
local-path-provisioner                  0        1     true    12       Running  Running Successfully  v0.0.19
metrics-server          100.75.29.109   443      1     true    8        Running  Running Successfully  v0.3.6
pause                                   0        1     true    8        Running  Running Successfully  3.1
traefik-ingress-lb                      0        1     true    8        Running  Running Successfully  2.4.8
virt-api                100.75.241.212  443      1     true    8        Running  Running Successfully  2.4.6
virt-controller                         0        1     true    12       Running  Running Successfully  2.4.6
virt-handler                            0        1     true    8        Running  Running Successfully  2.4.6
virt-operator                           0        1     true    12       Running  Running Successfully  2.4.6

r5900-2#
Show Services via CLI
r5900-2# show services
                                            USE                                       USE
SERVICE  HASH   FIELD   FULL        TUNNEL  IP     HASH   FIELD   FULL        TUNNEL  IP     TENANT
ID       ALG    SELECT  MASK  MASK  SELECT  PROTO  ALG    SELECT  MASK  MASK  SELECT  PROTO  NAME
------------------------------------------------------------------------------------------------------
8        dagv2  port    true        outer   false  dagv2  port    true        outer   false  tenant1

r5900-2#
Show VLAN-Listeners via CLI
r5900-2# show vlan-listeners
                                            NDI                                             SERVICE
INTERFACE        VLAN  ENTRY TYPE     OWNER    ID    SVC  VTC  SEP  DMS  DID  CMDS  MIRRORING  IDS
--------------------------------------------------------------------------------------------------------
Arista           3010  VLAN-LISTENER  tenant1  4095  8    -    15   -    -    -     disabled   -
Arista           3011  VLAN-LISTENER  tenant1  4095  8    -    15   -    -    -     disabled   -
HA-Interconnect  500   VLAN-LISTENER  tenant1  4095  8    -    15   -    -    -     disabled   -

r5900-2#
Software Health and Status from the webUI
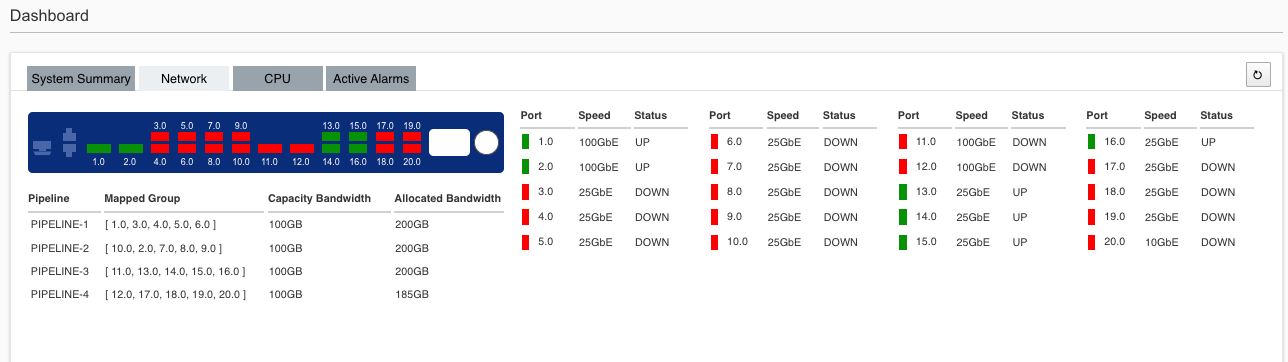
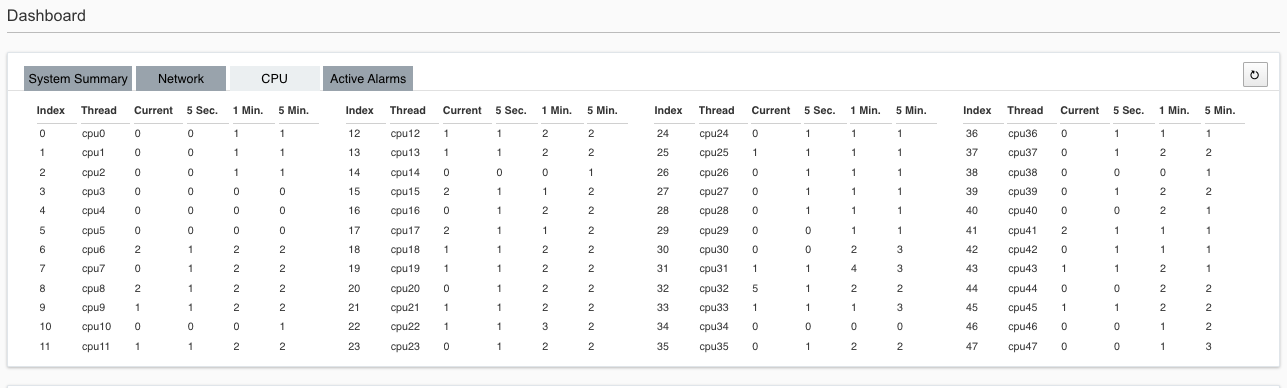
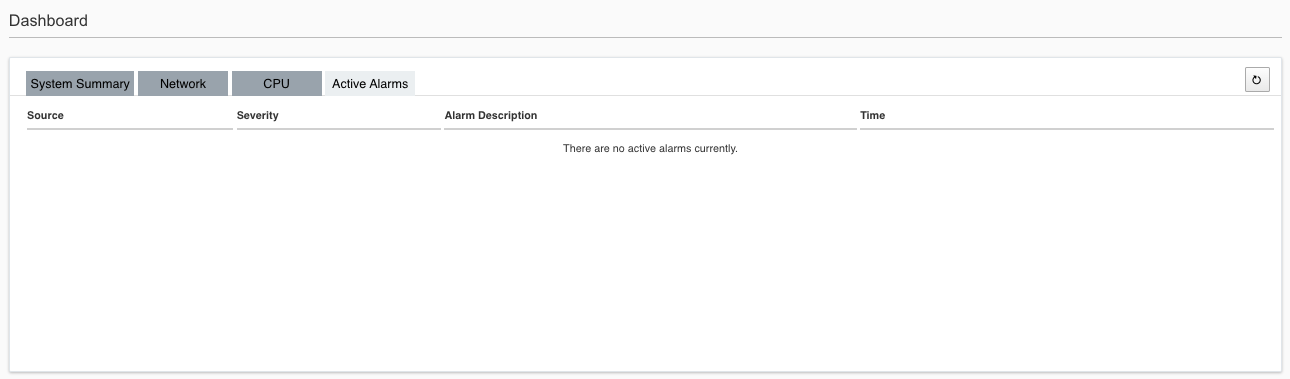
The rSeries Dashboard will provide a visual system summary of the appliance including System Summary, Network, CPU, and Active Alarms. It will also list the total number of vCPUs available for multitenancy and how many are currently in use. There is also a tenant overview showing a quick summary of tenant status and basic parameters.

The Network tab will provide a visual representation of all networking ports on the system. Each port will be color coded Green for Up status, and Red or Down status. The current Pipeline mapping is also displayed which shows the external port mapping to internal pipelines.
The CPU tab shows all the available CPU’s in the system, along with their Current, 5 Second, 1 Minute, and 5 Minute averages.
The Active Alarms tab will display any active alerts or alarms for the system.
Software Health and Status from the API
F5 Cluster Status via API
This command will display the health of the underlying Kubernetes (K3S) cluster which powers the F5OS layer. They key is the last message at the bottom of the output K3S cluster is ready, this lets you know that the underlying K3S cluster is up running and healthy.
GET https://{{rseries_appliance1_ip}}:8888/restconf/data/f5-cluster:cluster
{
    "f5-cluster:cluster": {
        "nodes": {
            "node": [
                {
                    "name": "node-1",
                    "config": {
                        "name": "node-1",
                        "enabled": true
                    },
                    "state": {
                        "enabled": true,
                        "node-running-state": "running",
                        "platform": {
                            "fpga-state": "FPGA_RDY",
                            "dma-agent-state": "DMA_AGENT_RDY"
                        },
                        "node-info": {
                            "creation-time": "2021-09-30T22:22:29Z",
                            "cpu": 32,
                            "pods": 110,
                            "memory": "15730136Ki"
                        },
                        "ready-info": {
                            "ready": true,
                            "last-transition-time": "2022-01-17T10:17:36Z",
                            "message": "kubelet is posting ready status"
                        },
                        "out-of-disk-info": {
                            "last-transition-time": "",
                            "message": ""
                        },
                        "disk-pressure-info": {
                            "disk-pressure": false,
                            "last-transition-time": "2021-11-30T03:14:47Z",
                            "message": "kubelet has no disk pressure"
                        },
                        "disk-data": {
                            "stats": [
                                {
                                    "disk-data-name": "available",
                                    "disk-data-value": "56390660096"
                                },
                                {
                                    "disk-data-name": "capacity",
                                    "disk-data-value": "117493108736"
                                },
                                {
                                    "disk-data-name": "used",
                                    "disk-data-value": "55110467584"
                                }
                            ]
                        },
                        "cryptos": {
                            "tenants": {
                                "tenant": [
                                    {
                                        "tenant-name": "tenant1",
                                        "devices": {
                                            "device": [
                                                {
                                                    "qat-device-name": "qat_dev_vf00pf00",
                                                    "bdf": "53:01.0"
                                                },
                                                {
                                                    "qat-device-name": "qat_dev_vf00pf01",
                                                    "bdf": "54:01.0"
                                                },
                                                {
                                                    "qat-device-name": "qat_dev_vf00pf02",
                                                    "bdf": "55:01.0"
                                                },
                                                {
                                                    "qat-device-name": "qat_dev_vf01pf00",
                                                    "bdf": "53:01.1"
                                                },
                                                {
                                                    "qat-device-name": "qat_dev_vf01pf01",
                                                    "bdf": "54:01.1"
                                                },
                                                {
                                                    "qat-device-name": "qat_dev_vf01pf02",
                                                    "bdf": "55:01.1"
                                                }
                                            ]
                                        }
                                    }
                                ]
                            }
                        },
                        "f5-disk-usage-threshold:disk-usage": {
                            "used-percent": 50,
                            "growth-rate": 0,
                            "status": "in-range"
                        }
                    }
                }
            ]
        },
        "f5-cluster-event-log:events": {
            "event": [
                {
                    "namespace": "default",
                    "type": "Normal",
                    "reason": "Created",
                    "object": "VirtualMachineInstance/tenant1-1",
                    "message": "VirtualMachineInstance defined."
                }
            ]
        },
        "f5-cluster-status:install-status": {
            "install-status": [
                {
                    "stage-name": "K3SClusterInstall",
                    "status": "done",
                    "timestamp": "2021/09/30-22:22:30",
                    "version": "1.21.1.1.7.0"
                },
                {
                    "stage-name": "K3SClusterUpgrade",
                    "status": "done",
                    "timestamp": "2021/11/30-03:06:39",
                    "version": "1.21.1.1.8.3"
                }
            ]
        },
        "f5-cluster-status:cluster-status": {
            "cluster-status": [
                {
                    "status": "2022-01-22 22:13:17.387346 -  applianceMainEventLoop::Orchestration manager startup."
                },
                {
                    "status": "2022-01-22 22:13:17.392742 -  Can now ping appliance-1.chassis.local (100.65.60.1)."
                },
                {
                    "status": "2022-01-22 22:13:17.798753 -  Successfully ssh'd to appliance 127.0.0.1."
                },
                {
                    "status": "2022-01-22 22:13:23.293784 -  Appliance 1 is ready in k3s cluster."
                },
                {
                    "status": "2022-01-22 22:13:23.293868 -  K3S cluster is ready."
                }
            ],
            "summary-status": "K3S cluster is initialized and ready for use."
        },
        "f5-disk-usage-threshold:disk-usage-threshold": {
            "state": {
                "warning-limit": 85,
                "error-limit": 90,
                "critical-limit": 97,
                "growth-rate-limit": 10,
                "interval": 60
            },
            "config": {
                "warning-limit": 85,
                "error-limit": 90,
                "critical-limit": 97,
                "growth-rate-limit": 10,
                "interval": 60
            }
        }
    }
}
F5 Service Instances Status
This API call displays some of the software processes running within the F5OS platform layer for networking. You can see processes for lacpd, stpd,lldpd etc..
GET https://{{rseries_appliance1_ip}}:8888/restconf/data/f5-service-instances:service-instances
{
    "f5-service-instances:service-instances": {
        "service-instance": [
            {
                "tenant-name": "L2HostLearn",
                "slot-id": 1,
                "instance-id": 713434935,
                "atse-mod-id": 0,
                "service-type": "ST_SYSTEM_SERVICE",
                "tenant-id": 0,
                "service-ids": [
                    2
                ],
                "num-seps": 1,
                "dm-offset": 0,
                "did": 15,
                "svc-grp": 1
            },
            {
                "tenant-name": "SwRbcaster-1",
                "slot-id": 1,
                "instance-id": 4039786245,
                "atse-mod-id": 0,
                "service-type": "ST_SYSTEM_SERVICE",
                "tenant-id": 0,
                "service-ids": [
                    5
                ],
                "num-seps": 1,
                "dm-offset": 0,
                "did": 15,
                "svc-grp": 3
            },
            {
                "tenant-name": "lacpd",
                "slot-id": 1,
                "instance-id": 19377286,
                "atse-mod-id": 0,
                "service-type": "ST_SYSTEM_SERVICE",
                "tenant-id": 0,
                "service-ids": [
                    1
                ],
                "num-seps": 1,
                "dm-offset": 2,
                "did": 15,
                "svc-grp": 5
            },
            {
                "tenant-name": "lldpd",
                "slot-id": 1,
                "instance-id": 1795340596,
                "atse-mod-id": 0,
                "service-type": "ST_SYSTEM_SERVICE",
                "tenant-id": 0,
                "service-ids": [
                    4
                ],
                "num-seps": 1,
                "dm-offset": 0,
                "did": 15,
                "svc-grp": 2
            },
            {
                "tenant-name": "stpd",
                "slot-id": 1,
                "instance-id": 19377286,
                "atse-mod-id": 0,
                "service-type": "ST_SYSTEM_SERVICE",
                "tenant-id": 0,
                "service-ids": [
                    3
                ],
                "num-seps": 1,
                "dm-offset": 1,
                "did": 15,
                "svc-grp": 4
            },
            {
                "tenant-name": "tenant1",
                "slot-id": 1,
                "instance-id": 2829878451,
                "atse-mod-id": 0,
                "service-type": "ST_TENANT_SERVICE",
                "tenant-id": 2,
                "service-ids": [
                    8
                ],
                "num-seps": 2,
                "dm-offset": 1,
                "did": 15,
                "svc-grp": 6,
                "dos-grp": 1,
                "f5-tcp-syn-cookie:tcp-syn-cookie": {
                    "secret-info": {
                        "index": "SECRET_IDX_ZERO",
                        "s1": 482533104,
                        "s2": 833816436,
                        "s3": 3837806693,
                        "s4": 4163314411
                    }
                }
            }
        ]
    }
}
F5 Services Status
GET https://{{rseries_appliance1_ip}}:8888/restconf/data/f5-services:services
{
    "f5-services:services": {
        "service": [
            {
                "service_id": 8,
                "tier1_dag_profile": {
                    "hash_alg": "dagv2",
                    "field_select": "port",
                    "full_mask": true,
                    "mask": "",
                    "tunnel_select": "outer",
                    "use_ip_proto": false
                },
                "tier2_dag_profile": {
                    "hash_alg": "dagv2",
                    "field_select": "port",
                    "full_mask": true,
                    "mask": "",
                    "tunnel_select": "outer",
                    "use_ip_proto": false
                },
                "tenant_name": "tenant1"
            }
        ]
    }
}
Layer2 FDB Status
This API call displays the Forwarding Database:
GET https://{{rseries_appliance1_ip}}:8888/restconf/data/f5-l2fdb:fdb
{
    "f5-l2fdb:fdb": {
        "mac-table": {
            "entries": {
                "entry": [
                    {
                        "mac-address": "00:94:a1:69:35:14",
                        "vlan": 500,
                        "tag-type": "tag_type_vid",
                        "config": {
                            "mac-address": "00:94:a1:69:35:14",
                            "vlan": 500,
                            "tag-type": "tag_type_vid",
                            "vid": 500,
                            "entry-type": "L2-LISTENER",
                            "owner": "tenant1",
                            "ifh-fields": {
                                "ndi-id": 4095,
                                "svc": 8,
                                "cmds": 1,
                                "mirroring": "disabled"
                            }
                        },
                        "state": {
                            "vlan": 500,
                            "tag-type": "tag_type_vid",
                            "vid": 500,
                            "entry-type": "L2-LISTENER",
                            "owner": "tenant1",
                            "ifh-fields": {
                                "ndi-id": 4095,
                                "svc": 8,
                                "cmds": 1
                            }
                        }
                    },
                    {
                        "mac-address": "00:94:a1:69:35:14",
                        "vlan": 3010,
                        "tag-type": "tag_type_vid",
                        "config": {
                            "mac-address": "00:94:a1:69:35:14",
                            "vlan": 3010,
                            "tag-type": "tag_type_vid",
                            "vid": 3010,
                            "entry-type": "L2-LISTENER",
                            "owner": "tenant1",
                            "ifh-fields": {
                                "ndi-id": 4095,
                                "svc": 8,
                                "cmds": 1,
                                "mirroring": "disabled"
                            }
                        },
                        "state": {
                            "vlan": 3010,
                            "tag-type": "tag_type_vid",
                            "vid": 3010,
                            "entry-type": "L2-LISTENER",
                            "owner": "tenant1",
                            "ifh-fields": {
                                "ndi-id": 4095,
                                "svc": 8,
                                "cmds": 1
                            }
                        }
                    },
                    {
                        "mac-address": "00:94:a1:69:35:14",
                        "vlan": 3011,
                        "tag-type": "tag_type_vid",
                        "config": {
                            "mac-address": "00:94:a1:69:35:14",
                            "vlan": 3011,
                            "tag-type": "tag_type_vid",
                            "vid": 3011,
                            "entry-type": "L2-LISTENER",
                            "owner": "tenant1",
                            "ifh-fields": {
                                "ndi-id": 4095,
                                "svc": 8,
                                "cmds": 1,
                                "mirroring": "disabled"
                            }
                        },
                        "state": {
                            "vlan": 3011,
                            "tag-type": "tag_type_vid",
                            "vid": 3011,
                            "entry-type": "L2-LISTENER",
                            "owner": "tenant1",
                            "ifh-fields": {
                                "ndi-id": 4095,
                                "svc": 8,
                                "cmds": 1
                            }
                        }
                    }
                ]
            }
        }
    }
}
F5 Service-Pods Status
The following API call displays the service-pods running inside the F5OS layer:
GET https://{{Appliance1_IP}}:8888/restconf/data/f5-service-pod:service-pods
{
    "f5-service-pod:service-pods": {
        "service-pod": [
            {
                "service-name": "compute",
                "service-cluster-ip": "",
                "service-cluster-port": "0",
                "pod-slot-id": 1,
                "pod-status": "true",
                "pod-restart-count": 0,
                "pod-state": "Running",
                "pod-message": "Running Successfully",
                "pod-image-version": "2.4.6"
            },
            {
                "service-name": "coredns",
                "service-cluster-ip": "",
                "service-cluster-port": "0",
                "pod-slot-id": 1,
                "pod-status": "true",
                "pod-restart-count": 8,
                "pod-state": "Running",
                "pod-message": "Running Successfully",
                "pod-image-version": "1.8.3"
            },
            {
                "service-name": "kube-flannel",
                "service-cluster-ip": "",
                "service-cluster-port": "0",
                "pod-slot-id": 1,
                "pod-status": "true",
                "pod-restart-count": 8,
                "pod-state": "Running",
                "pod-message": "Running Successfully",
                "pod-image-version": "0.13.0"
            },
            {
                "service-name": "kube-multus",
                "service-cluster-ip": "",
                "service-cluster-port": "0",
                "pod-slot-id": 1,
                "pod-status": "true",
                "pod-restart-count": 8,
                "pod-state": "Running",
                "pod-message": "Running Successfully",
                "pod-image-version": "3.6.0"
            },
            {
                "service-name": "lb-port-443",
                "service-cluster-ip": "",
                "service-cluster-port": "0",
                "pod-slot-id": 1,
                "pod-status": "true",
                "pod-restart-count": 8,
                "pod-state": "Running",
                "pod-message": "Running Successfully",
                "pod-image-version": "v0.2.0"
            },
            {
                "service-name": "local-path-provisioner",
                "service-cluster-ip": "",
                "service-cluster-port": "0",
                "pod-slot-id": 1,
                "pod-status": "true",
                "pod-restart-count": 11,
                "pod-state": "Running",
                "pod-message": "Running Successfully",
                "pod-image-version": "v0.0.19"
            },
            {
                "service-name": "metrics-server",
                "service-cluster-ip": "100.75.29.109",
                "service-cluster-port": "443",
                "pod-slot-id": 1,
                "pod-status": "true",
                "pod-restart-count": 8,
                "pod-state": "Running",
                "pod-message": "Running Successfully",
                "pod-image-version": "v0.3.6"
            },
            {
                "service-name": "pause",
                "service-cluster-ip": "",
                "service-cluster-port": "0",
                "pod-slot-id": 1,
                "pod-status": "true",
                "pod-restart-count": 8,
                "pod-state": "Running",
                "pod-message": "Running Successfully",
                "pod-image-version": "3.1"
            },
            {
                "service-name": "traefik-ingress-lb",
                "service-cluster-ip": "",
                "service-cluster-port": "0",
                "pod-slot-id": 1,
                "pod-status": "true",
                "pod-restart-count": 8,
                "pod-state": "Running",
                "pod-message": "Running Successfully",
                "pod-image-version": "2.4.8"
            },
            {
                "service-name": "virt-api",
                "service-cluster-ip": "100.75.241.212",
                "service-cluster-port": "443",
                "pod-slot-id": 1,
                "pod-status": "true",
                "pod-restart-count": 8,
                "pod-state": "Running",
                "pod-message": "Running Successfully",
                "pod-image-version": "2.4.6"
            },
            {
                "service-name": "virt-controller",
                "service-cluster-ip": "",
                "service-cluster-port": "0",
                "pod-slot-id": 1,
                "pod-status": "true",
                "pod-restart-count": 8,
                "pod-state": "Running",
                "pod-message": "Running Successfully",
                "pod-image-version": "2.4.6"
            },
            {
                "service-name": "virt-handler",
                "service-cluster-ip": "",
                "service-cluster-port": "0",
                "pod-slot-id": 1,
                "pod-status": "true",
                "pod-restart-count": 8,
                "pod-state": "Running",
                "pod-message": "Running Successfully",
                "pod-image-version": "2.4.6"
            },
            {
                "service-name": "virt-operator",
                "service-cluster-ip": "",
                "service-cluster-port": "0",
                "pod-slot-id": 1,
                "pod-status": "true",
                "pod-restart-count": 11,
                "pod-state": "Running",
                "pod-message": "Running Successfully",
                "pod-image-version": "2.4.6"
            }
        ]
    }
}
System Health
The following API call displays the details used to feed the overall system health. Note this API call will return a lot of status details:
GET https://{{rseries_appliance1_ip}}:8888/restconf/data/openconfig-system:system/f5-system-health:health
{
"f5-system-health:health": {
"components": {
"component": [
{
"name": "appliance",
"hardware": [
{
"key": "appliance/hardware/cpu",
"state": {
"name": "CPU",
"health": "ok",
"severity": "info"
},
"attributes": {
"attribute": [
{
"name": "cpu:core:temperature",
"description": "CPU core temperature (C)",
"health": "ok",
"severity": "info",
"value": "",
"updatedAt": "2021-09-24T20:42:13Z"
},
{
"name": "cpu:state:fatal-error-fault",
"description": "Fatal error",
"health": "ok",
"severity": "info",
"value": "0",
"updatedAt": "2022-01-22T22:13:38Z"
},
{
"name": "cpu:state:fivr-fault",
"description": "FIVR Fault",
"health": "ok",
"severity": "info",
"value": "0",
"updatedAt": "2022-01-22T22:13:38Z"
},
{
"name": "cpu:state:hw-correctable-error-fault",
"description": "Hardware correctable error",
"health": "ok",
"severity": "info",
"value": "0",
"updatedAt": "2022-01-22T22:13:38Z"
},
{
"name": "cpu:state:internal-error-fault",
"description": "internal unrecoverable error",
"health": "ok",
"severity": "info",
"value": "0",
"updatedAt": "2022-01-22T22:13:38Z"
},
{
"name": "cpu:state:machine-check-error",
"description": "Machine check error",
"health": "ok",
"severity": "info",
"value": "0",
"updatedAt": "2022-01-22T22:13:38Z"
},
{
"name": "cpu:state:non-fatal-error-fault",
"description": "Non-fatal error",
"health": "ok",
"severity": "info",
"value": "0",
"updatedAt": "2022-01-22T22:13:38Z"
},
{
"name": "cpu:state:processor-hot-fault",
"description": "Processor hot Fault",
"health": "ok",
"severity": "info",
"value": "0",
"updatedAt": "2022-01-22T22:13:38Z"
},
{
"name": "cpu:state:thermal-trip-fault",
"description": "Thermal Trip Fault",
"health": "ok",
"severity": "info",
"value": "0",
"updatedAt": "2022-01-22T22:13:38Z"
},
{
"name": "rasdaemon:extlog:invalid-address",
"description": "RAS Extlog invalid address event",
"health": "ok",
"severity": "info",
"value": "",
"updatedAt": "2022-01-22T22:13:25Z"
},
{
"name": "rasdaemon:extlog:master-abort",
"description": "RAS Extlog master abort event",
"health": "ok",
"severity": "info",
"value": "",
"updatedAt": "2022-01-22T22:13:25Z"
},
{
"name": "rasdaemon:extlog:memory-sparing",
"description": "RAS Extlog memory sparing event",
"health": "ok",
"severity": "info",
"value": "",
"updatedAt": "2022-01-22T22:13:25Z"
},
{
"name": "rasdaemon:extlog:mirror-broken",
"description": "RAS Extlog mirror broken event",
"health": "ok",
"severity": "info",
"value": "",
"updatedAt": "2022-01-22T22:13:25Z"
},
{
"name": "rasdaemon:extlog:multi-bit-ecc",
"description": "RAS Extlog mullti-bit ECC event",
"health": "ok",
"severity": "info",
"value": "",
"updatedAt": "2022-01-22T22:13:25Z"
},
{
"name": "rasdaemon:extlog:multi-symbol-chipkill-ecc",
"description": "RAS Extlog multi-symbol chipkill ECC event",
"health": "ok",
"severity": "info",
"value": "",
"updatedAt": "2022-01-22T22:13:25Z"
},
{
"name": "rasdaemon:extlog:no-error",
"description": "RAS Extlog no error event",
"health": "ok",
"severity": "info",
"value": "",
"updatedAt": "2022-01-22T22:13:25Z"
},
{
"name": "rasdaemon:extlog:parity-error",
"description": "RAS Extlog parity error event",
"health": "ok",
"severity": "info",
"value": "",
"updatedAt": "2022-01-22T22:13:25Z"
},
{
"name": "rasdaemon:extlog:physical-memory-map-out-event",
"description": "RAS Extlog physical memory map-out event",
"health": "ok",
"severity": "info",
"value": "",
"updatedAt": "2022-01-22T22:13:25Z"
},
{
"name": "rasdaemon:extlog:scrub-corrected-error",
"description": "RAS Extlog scrub corrected error",
"health": "ok",
"severity": "info",
"value": "",
"updatedAt": "2022-01-22T22:13:25Z"
},
{
"name": "rasdaemon:extlog:scrub-uncorrected-error",
"description": "RAS Extlog scrub uncorrected error",
"health": "ok",
"severity": "info",
"value": "",
"updatedAt": "2022-01-22T22:13:25Z"
},
{
"name": "rasdaemon:extlog:single-bit-ecc",
"description": "RAS Extlog single-bit ECC event",
"health": "ok",
"severity": "info",
"value": "",
"updatedAt": "2022-01-22T22:13:25Z"
},
{
"name": "rasdaemon:extlog:single-symbol-chipkill-ecc",
"description": "RAS Extlog single-symbol chipkill ECC event",
"health": "ok",
"severity": "info",
"value": "",
"updatedAt": "2022-01-22T22:13:25Z"
},
{
"name": "rasdaemon:extlog:target-abort",
"description": "RAS Extlog target abort event",
"health": "ok",
"severity": "info",
"value": "",
"updatedAt": "2022-01-22T22:13:25Z"
},
{
"name": "rasdaemon:extlog:unknown",
"description": "RAS Extlog unknown event",
"health": "ok",
"severity": "info",
"value": "",
"updatedAt": "2022-01-22T22:13:25Z"
},
{
"name": "rasdaemon:extlog:unknown-type",
"description": "RAS Extlog unknown type",
"health": "ok",
"severity": "info",
"value": "",
"updatedAt": "2022-01-22T22:13:25Z"
},
{
"name": "rasdaemon:extlog:watchdog-timeout",
"description": "RAS Extlog watchdog timeout event",
"health": "ok",
"severity": "info",
"value": "",
"updatedAt": "2022-01-22T22:13:25Z"
},
{
"name": "rasdaemon:mce:address-command-error",
"description": "RAS MCE address/Command error",
"health": "ok",
"severity": "info",
"value": "0",
"updatedAt": "2022-01-24T05:28:38Z"
},
{
"name": "rasdaemon:mce:generic-undefined-request",
"description": "RAS MCE generic undefined request",
"health": "ok",
"severity": "info",
"value": "0",
"updatedAt": "2022-01-24T05:28:38Z"
},
{
"name": "rasdaemon:mce:memory-read-error",
"description": "RAS MCE memory read error",
"health": "ok",
"severity": "info",
"value": "0",
"updatedAt": "2022-01-24T05:28:38Z"
},
{
"name": "rasdaemon:mce:memory-scrubbing-error",
"description": "RAS MCE memory scrubbing error",
"health": "ok",
"severity": "info",
"value": "0",
"updatedAt": "2022-01-24T05:28:38Z"
},
{
"name": "rasdaemon:mce:memory-write-error",
"description": "RAS MCE memory write error",
"health": "ok",
"severity": "info",
"value": "0",
"updatedAt": "2022-01-24T05:28:38Z"
},
{
"name": "rasdaemon:mce:processor-temp-throttling",
"description": "RAS MCE processor temperature throttling",
"health": "ok",
"severity": "info",
"value": "0",
"updatedAt": "2022-01-24T05:28:38Z"
},
{
"name": "rasdaemon:mce:unknown-event",
"description": "RAS MCE unknown error",
"health": "ok",
"severity": "info",
"value": "0",
"updatedAt": "2022-01-24T05:28:38Z"
},
{
"name": "v6h:cpu-fault:msmi-bit",
"description": "MSMI fault",
"health": "ok",
"severity": "info",
"value": "0",
"updatedAt": "2022-01-22T22:13:38Z"
},
{
"name": "v6h:power-domain:cpu:0p6v-vttabcd",
"description": "CPU_0P6V_VTT_ABCD power fault",
"health": "ok",
"severity": "info",
"value": "0",
"updatedAt": "2022-01-22T22:13:37Z"
},
{
"name": "v6h:power-domain:cpu:0p6v-vttefgh",
"description": "CPU_0P6V_VTT_EFGH power fault",
"health": "ok",
"severity": "info",
"value": "0",
"updatedAt": "2022-01-22T22:13:37Z"
},
{
"name": "v6h:power-domain:cpu:0p85v-pvsa",
"description": "CPU_0P85V_PVSA power fault",
"health": "ok",
"severity": "info",
"value": "0",
"updatedAt": "2022-01-22T22:13:37Z"
},
{
"name": "v6h:power-domain:cpu:1p0v-pvccana",
"description": "CPU_1P0V_PVCCANA power fault",
"health": "ok",
"severity": "info",
"value": "0",
"updatedAt": "2022-01-22T22:13:37Z"
},
{
"name": "v6h:power-domain:cpu:1p0v-pvccio",
"description": "CPU_1P0V_PVCCIO power fault",
"health": "ok",
"severity": "info",
"value": "0",
"updatedAt": "2022-01-22T22:13:37Z"
},
{
"name": "v6h:power-domain:cpu:1p2v-vddqabcd",
"description": "CPU_1P2V_VDDQ_ABCD power fault",
"health": "ok",
"severity": "info",
"value": "0",
"updatedAt": "2022-01-22T22:13:37Z"
},
{
"name": "v6h:power-domain:cpu:1p2v-vddqefgh",
"description": "CPU_1P2V_VDDQ_EFGH power fault",
"health": "ok",
"severity": "info",
"value": "0",
"updatedAt": "2022-01-22T22:13:37Z"
},
{
"name": "v6h:power-domain:cpu:1p8v-cpu",
"description": "CPU_1P8V_CPU power fault",
"health": "ok",
"severity": "info",
"value": "0",
"updatedAt": "2022-01-22T22:13:37Z"
},
{
"name": "v6h:power-domain:cpu:1p8v-pvccin",
"description": "CPU_1P8V_PVCCIN power fault",
"health": "ok",
"severity": "info",
"value": "0",
"updatedAt": "2022-01-22T22:13:37Z"
},
{
"name": "v6h:power-domain:cpu:2p5v-vppabcd",
"description": "CPU_2P5V_VPP_ABCD power fault",
"health": "ok",
"severity": "info",
"value": "0",
"updatedAt": "2022-01-22T22:13:37Z"
},
{
"name": "v6h:power-domain:cpu:2p5v-vppefgh",
"description": "CPU_2P5V_VPP_EFGH power fault",
"health": "ok",
"severity": "info",
"value": "0",
"updatedAt": "2022-01-22T22:13:37Z"
},
{
"name": "v6h:thermal-fault:cpu:mem-hot",
"description": "CPU_MEMHOT thermal fault",
"health": "ok",
"severity": "info",
"value": "0",
"updatedAt": "2022-01-22T22:13:52Z"
},
{
"name": "v6h:thermal-fault:cpu:mem-trip",
"description": "CPU_MEMTRIP thermal fault",
"health": "ok",
"severity": "info",
"value": "0",
"updatedAt": "2022-01-22T22:13:38Z"
},
{
"name": "v6h:thermal-fault:pch:hot",
"description": "PCH_HOT thermal fault",
"health": "ok",
"severity": "info",
"value": "0",
"updatedAt": "2022-01-22T22:13:38Z"
},
{
"name": "v6h:thermal-fault:pch:vnn-vr-hot",
"description": "PCH_VNN_VR_HOT thermal fault",
"health": "ok",
"severity": "info",
"value": "0",
"updatedAt": "2022-01-22T22:13:38Z"
},
{
"name": "v6h:thermal-fault:pvccin-vr-hot",
"description": "PVCCIN_VR_HOT thermal fault",
"health": "ok",
"severity": "info",
"value": "0",
"updatedAt": "2022-01-22T22:13:38Z"
},
{
"name": "v6h:thermal-fault:vcciosa-vr-hot",
"description": "VCCIOSA_VR_HOT thermal fault",
"health": "ok",
"severity": "info",
"value": "0",
"updatedAt": "2022-01-22T22:13:38Z"
}
]
}
},
{
"key": "appliance/hardware/cpu/pcie",
"state": {
"name": "PCIe BUS",
"health": "ok",
"severity": "info"
},
"attributes": {
"attribute": [
{
"name": "rasdaemon:aer:correctable:advisory-non-fatal",
"description": "RAS AER 'Advisory Non-Fatal' correctable error",
"health": "ok",
"severity": "info",
"value": "0",
"updatedAt": "2022-01-24T05:28:38Z"
},
{
"name": "rasdaemon:aer:correctable:bad-dllp",
"description": "RAS AER 'Bad DLLP' correctable error",
"health": "ok",
"severity": "info",
"value": "0",
"updatedAt": "2022-01-24T05:28:38Z"
},
{
"name": "rasdaemon:aer:correctable:bad-tlp",
"description": "RAS AER 'Bad TLP' correctable error",
"health": "ok",
"severity": "info",
"value": "0",
"updatedAt": "2022-01-24T05:28:38Z"
},
{
"name": "rasdaemon:aer:correctable:receiver-error",
"description": "RAS AER 'Receiver Error' correctable error",
"health": "ok",
"severity": "info",
"value": "0",
"updatedAt": "2022-01-24T05:28:38Z"
},
{
"name": "rasdaemon:aer:correctable:replay-num-rollover",
"description": "RAS AER 'RELAY_NUM Rollover' correctable error",
"health": "ok",
"severity": "info",
"value": "0",
"updatedAt": "2022-01-24T05:28:38Z"
},
{
"name": "rasdaemon:aer:correctable:replay-timer-timeout",
"description": "RAS AER 'Replay Timer Timeout' correctable error",
"health": "ok",
"severity": "info",
"value": "0",
"updatedAt": "2022-01-24T05:28:38Z"
},
{
"name": "rasdaemon:aer:uncorrectable:completer-abort",
"description": "RAS AER 'Completer Abort' uncorrectable error",
"health": "ok",
"severity": "info",
"value": "0",
"updatedAt": "2022-01-24T05:28:38Z"
},
{
"name": "rasdaemon:aer:uncorrectable:completion-timeout",
"description": "RAS AER 'Completion Timeout' uncorrectable error",
"health": "ok",
"severity": "info",
"value": "0",
"updatedAt": "2022-01-24T05:28:38Z"
},
{
"name": "rasdaemon:aer:uncorrectable:data-link-protocol",
"description": "RAS AER 'Data Link Protocol' uncorrectable error",
"health": "ok",
"severity": "info",
"value": "0",
"updatedAt": "2022-01-24T05:28:38Z"
},
{
"name": "rasdaemon:aer:uncorrectable:ecrc",
"description": "RAS AER 'ECRC' uncorrectable error",
"health": "ok",
"severity": "info",
"value": "0",
"updatedAt": "2022-01-24T05:28:38Z"
},
{
"name": "rasdaemon:aer:uncorrectable:flow-control-protocol",
"description": "RAS AER 'Flow Control Protocol' uncorrectable error",
"health": "ok",
"severity": "info",
"value": "0",
"updatedAt": "2022-01-24T05:28:38Z"
},
{
"name": "rasdaemon:aer:uncorrectable:malformed-tlp",
"description": "RAS AER 'Malformed TLP' uncorrectable error",
"health": "ok",
"severity": "info",
"value": "0",
"updatedAt": "2022-01-24T05:28:38Z"
},
{
"name": "rasdaemon:aer:uncorrectable:poisoned-tlp",
"description": "RAS AER 'Poisoned TLP' uncorrectable error",
"health": "ok",
"severity": "info",
"value": "0",
"updatedAt": "2022-01-24T05:28:38Z"
},
{
"name": "rasdaemon:aer:uncorrectable:receiver-overflow",
"description": "RAS AER 'Receiver Overflow' uncorrectable error",
"health": "ok",
"severity": "info",
"value": "0",
"updatedAt": "2022-01-24T05:28:38Z"
},
{
"name": "rasdaemon:aer:uncorrectable:unexpected-completion",
"description": "RAS AER 'Unexpected Completion' uncorrectable error",
"health": "ok",
"severity": "info",
"value": "0",
"updatedAt": "2022-01-24T05:28:38Z"
},
{
"name": "rasdaemon:aer:uncorrectable:unsupported-request",
"description": "RAS AER 'Unsupported Request' uncorrectable error",
"health": "ok",
"severity": "info",
"value": "0",
"updatedAt": "2022-01-24T05:28:38Z"
},
{
"name": "rasdaemon:aer:unknown-event",
"description": "RAS AER 'unknown' error",
"health": "ok",
"severity": "info",
"value": "0",
"updatedAt": "2022-01-24T05:28:38Z"
}
]
}
},
{
"key": "appliance/hardware/drives",
"state": {
"name": "Drives",
"health": "ok",
"severity": "info"
},
"attributes": {
"attribute": [
{
"name": "drives:capacity",
"description": "Drive Capacity",
"health": "ok",
"severity": "info",
"value": "50",
"updatedAt": "2022-01-24T05:00:04Z"
},
{
"name": "drives:disk-usage-growth-rate",
"description": "Drive capacity Growth Rate",
"health": "ok",
"severity": "info",
"value": "0",
"updatedAt": "2022-01-24T05:00:04Z"
}
]
}
},
{
"key": "appliance/hardware/fpga/asw",
"state": {
"name": "FPGA ASW",
"health": "ok",
"severity": "notice"
},
"attributes": {
"attribute": [
{
"name": "fpga:version",
"description": "FPGA bitfile version",
"health": "ok",
"severity": "info",
"value": "71.2.7.0",
"updatedAt": "2022-01-22T22:14:08Z"
},
{
"name": "v6h:power-domain:asw:0p9v-vcc",
"description": "ASW_0P9V_VCC power fault",
"health": "ok",
"severity": "info",
"value": "0",
"updatedAt": "2022-01-22T22:13:37Z"
},
{
"name": "v6h:power-domain:asw:0p9v-vcceram",
"description": "ASW_0P9V_VCCERAM power fault",
"health": "ok",
"severity": "info",
"value": "0",
"updatedAt": "2022-01-22T22:13:37Z"
},
{
"name": "v6h:power-domain:asw:1p12v-vccrgxb",
"description": "ASW_1P12V_VCCRGXB power fault",
"health": "ok",
"severity": "info",
"value": "0",
"updatedAt": "2022-01-22T22:13:37Z"
},
{
"name": "v6h:power-domain:asw:1p12v-vcctgxb",
"description": "ASW_1P12V_VCCTGXB power fault",
"health": "ok",
"severity": "info",
"value": "0",
"updatedAt": "2022-01-22T22:13:37Z"
},
{
"name": "v6h:power-domain:asw:1p1v-vcchgxe",
"description": "ASW_1P1V_VCCHGXE power fault",
"health": "ok",
"severity": "info",
"value": "0",
"updatedAt": "2022-01-22T22:13:37Z"
},
{
"name": "v6h:power-domain:asw:1p8v",
"description": "ASW_1P8V power fault",
"health": "ok",
"severity": "info",
"value": "0",
"updatedAt": "2022-01-22T22:13:37Z"
},
{
"name": "v6h:power-domain:asw:1p8v-vccpt",
"description": "ASW_1P8V_VCCPT power fault",
"health": "ok",
"severity": "info",
"value": "0",
"updatedAt": "2022-01-22T22:13:37Z"
},
{
"name": "v6h:power-domain:asw:2p4v",
"description": "ASW_2P4V power fault",
"health": "ok",
"severity": "info",
"value": "0",
"updatedAt": "2022-01-22T22:13:37Z"
},
{
"name": "v6h:power-domain:asw:2p5v",
"description": "ASW_2P5V power fault",
"health": "ok",
"severity": "info",
"value": "0",
"updatedAt": "2022-01-22T22:13:37Z"
},
{
"name": "v6h:power-domain:asw:3p0v",
"description": "ASW_3P0V power fault",
"health": "ok",
"severity": "info",
"value": "0",
"updatedAt": "2022-01-22T22:13:37Z"
},
{
"name": "v6h:power-domain:device:asw-opt",
"description": "ASW_OPT power fault",
"health": "ok",
"severity": "info",
"value": "0",
"updatedAt": "2022-01-22T22:13:38Z"
},
{
"name": "v6h:thermal-fault:asw:hot",
"description": "ASW_HOT thermal fault",
"health": "ok",
"severity": "info",
"value": "0",
"updatedAt": "2022-01-22T22:13:38Z"
},
{
"name": "v6h:thermal-fault:asw:therm-trip",
"description": "ASW_THERMTRIP thermal fault",
"health": "ok",
"severity": "info",
"value": "0",
"updatedAt": "2022-01-22T22:13:38Z"
}
]
}
},
{
"key": "appliance/hardware/fpga/asw/ports/1.0",
"state": {
"name": "Port 1.0",
"health": "ok",
"severity": "info"
},
"attributes": {
"attribute": [
{
"name": "interface:link-status",
"description": "Link status",
"health": "ok",
"severity": "info",
"value": "UP",
"updatedAt": "2022-01-24T05:32:14Z"
},
{
"name": "interface:port:fcs-error-rate",
"description": "FCS errors in rate",
"health": "ok",
"severity": "info",
"value": "0",
"updatedAt": "2022-01-24T05:32:14Z"
},
{
"name": "interface:port:fcs-errors-in",
"description": "FCS errors in",
"health": "ok",
"severity": "info",
"value": "0",
"updatedAt": "2022-01-24T05:32:14Z"
},
{
"name": "interface:port:rx-byte-rate",
"description": "RX rate (B/s)",
"health": "ok",
"severity": "info",
"value": "293.666667",
"updatedAt": "2022-01-24T05:32:14Z"
},
{
"name": "interface:port:rx-crc-error-rate",
"description": "Eth Rx CRC error rate",
"health": "ok",
"severity": "info",
"value": "0",
"updatedAt": "2022-01-24T05:32:14Z"
},
{
"name": "interface:port:rx-crc-errors",
"description": "Eth RX CRC errors",
"health": "ok",
"severity": "info",
"value": "0",
"updatedAt": "2022-01-24T05:32:14Z"
},
{
"name": "interface:port:rx-pkt-rate",
"description": "RX packet rate (pkt/s) (pkt/s)",
"health": "ok",
"severity": "info",
"value": "0",
"updatedAt": "2022-01-24T05:32:14Z"
},
{
"name": "interface:port:total-errors-in",
"description": "Total error frames RX",
"health": "ok",
"severity": "info",
"value": "0",
"updatedAt": "2022-01-24T05:32:14Z"
},
{
"name": "interface:port:total-errors-out",
"description": "Total error frames TX",
"health": "ok",
"severity": "info",
"value": "0",
"updatedAt": "2022-01-24T05:32:14Z"
},
{
"name": "interface:port:tx-byte-rate",
"description": "TX rate (B/s)",
"health": "ok",
"severity": "info",
"value": "4.266667",
"updatedAt": "2022-01-24T05:32:14Z"
},
{
"name": "interface:port:tx-pkt-rate",
"description": "TX packet rate (pkt/s) (pkt/s)",
"health": "ok",
"severity": "info",
"value": "0",
"updatedAt": "2022-01-24T05:32:14Z"
}
]
}
},
{
"key": "appliance/hardware/fpga/asw/ports/10.0",
"state": {
"name": "Port 10.0",
"health": "ok",
"severity": "notice"
},
"attributes": {
"attribute": [
{
"name": "interface:link-status",
"description": "Link status",
"health": "ok",
"severity": "notice",
"value": "DOWN",
"updatedAt": "2022-01-24T05:32:14Z"
},
{
"name": "interface:port:fcs-error-rate",
"description": "FCS errors in rate",
"health": "ok",
"severity": "info",
"value": "0",
"updatedAt": "2022-01-24T05:32:14Z"
},
{
"name": "interface:port:fcs-errors-in",
"description": "FCS errors in",
"health": "ok",
"severity": "info",
"value": "0",
"updatedAt": "2022-01-24T05:32:14Z"
},
{
"name": "interface:port:rx-byte-rate",
"description": "RX rate (B/s)",
"health": "ok",
"severity": "info",
"value": "0",
"updatedAt": "2022-01-24T05:32:14Z"
},
{
"name": "interface:port:rx-crc-error-rate",
"description": "Eth Rx CRC error rate",
"health": "ok",
"severity": "info",
"value": "0",
"updatedAt": "2022-01-24T05:32:14Z"
},
{
"name": "interface:port:rx-crc-errors",
"description": "Eth RX CRC errors",
"health": "ok",
"severity": "info",
"value": "0",
"updatedAt": "2022-01-24T05:32:14Z"
},
{
"name": "interface:port:rx-pkt-rate",
"description": "RX packet rate (pkt/s) (pkt/s)",
"health": "ok",
"severity": "info",
"value": "0",
"updatedAt": "2022-01-24T05:32:14Z"
},
{
"name": "interface:port:total-errors-in",
"description": "Total error frames RX",
"health": "ok",
"severity": "info",
"value": "0",
"updatedAt": "2022-01-24T05:32:14Z"
},
{
"name": "interface:port:total-errors-out",
"description": "Total error frames TX",
"health": "ok",
"severity": "info",
"value": "0",
"updatedAt": "2022-01-24T05:32:14Z"
},
{
"name": "interface:port:tx-byte-rate",
"description": "TX rate (B/s)",
"health": "ok",
"severity": "info",
"value": "0",
"updatedAt": "2022-01-24T05:32:14Z"
},
{
"name": "interface:port:tx-pkt-rate",
"description": "TX packet rate (pkt/s) (pkt/s)",
"health": "ok",
"severity": "info",
"value": "0",
"updatedAt": "2022-01-24T05:32:14Z"
}
]
}
},
{
"key": "appliance/hardware/fpga/asw/ports/2.0",
"state": {
"name": "Port 2.0",
"health": "ok",
"severity": "info"
},
"attributes": {
"attribute": [
{
"name": "interface:link-status",
"description": "Link status",
"health": "ok",
"severity": "info",
"value": "UP",
"updatedAt": "2022-01-24T05:32:14Z"
},
{
"name": "interface:port:fcs-error-rate",
"description": "FCS errors in rate",
"health": "ok",
"severity": "info",
"value": "0",
"updatedAt": "2022-01-24T05:32:14Z"
},
{
"name": "interface:port:fcs-errors-in",
"description": "FCS errors in",
"health": "ok",
"severity": "info",
"value": "0",
"updatedAt": "2022-01-24T05:32:14Z"
},
{
"name": "interface:port:rx-byte-rate",
"description": "RX rate (B/s)",
"health": "ok",
"severity": "info",
"value": "417.033333",
"updatedAt": "2022-01-24T05:32:14Z"
},
{
"name": "interface:port:rx-crc-error-rate",
"description": "Eth Rx CRC error rate",
"health": "ok",
"severity": "info",
"value": "0",
"updatedAt": "2022-01-24T05:32:14Z"
},
{
"name": "interface:port:rx-crc-errors",
"description": "Eth RX CRC errors",
"health": "ok",
"severity": "info",
"value": "0",
"updatedAt": "2022-01-24T05:32:14Z"
},
{
"name": "interface:port:rx-pkt-rate",
"description": "RX packet rate (pkt/s) (pkt/s)",
"health": "ok",
"severity": "info",
"value": "0",
"updatedAt": "2022-01-24T05:32:14Z"
},
{
"name": "interface:port:total-errors-in",
"description": "Total error frames RX",
"health": "ok",
"severity": "info",
"value": "0",
"updatedAt": "2022-01-24T05:32:14Z"
},
{
"name": "interface:port:total-errors-out",
"description": "Total error frames TX",
"health": "ok",
"severity": "info",
"value": "0",
"updatedAt": "2022-01-24T05:32:14Z"
},
{
"name": "interface:port:tx-byte-rate",
"description": "TX rate (B/s)",
"health": "ok",
"severity": "info",
"value": "4.266667",
"updatedAt": "2022-01-24T05:32:14Z"
},
{
"name": "interface:port:tx-pkt-rate",
"description": "TX packet rate (pkt/s) (pkt/s)",
"health": "ok",
"severity": "info",
"value": "0",
"updatedAt": "2022-01-24T05:32:14Z"
}
]
}
},
{
"key": "appliance/hardware/fpga/asw/ports/3.0",
"state": {
"name": "Port 3.0",
"health": "ok",
"severity": "notice"
},
"attributes": {
"attribute": [
{
"name": "interface:link-status",
"description": "Link status",
"health": "ok",
"severity": "notice",
"value": "DOWN",
"updatedAt": "2022-01-24T05:32:14Z"
},
{
"name": "interface:port:fcs-error-rate",
"description": "FCS errors in rate",
"health": "ok",
"severity": "info",
"value": "0",
"updatedAt": "2022-01-24T05:32:14Z"
},
{
"name": "interface:port:fcs-errors-in",
"description": "FCS errors in",
"health": "ok",
"severity": "info",
"value": "0",
"updatedAt": "2022-01-24T05:32:14Z"
},
{
"name": "interface:port:rx-byte-rate",
"description": "RX rate (B/s)",
"health": "ok",
"severity": "info",
"value": "0",
"updatedAt": "2022-01-24T05:32:14Z"
},
{
"name": "interface:port:rx-crc-error-rate",
"description": "Eth Rx CRC error rate",
"health": "ok",
"severity": "info",
"value": "0",
"updatedAt": "2022-01-24T05:32:14Z"
},
{
"name": "interface:port:rx-crc-errors",
"description": "Eth RX CRC errors",
"health": "ok",
"severity": "info",
"value": "0",
"updatedAt": "2022-01-24T05:32:14Z"
},
{
"name": "interface:port:rx-pkt-rate",
"description": "RX packet rate (pkt/s) (pkt/s)",
"health": "ok",
"severity": "info",
"value": "0",
"updatedAt": "2022-01-24T05:32:14Z"
},
{
"name": "interface:port:total-errors-in",
"description": "Total error frames RX",
"health": "ok",
"severity": "info",
"value": "0",
"updatedAt": "2022-01-24T05:32:14Z"
},
{
"name": "interface:port:total-errors-out",
"description": "Total error frames TX",
"health": "ok",
"severity": "info",
"value": "0",
"updatedAt": "2022-01-24T05:32:14Z"
},
{
"name": "interface:port:tx-byte-rate",
"description": "TX rate (B/s)",
"health": "ok",
"severity": "info",
"value": "0",
"updatedAt": "2022-01-24T05:32:14Z"
},
{
"name": "interface:port:tx-pkt-rate",
"description": "TX packet rate (pkt/s) (pkt/s)",
"health": "ok",
"severity": "info",
"value": "0",
"updatedAt": "2022-01-24T05:32:14Z"
}
]
}
},
{
"key": "appliance/hardware/fpga/asw/ports/4.0",
"state": {
"name": "Port 4.0",
"health": "ok",
"severity": "notice"
},
"attributes": {
"attribute": [
{
"name": "interface:link-status",
"description": "Link status",
"health": "ok",
"severity": "notice",
"value": "DOWN",
"updatedAt": "2022-01-24T05:32:14Z"
},
{
"name": "interface:port:fcs-error-rate",
"description": "FCS errors in rate",
"health": "ok",
"severity": "info",
"value": "0",
"updatedAt": "2022-01-24T05:32:14Z"
},
{
"name": "interface:port:fcs-errors-in",
"description": "FCS errors in",
"health": "ok",
"severity": "info",
"value": "0",
"updatedAt": "2022-01-24T05:32:14Z"
},
{
"name": "interface:port:rx-byte-rate",
"description": "RX rate (B/s)",
"health": "ok",
"severity": "info",
"value": "0",
"updatedAt": "2022-01-24T05:32:14Z"
},
{
"name": "interface:port:rx-crc-error-rate",
"description": "Eth Rx CRC error rate",
"health": "ok",
"severity": "info",
"value": "0",
"updatedAt": "2022-01-24T05:32:14Z"
},
{
"name": "interface:port:rx-crc-errors",
"description": "Eth RX CRC errors",
"health": "ok",
"severity": "info",
"value": "0",
"updatedAt": "2022-01-24T05:32:14Z"
},
{
"name": "interface:port:rx-pkt-rate",
"description": "RX packet rate (pkt/s) (pkt/s)",
"health": "ok",
"severity": "info",
"value": "0",
"updatedAt": "2022-01-24T05:32:14Z"
},
{
"name": "interface:port:total-errors-in",
"description": "Total error frames RX",
"health": "ok",
"severity": "info",
"value": "0",
"updatedAt": "2022-01-24T05:32:14Z"
},
{
"name": "interface:port:total-errors-out",
"description": "Total error frames TX",
"health": "ok",
"severity": "info",
"value": "0",
"updatedAt": "2022-01-24T05:32:14Z"
},
{
"name": "interface:port:tx-byte-rate",
"description": "TX rate (B/s)",
"health": "ok",
"severity": "info",
"value": "0",
"updatedAt": "2022-01-24T05:32:14Z"
},
{
"name": "interface:port:tx-pkt-rate",
"description": "TX packet rate (pkt/s) (pkt/s)",
"health": "ok",
"severity": "info",
"value": "0",
"updatedAt": "2022-01-24T05:32:14Z"
}
]
}
},
{
"key": "appliance/hardware/fpga/asw/ports/5.0",
"state": {
"name": "Port 5.0",
"health": "ok",
"severity": "notice"
},
"attributes": {
"attribute": [
{
"name": "interface:link-status",
"description": "Link status",
"health": "ok",
"severity": "notice",
"value": "DOWN",
"updatedAt": "2022-01-24T05:32:16Z"
},
{
"name": "interface:port:fcs-error-rate",
"description": "FCS errors in rate",
"health": "ok",
"severity": "info",
"value": "0",
"updatedAt": "2022-01-24T05:32:14Z"
},
{
"name": "interface:port:fcs-errors-in",
"description": "FCS errors in",
"health": "ok",
"severity": "info",
"value": "0",
"updatedAt": "2022-01-24T05:32:14Z"
},
{
"name": "interface:port:rx-byte-rate",
"description": "RX rate (B/s)",
"health": "ok",
"severity": "info",
"value": "0",
"updatedAt": "2022-01-24T05:32:14Z"
},
{
"name": "interface:port:rx-crc-error-rate",
"description": "Eth Rx CRC error rate",
"health": "ok",
"severity": "info",
"value": "0",
"updatedAt": "2022-01-24T05:32:14Z"
},
{
"name": "interface:port:rx-crc-errors",
"description": "Eth RX CRC errors",
"health": "ok",
"severity": "info",
"value": "0",
"updatedAt": "2022-01-24T05:32:14Z"
},
{
"name": "interface:port:rx-pkt-rate",
"description": "RX packet rate (pkt/s) (pkt/s)",
"health": "ok",
"severity": "info",
"value": "0",
"updatedAt": "2022-01-24T05:32:14Z"
},
{
"name": "interface:port:total-errors-in",
"description": "Total error frames RX",
"health": "ok",
"severity": "info",
"value": "0",
"updatedAt": "2022-01-24T05:32:14Z"
},
{
"name": "interface:port:total-errors-out",
"description": "Total error frames TX",
"health": "ok",
"severity": "info",
"value": "0",
"updatedAt": "2022-01-24T05:32:14Z"
},
{
"name": "interface:port:tx-byte-rate",
"description": "TX rate (B/s)",
"health": "ok",
"severity": "info",
"value": "0",
"updatedAt": "2022-01-24T05:32:14Z"
},
{
"name": "interface:port:tx-pkt-rate",
"description": "TX packet rate (pkt/s) (pkt/s)",
"health": "ok",
"severity": "info",
"value": "0",
"updatedAt": "2022-01-24T05:32:14Z"
}
]
}
},
{
"key": "appliance/hardware/fpga/asw/ports/6.0",
"state": {
"name": "Port 6.0",
"health": "ok",
"severity": "notice"
},
"attributes": {
"attribute": [
{
"name": "interface:link-status",
"description": "Link status",
"health": "ok",
"severity": "notice",
"value": "DOWN",
"updatedAt": "2022-01-24T05:32:16Z"
},
{
"name": "interface:port:fcs-error-rate",
"description": "FCS errors in rate",
"health": "ok",
"severity": "info",
"value": "0",
"updatedAt": "2022-01-24T05:32:14Z"
},
{
"name": "interface:port:fcs-errors-in",
"description": "FCS errors in",
"health": "ok",
"severity": "info",
"value": "0",
"updatedAt": "2022-01-24T05:32:14Z"
},
{
"name": "interface:port:rx-byte-rate",
"description": "RX rate (B/s)",
"health": "ok",
"severity": "info",
"value": "0",
"updatedAt": "2022-01-24T05:32:14Z"
},
{
"name": "interface:port:rx-crc-error-rate",
"description": "Eth Rx CRC error rate",
"health": "ok",
"severity": "info",
"value": "0",
"updatedAt": "2022-01-24T05:32:14Z"
},
{
"name": "interface:port:rx-crc-errors",
"description": "Eth RX CRC errors",
"health": "ok",
"severity": "info",
"value": "0",
"updatedAt": "2022-01-24T05:32:14Z"
},
{
"name": "interface:port:rx-pkt-rate",
"description": "RX packet rate (pkt/s) (pkt/s)",
"health": "ok",
"severity": "info",
"value": "0",
"updatedAt": "2022-01-24T05:32:14Z"
},
{
"name": "interface:port:total-errors-in",
"description": "Total error frames RX",
"health": "ok",
"severity": "info",
"value": "0",
"updatedAt": "2022-01-24T05:32:14Z"
},
{
"name": "interface:port:total-errors-out",
"description": "Total error frames TX",
"health": "ok",
"severity": "info",
"value": "0",
"updatedAt": "2022-01-24T05:32:14Z"
},
{
"name": "interface:port:tx-byte-rate",
"description": "TX rate (B/s)",
"health": "ok",
"severity": "info",
"value": "0",
"updatedAt": "2022-01-24T05:32:14Z"
},
{
"name": "interface:port:tx-pkt-rate",
"description": "TX packet rate (pkt/s) (pkt/s)",
"health": "ok",
"severity": "info",
"value": "0",
"updatedAt": "2022-01-24T05:32:14Z"
}
]
}
},
{
"key": "appliance/hardware/fpga/asw/ports/7.0",
"state": {
"name": "Port 7.0",
"health": "ok",
"severity": "notice"
},
"attributes": {
"attribute": [
{
"name": "interface:link-status",
"description": "Link status",
"health": "ok",
"severity": "notice",
"value": "DOWN",
"updatedAt": "2022-01-24T05:32:16Z"
},
{
"name": "interface:port:fcs-error-rate",
"description": "FCS errors in rate",
"health": "ok",
"severity": "info",
"value": "0",
"updatedAt": "2022-01-24T05:32:14Z"
},
{
"name": "interface:port:fcs-errors-in",
"description": "FCS errors in",
"health": "ok",
"severity": "info",
"value": "0",
"updatedAt": "2022-01-24T05:32:14Z"
},
{
"name": "interface:port:rx-byte-rate",
"description": "RX rate (B/s)",
"health": "ok",
"severity": "info",
"value": "0",
"updatedAt": "2022-01-24T05:32:14Z"
},
{
"name": "interface:port:rx-crc-error-rate",
"description": "Eth Rx CRC error rate",
"health": "ok",
"severity": "info",
"value": "0",
"updatedAt": "2022-01-24T05:32:14Z"
},
{
"name": "interface:port:rx-crc-errors",
"description": "Eth RX CRC errors",
"health": "ok",
"severity": "info",
"value": "0",
"updatedAt": "2022-01-24T05:32:14Z"
},
{
"name": "interface:port:rx-pkt-rate",
"description": "RX packet rate (pkt/s) (pkt/s)",
"health": "ok",
"severity": "info",
"value": "0",
"updatedAt": "2022-01-24T05:32:14Z"
},
{
"name": "interface:port:total-errors-in",
"description": "Total error frames RX",
"health": "ok",
"severity": "info",
"value": "0",
"updatedAt": "2022-01-24T05:32:14Z"
},
{
"name": "interface:port:total-errors-out",
"description": "Total error frames TX",
"health": "ok",
"severity": "info",
"value": "0",
"updatedAt": "2022-01-24T05:32:14Z"
},
{
"name": "interface:port:tx-byte-rate",
"description": "TX rate (B/s)",
"health": "ok",
"severity": "info",
"value": "0",
"updatedAt": "2022-01-24T05:32:14Z"
},
{
"name": "interface:port:tx-pkt-rate",
"description": "TX packet rate (pkt/s) (pkt/s)",
"health": "ok",
"severity": "info",
"value": "0",
"updatedAt": "2022-01-24T05:32:14Z"
}
]
}
},
{
"key": "appliance/hardware/fpga/asw/ports/8.0",
"state": {
"name": "Port 8.0",
"health": "ok",
"severity": "info"
},
"attributes": {
"attribute": [
{
"name": "interface:link-status",
"description": "Link status",
"health": "ok",
"severity": "info",
"value": "UP",
"updatedAt": "2022-01-24T05:32:16Z"
},
{
"name": "interface:port:fcs-error-rate",
"description": "FCS errors in rate",
"health": "ok",
"severity": "info",
"value": "0",
"updatedAt": "2022-01-24T05:32:14Z"
},
{
"name": "interface:port:fcs-errors-in",
"description": "FCS errors in",
"health": "ok",
"severity": "info",
"value": "0",
"updatedAt": "2022-01-24T05:32:14Z"
},
{
"name": "interface:port:rx-byte-rate",
"description": "RX rate (B/s)",
"health": "ok",
"severity": "info",
"value": "130.133333",
"updatedAt": "2022-01-24T05:32:14Z"
},
{
"name": "interface:port:rx-crc-error-rate",
"description": "Eth Rx CRC error rate",
"health": "ok",
"severity": "info",
"value": "0",
"updatedAt": "2022-01-24T05:32:14Z"
},
{
"name": "interface:port:rx-crc-errors",
"description": "Eth RX CRC errors",
"health": "ok",
"severity": "info",
"value": "0",
"updatedAt": "2022-01-24T05:32:14Z"
},
{
"name": "interface:port:rx-pkt-rate",
"description": "RX packet rate (pkt/s) (pkt/s)",
"health": "ok",
"severity": "info",
"value": "0",
"updatedAt": "2022-01-24T05:32:14Z"
},
{
"name": "interface:port:total-errors-in",
"description": "Total error frames RX",
"health": "ok",
"severity": "info",
"value": "0",
"updatedAt": "2022-01-24T05:32:14Z"
},
{
"name": "interface:port:total-errors-out",
"description": "Total error frames TX",
"health": "ok",
"severity": "info",
"value": "0",
"updatedAt": "2022-01-24T05:32:14Z"
},
{
"name": "interface:port:tx-byte-rate",
"description": "TX rate (B/s)",
"health": "ok",
"severity": "info",
"value": "130.133333",
"updatedAt": "2022-01-24T05:32:14Z"
},
{
"name": "interface:port:tx-pkt-rate",
"description": "TX packet rate (pkt/s) (pkt/s)",
"health": "ok",
"severity": "info",
"value": "0",
"updatedAt": "2022-01-24T05:32:14Z"
}
]
}
},
{
"key": "appliance/hardware/fpga/asw/ports/9.0",
"state": {
"name": "Port 9.0",
"health": "ok",
"severity": "info"
},
"attributes": {
"attribute": [
{
"name": "interface:link-status",
"description": "Link status",
"health": "ok",
"severity": "info",
"value": "UP",
"updatedAt": "2022-01-24T05:32:16Z"
},
{
"name": "interface:port:fcs-error-rate",
"description": "FCS errors in rate",
"health": "ok",
"severity": "info",
"value": "0",
"updatedAt": "2022-01-24T05:32:14Z"
},
{
"name": "interface:port:fcs-errors-in",
"description": "FCS errors in",
"health": "ok",
"severity": "info",
"value": "0",
"updatedAt": "2022-01-24T05:32:14Z"
},
{
"name": "interface:port:rx-byte-rate",
"description": "RX rate (B/s)",
"health": "ok",
"severity": "info",
"value": "130.133333",
"updatedAt": "2022-01-24T05:32:14Z"
},
{
"name": "interface:port:rx-crc-error-rate",
"description": "Eth Rx CRC error rate",
"health": "ok",
"severity": "info",
"value": "0",
"updatedAt": "2022-01-24T05:32:14Z"
},
{
"name": "interface:port:rx-crc-errors",
"description": "Eth RX CRC errors",
"health": "ok",
"severity": "info",
"value": "0",
"updatedAt": "2022-01-24T05:32:14Z"
},
{
"name": "interface:port:rx-pkt-rate",
"description": "RX packet rate (pkt/s) (pkt/s)",
"health": "ok",
"severity": "info",
"value": "0",
"updatedAt": "2022-01-24T05:32:14Z"
},
{
"name": "interface:port:total-errors-in",
"description": "Total error frames RX",
"health": "ok",
"severity": "info",
"value": "0",
"updatedAt": "2022-01-24T05:32:14Z"
},
{
"name": "interface:port:total-errors-out",
"description": "Total error frames TX",
"health": "ok",
"severity": "info",
"value": "0",
"updatedAt": "2022-01-24T05:32:14Z"
},
{
"name": "interface:port:tx-byte-rate",
"description": "TX rate (B/s)",
"health": "ok",
"severity": "info",
"value": "130.133333",
"updatedAt": "2022-01-24T05:32:14Z"
},
{
"name": "interface:port:tx-pkt-rate",
"description": "TX packet rate (pkt/s) (pkt/s)",
"health": "ok",
"severity": "info",
"value": "0",
"updatedAt": "2022-01-24T05:32:14Z"
}
]
}
},
{
"key": "appliance/hardware/fpga/atse0",
"state": {
"name": "FPGA ATSE-0",
"health": "ok",
"severity": "info"
},
"attributes": {
"attribute": [
{
"name": "fpga:version",
"description": "FPGA bitfile version",
"health": "ok",
"severity": "info",
"value": "72.2.5.0",
"updatedAt": "2022-01-22T22:14:08Z"
},
{
"name": "interface:port:speed",
"description": "Port Speed",
"health": "ok",
"severity": "info",
"value": "100",
"updatedAt": "2022-01-22T22:14:08Z"
},
{
"name": "v6h:power-domain:atse1:0p95v-bwe",
"description": "ATSE1_0P95V_BWE power fault",
"health": "ok",
"severity": "info",
"value": "0",
"updatedAt": "2022-01-22T22:13:37Z"
},
{
"name": "v6h:power-domain:atse1:0p9v-vcc",
"description": "ATSE1_0P9V_VCC power fault",
"health": "ok",
"severity": "info",
"value": "0",
"updatedAt": "2022-01-22T22:13:37Z"
},
{
"name": "v6h:power-domain:atse1:0p9v-vcceram",
"description": "ATSE1_0P9V_VCCERAM power fault",
"health": "ok",
"severity": "info",
"value": "0",
"updatedAt": "2022-01-22T22:13:37Z"
},
{
"name": "v6h:power-domain:atse1:1p12v-vccrgxb",
"description": "ATSE1_1P12V_VCCRGXB power fault",
"health": "ok",
"severity": "info",
"value": "0",
"updatedAt": "2022-01-22T22:13:37Z"
},
{
"name": "v6h:power-domain:atse1:1p12v-vcctgxb",
"description": "ATSE1_1P12V_VCCTGXB power fault",
"health": "ok",
"severity": "info",
"value": "0",
"updatedAt": "2022-01-22T22:13:37Z"
},
{
"name": "v6h:power-domain:atse1:1p2v",
"description": "ATSE1_1P2V power fault",
"health": "ok",
"severity": "info",
"value": "0",
"updatedAt": "2022-01-22T22:13:37Z"
},
{
"name": "v6h:power-domain:atse1:1p5v-bwe",
"description": "ATSE1_1P5V_BWE power fault",
"health": "ok",
"severity": "info",
"value": "0",
"updatedAt": "2022-01-22T22:13:37Z"
},
{
"name": "v6h:power-domain:atse1:1p8v",
"description": "ATSE1_1P8V power fault",
"health": "ok",
"severity": "info",
"value": "0",
"updatedAt": "2022-01-22T22:13:37Z"
},
{
"name": "v6h:power-domain:atse1:2p4v",
"description": "ATSE1_2P4V power fault",
"health": "ok",
"severity": "info",
"value": "0",
"updatedAt": "2022-01-22T22:13:37Z"
},
{
"name": "v6h:power-domain:atse1:2p5v",
"description": "ATSE1_2P5V power fault",
"health": "ok",
"severity": "info",
"value": "0",
"updatedAt": "2022-01-22T22:13:37Z"
},
{
"name": "v6h:power-domain:atse1:3p0v",
"description": "ATSE1_3P0V power fault",
"health": "ok",
"severity": "info",
"value": "0",
"updatedAt": "2022-01-22T22:13:37Z"
},
{
"name": "v6h:thermal-fault:atse1:hot",
"description": "ATSE1_HOT thermal fault",
"health": "ok",
"severity": "info",
"value": "0",
"updatedAt": "2022-01-22T22:13:38Z"
},
{
"name": "v6h:thermal-fault:atse1:therm-trip",
"description": "ATSE1_THERMTRIP thermal fault",
"health": "ok",
"severity": "info",
"value": "0",
"updatedAt": "2022-01-22T22:13:38Z"
}
]
}
},
{
"key": "appliance/hardware/lop",
"state": {
"name": "LOP",
"health": "ok",
"severity": "info"
},
"attributes": {
"attribute": [
{
"name": "lop:cpld:gpio-fault",
"description": "CPLD GPIO fault",
"health": "ok",
"severity": "info",
"value": "false",
"updatedAt": "2022-01-24T05:00:06Z"
},
{
"name": "lop:fan-control-fault",
"description": "Fan control fault",
"health": "ok",
"severity": "info",
"value": "false",
"updatedAt": "2022-01-24T05:00:06Z"
},
{
"name": "lop:fan-speed:below-minimum-rpm",
"description": "Fan speed below minimum RPM",
"health": "ok",
"severity": "info",
"value": "false",
"updatedAt": "2022-01-24T05:00:06Z"
},
{
"name": "lop:fan-speed:sensor-fault",
"description": "Fan speed sensor fault",
"health": "ok",
"severity": "info",
"value": "false",
"updatedAt": "2022-01-24T05:00:06Z"
},
{
"name": "lop:fantray-hotswap-fault",
"description": "Fantray hot-swap controller fault",
"health": "ok",
"severity": "info",
"value": "false",
"updatedAt": "2022-01-24T05:00:06Z"
},
{
"name": "lop:fit:forced-bad-health",
"description": "LOP FIT forced bad health",
"health": "ok",
"severity": "info",
"value": "false",
"updatedAt": "2022-01-24T05:00:06Z"
},
{
"name": "lop:i2c:1:cpld-eeprom-ack-fault",
"description": "I2C-1 CPLD EEPROM ack fault",
"health": "ok",
"severity": "info",
"value": "false",
"updatedAt": "2022-01-24T05:00:06Z"
},
{
"name": "lop:i2c:1:hdc2010-inlet-ack-fault",
"description": "I2C-1 HDC2010 inlet ack fault",
"health": "ok",
"severity": "info",
"value": "false",
"updatedAt": "2022-01-24T05:00:06Z"
},
{
"name": "lop:i2c:1:max31730-asw-diode013-ack-fault",
"description": "I2C-1 MAX31730 ASW diode 0,1,3 ack fault",
"health": "ok",
"severity": "info",
"value": "false",
"updatedAt": "2022-01-24T05:00:06Z"
},
{
"name": "lop:i2c:1:max31730-asw-diode46-ack-fault",
"description": "I2C-1 MAX31730 ASW diode 4,6 ack fault",
"health": "ok",
"severity": "info",
"value": "false",
"updatedAt": "2022-01-24T05:00:06Z"
},
{
"name": "lop:i2c:1:max31730-atse1-ack-fault",
"description": "I2C-1 MAX31730 ATSE1 ack fault",
"health": "ok",
"severity": "info",
"value": "false",
"updatedAt": "2022-01-24T05:00:06Z"
},
{
"name": "lop:i2c:1:max31730-atse1-or-bwe1-ack-fault",
"description": "I2C-1 MAX31730 ATSE1/BWE1 ack fault",
"health": "ok",
"severity": "info",
"value": "false",
"updatedAt": "2022-01-24T05:00:06Z"
},
{
"name": "lop:i2c:1:pel-eeprom-ack-fault",
"description": "I2C-1 PEL EEPROM ack fault",
"health": "ok",
"severity": "info",
"value": "false",
"updatedAt": "2022-01-24T05:00:06Z"
},
{
"name": "lop:i2c:1:platform-eeprom-ack-fault",
"description": "I2C-1 Platform EEPROM ack fault",
"health": "ok",
"severity": "info",
"value": "false",
"updatedAt": "2022-01-24T05:00:06Z"
},
{
"name": "lop:i2c:1:stuck-bus-fault",
"description": "I2C-1 Stuck bus fault",
"health": "ok",
"severity": "info",
"value": "false",
"updatedAt": "2022-01-24T05:00:06Z"
},
{
"name": "lop:i2c:2:stuck-bus-fault",
"description": "I2C-2 stuck bus fault",
"health": "ok",
"severity": "info",
"value": "false",
"updatedAt": "2022-01-24T05:00:06Z"
},
{
"name": "lop:i2c:3:stuck-bus-fault",
"description": "I2C-3 stuck bus fault",
"health": "ok",
"severity": "info",
"value": "false",
"updatedAt": "2022-01-24T05:00:06Z"
},
{
"name": "lop:i2c:3:tmp421-outlet-ack-fault",
"description": "I2C-3 TMP421 outlet ack fault",
"health": "ok",
"severity": "info",
"value": "false",
"updatedAt": "2022-01-24T05:00:06Z"
},
{
"name": "lop:i2c:4:stuck-bus-fault",
"description": "I2C-4 stuck bus fault",
"health": "ok",
"severity": "info",
"value": "false",
"updatedAt": "2022-01-24T05:00:06Z"
},
{
"name": "lop:i2c:psu1-fault",
"description": "PSU 1 I2C fault",
"health": "ok",
"severity": "info",
"value": "false",
"updatedAt": "2022-01-24T05:00:06Z"
},
{
"name": "lop:i2c:psu2-fault",
"description": "PSU 2 I2C fault",
"health": "ok",
"severity": "info",
"value": "false",
"updatedAt": "2022-01-24T05:00:06Z"
},
{
"name": "lop:microcontroller:rev-id-fault",
"description": "Microcontroller Revision ID Fault",
"health": "ok",
"severity": "info",
"value": "false",
"updatedAt": "2022-01-24T05:00:06Z"
},
{
"name": "lop:nc-si-rmii:failure",
"description": "LOP NC-SI / RMII Failure",
"health": "ok",
"severity": "info",
"value": "false",
"updatedAt": "2022-01-24T05:00:06Z"
},
{
"name": "lop:post",
"description": "LOP POST",
"health": "ok",
"severity": "info",
"value": "false",
"updatedAt": "2022-01-24T05:00:06Z"
},
{
"name": "v6h:sensor:temperature:aswdie0",
"description": "ASW_DIE_0 (C)",
"health": "ok",
"severity": "info",
"value": "46.9",
"updatedAt": "2022-01-22T22:13:38Z"
},
{
"name": "v6h:sensor:temperature:aswdie1",
"description": "ASW_DIE_1 (C)",
"health": "ok",
"severity": "info",
"value": "46.9",
"updatedAt": "2022-01-22T22:13:38Z"
},
{
"name": "v6h:sensor:temperature:aswdie3",
"description": "ASW_DIE_3 (C)",
"health": "ok",
"severity": "info",
"value": "48.5",
"updatedAt": "2022-01-22T22:13:38Z"
},
{
"name": "v6h:sensor:temperature:aswdie4",
"description": "ASW_DIE_4 (C)",
"health": "ok",
"severity": "info",
"value": "47.2",
"updatedAt": "2022-01-22T22:13:38Z"
},
{
"name": "v6h:sensor:temperature:aswdie6",
"description": "ASW_DIE_6 (C)",
"health": "ok",
"severity": "info",
"value": "47.6",
"updatedAt": "2022-01-22T22:13:38Z"
},
{
"name": "v6h:sensor:temperature:atse1die0",
"description": "ATSE1_DIE_0 (C)",
"health": "ok",
"severity": "info",
"value": "49.7",
"updatedAt": "2022-01-22T22:13:38Z"
},
{
"name": "v6h:sensor:temperature:atse1die1",
"description": "ATSE1_DIE_1 (C)",
"health": "ok",
"severity": "info",
"value": "53.6",
"updatedAt": "2022-01-22T22:13:38Z"
},
{
"name": "v6h:sensor:temperature:atse1die3",
"description": "ATSE1_DIE_3 (C)",
"health": "ok",
"severity": "info",
"value": "52",
"updatedAt": "2022-01-22T22:13:38Z"
},
{
"name": "v6h:sensor:temperature:atse1die4",
"description": "ATSE1_DIE_4 (C)",
"health": "ok",
"severity": "info",
"value": "53.3",
"updatedAt": "2022-01-22T22:13:38Z"
},
{
"name": "v6h:sensor:temperature:atse1die6",
"description": "ATSE1_DIE_6 (C)",
"health": "ok",
"severity": "info",
"value": "53.7",
"updatedAt": "2022-01-22T22:13:38Z"
},
{
"name": "v6h:sensor:temperature:bwe1die",
"description": "BWE1_DIE (C)",
"health": "ok",
"severity": "info",
"value": "52.3",
"updatedAt": "2022-01-22T22:13:38Z"
},
{
"name": "v6h:sensor:temperature:cpu",
"description": "CPU (C)",
"health": "ok",
"severity": "info",
"value": "53",
"updatedAt": "2022-01-17T10:17:56Z"
},
{
"name": "v6h:sensor:temperature:cputctldelta",
"description": "CPU_TCTL_DELTA (C)",
"health": "ok",
"severity": "info",
"value": "-38",
"updatedAt": "2022-01-17T10:17:56Z"
},
{
"name": "v6h:sensor:temperature:inlet",
"description": "INLET (C)",
"health": "ok",
"severity": "info",
"value": "30.7",
"updatedAt": "2022-01-22T22:13:38Z"
},
{
"name": "v6h:sensor:temperature:outlet",
"description": "OUTLET (C)",
"health": "ok",
"severity": "info",
"value": "36",
"updatedAt": "2022-01-22T22:13:38Z"
},
{
"name": "v6h:sensor:voltage:0p6vvttabcd",
"description": "0P6V_VTT_ABCD (V)",
"health": "ok",
"severity": "info",
"value": "",
"updatedAt": "2021-09-24T20:42:14Z"
},
{
"name": "v6h:sensor:voltage:0p6vvttefgh",
"description": "0P6V_VTT_EFGH (V)",
"health": "ok",
"severity": "info",
"value": "",
"updatedAt": "2021-09-24T20:42:14Z"
},
{
"name": "v6h:sensor:voltage:0p85vcpupvsa",
"description": "0P85V_CPU_PVSA (V)",
"health": "ok",
"severity": "info",
"value": "",
"updatedAt": "2021-09-24T20:42:14Z"
},
{
"name": "v6h:sensor:voltage:0p95vbwe1",
"description": "0P95V_BWE1 (V)",
"health": "ok",
"severity": "info",
"value": "",
"updatedAt": "2021-09-24T20:42:14Z"
},
{
"name": "v6h:sensor:voltage:0p9vvccasw",
"description": "0P9V_VCC_ASW (V)",
"health": "ok",
"severity": "info",
"value": "",
"updatedAt": "2021-09-24T20:42:14Z"
},
{
"name": "v6h:sensor:voltage:0p9vvccatse1",
"description": "0P9V_VCC_ATSE1 (V)",
"health": "ok",
"severity": "info",
"value": "",
"updatedAt": "2021-09-24T20:42:14Z"
},
{
"name": "v6h:sensor:voltage:0p9vvcceramasw",
"description": "0P9V_VCCERAM_ASW (V)",
"health": "ok",
"severity": "info",
"value": "",
"updatedAt": "2021-09-24T20:42:14Z"
},
{
"name": "v6h:sensor:voltage:0p9vvcceramatse1",
"description": "0P9V_VCCERAM_ATSE1 (V)",
"health": "ok",
"severity": "info",
"value": "",
"updatedAt": "2021-09-24T20:42:14Z"
},
{
"name": "v6h:sensor:voltage:12p0v",
"description": "12P0V (V)",
"health": "ok",
"severity": "info",
"value": "",
"updatedAt": "2021-09-24T20:42:14Z"
},
{
"name": "v6h:sensor:voltage:12p0vstby",
"description": "12P0V_STBY (V)",
"health": "ok",
"severity": "info",
"value": "",
"updatedAt": "2021-09-24T20:42:14Z"
},
{
"name": "v6h:sensor:voltage:1p05vpch",
"description": "1P05V_PCH (V)",
"health": "ok",
"severity": "info",
"value": "",
"updatedAt": "2021-09-24T20:42:14Z"
},
{
"name": "v6h:sensor:voltage:1p0vcpupvccana",
"description": "1P0V_CPU_PVCCANA (V)",
"health": "ok",
"severity": "info",
"value": "",
"updatedAt": "2021-09-24T20:42:14Z"
},
{
"name": "v6h:sensor:voltage:1p0vcpupvccio",
"description": "1P0V_CPU_VCCIO (V)",
"health": "ok",
"severity": "info",
"value": "",
"updatedAt": "2021-09-24T20:42:14Z"
},
{
"name": "v6h:sensor:voltage:1p0vvnnpch",
"description": "1P0V_VNN_PCH (V)",
"health": "ok",
"severity": "info",
"value": "",
"updatedAt": "2021-09-24T20:42:14Z"
},
{
"name": "v6h:sensor:voltage:1p12vvccrgxbasw",
"description": "1P12V_VCCRGXB_ASW (V)",
"health": "ok",
"severity": "info",
"value": "",
"updatedAt": "2021-09-24T20:42:14Z"
},
{
"name": "v6h:sensor:voltage:1p12vvccrgxbatse1",
"description": "1P12V_VCCRGXB_ATSE1 (V)",
"health": "ok",
"severity": "info",
"value": "",
"updatedAt": "2021-09-24T20:42:14Z"
},
{
"name": "v6h:sensor:voltage:1p12vvcctgxbasw",
"description": "1P12V_VCCTGXB_ASW (V)",
"health": "ok",
"severity": "info",
"value": "",
"updatedAt": "2021-09-24T20:42:14Z"
},
{
"name": "v6h:sensor:voltage:1p12vvcctgxbatse1",
"description": "1P12V_VCCTGXB_ATSE1 (V)",
"health": "ok",
"severity": "info",
"value": "",
"updatedAt": "2021-09-24T20:42:14Z"
},
{
"name": "v6h:sensor:voltage:1p1vvcchgxeasw",
"description": "1P1V_VCCH_GXE_ASW (V)",
"health": "ok",
"severity": "info",
"value": "",
"updatedAt": "2021-09-24T20:42:14Z"
},
{
"name": "v6h:sensor:voltage:1p2vatse1",
"description": "1P2V_ATSE1 (V)",
"health": "ok",
"severity": "info",
"value": "",
"updatedAt": "2021-09-24T20:42:14Z"
},
{
"name": "v6h:sensor:voltage:1p2vsb",
"description": "1P2VSB (V)",
"health": "ok",
"severity": "info",
"value": "",
"updatedAt": "2021-09-24T20:42:14Z"
},
{
"name": "v6h:sensor:voltage:1p2vvddqabcd",
"description": "1P2V_VDDQ_ABCD (V)",
"health": "ok",
"severity": "info",
"value": "",
"updatedAt": "2021-09-24T20:42:14Z"
},
{
"name": "v6h:sensor:voltage:1p2vvddqefgh",
"description": "1P2V_VDDQ_EFGH (V)",
"health": "ok",
"severity": "info",
"value": "",
"updatedAt": "2021-09-24T20:42:14Z"
},
{
"name": "v6h:sensor:voltage:1p5vbwe1",
"description": "1P5V_BWE1 (V)",
"health": "ok",
"severity": "info",
"value": "",
"updatedAt": "2021-09-24T20:42:14Z"
},
{
"name": "v6h:sensor:voltage:1p8vasw",
"description": "1P8V_ASW (V)",
"health": "ok",
"severity": "info",
"value": "",
"updatedAt": "2021-09-24T20:42:14Z"
},
{
"name": "v6h:sensor:voltage:1p8vatse1",
"description": "1P8V_ATSE1 (V)",
"health": "ok",
"severity": "info",
"value": "",
"updatedAt": "2021-09-24T20:42:14Z"
},
{
"name": "v6h:sensor:voltage:1p8vcpu",
"description": "1P8V_CPU (V)",
"health": "ok",
"severity": "info",
"value": "",
"updatedAt": "2021-09-24T20:42:14Z"
},
{
"name": "v6h:sensor:voltage:1p8vcpuvccin",
"description": "1P8V_CPU_VCCIN (V)",
"health": "ok",
"severity": "info",
"value": "",
"updatedAt": "2021-09-24T20:42:14Z"
},
{
"name": "v6h:sensor:voltage:1p8vpch",
"description": "1P8V_PCH (V)",
"health": "ok",
"severity": "info",
"value": "",
"updatedAt": "2021-09-24T20:42:14Z"
},
{
"name": "v6h:sensor:voltage:1p8vsb",
"description": "1P8VSB (V)",
"health": "ok",
"severity": "info",
"value": "",
"updatedAt": "2021-09-24T20:42:14Z"
},
{
"name": "v6h:sensor:voltage:1p8vvccptasw",
"description": "1P8V_VCCPT_ASW (V)",
"health": "ok",
"severity": "info",
"value": "",
"updatedAt": "2021-09-24T20:42:14Z"
},
{
"name": "v6h:sensor:voltage:2p4vasw",
"description": "2P4V_ASW (V)",
"health": "ok",
"severity": "info",
"value": "",
"updatedAt": "2021-09-24T20:42:14Z"
},
{
"name": "v6h:sensor:voltage:2p4vatse1",
"description": "2P4V_ATSE1 (V)",
"health": "ok",
"severity": "info",
"value": "",
"updatedAt": "2021-09-24T20:42:14Z"
},
{
"name": "v6h:sensor:voltage:2p5vasw",
"description": "2P5V_ASW (V)",
"health": "ok",
"severity": "info",
"value": "",
"updatedAt": "2021-09-24T20:42:14Z"
},
{
"name": "v6h:sensor:voltage:2p5vatse1",
"description": "2P5V_ATSE1 (V)",
"health": "ok",
"severity": "info",
"value": "",
"updatedAt": "2021-09-24T20:42:14Z"
},
{
"name": "v6h:sensor:voltage:2p5vcpuvppabcd",
"description": "2P5V_CPU_VPP_ABCD (V)",
"health": "ok",
"severity": "info",
"value": "",
"updatedAt": "2021-09-24T20:42:14Z"
},
{
"name": "v6h:sensor:voltage:2p5vstby",
"description": "2P5V_STBY (V)",
"health": "ok",
"severity": "info",
"value": "",
"updatedAt": "2021-09-24T20:42:14Z"
},
{
"name": "v6h:sensor:voltage:2p5vvppefgh",
"description": "2P5V_VPP_EFGH (V)",
"health": "ok",
"severity": "info",
"value": "",
"updatedAt": "2021-09-24T20:42:14Z"
},
{
"name": "v6h:sensor:voltage:3p0vasw",
"description": "3P0V_ASW (V)",
"health": "ok",
"severity": "info",
"value": "",
"updatedAt": "2021-09-24T20:42:14Z"
},
{
"name": "v6h:sensor:voltage:3p0vatse1",
"description": "3P0V_ATSE1 (V)",
"health": "ok",
"severity": "info",
"value": "",
"updatedAt": "2021-09-24T20:42:14Z"
},
{
"name": "v6h:sensor:voltage:3p3v",
"description": "3P3V (V)",
"health": "ok",
"severity": "info",
"value": "",
"updatedAt": "2021-09-24T20:42:14Z"
},
{
"name": "v6h:sensor:voltage:3p3voptasw",
"description": "3P3V_OPT_ASW (V)",
"health": "ok",
"severity": "info",
"value": "",
"updatedAt": "2021-09-24T20:42:14Z"
},
{
"name": "v6h:sensor:voltage:3p3vpch",
"description": "3P3V_PCH (V)",
"health": "ok",
"severity": "info",
"value": "",
"updatedAt": "2021-09-24T20:42:14Z"
},
{
"name": "v6h:sensor:voltage:3p3vstby",
"description": "3P3V_STBY (V)",
"health": "ok",
"severity": "info",
"value": "",
"updatedAt": "2021-09-24T20:42:14Z"
},
{
"name": "v6h:sensor:voltage:5p0v",
"description": "5P0V (V)",
"health": "ok",
"severity": "info",
"value": "",
"updatedAt": "2021-09-24T20:42:14Z"
},
{
"name": "v6h:sensor:voltage:5p0vstby",
"description": "5P0V_STBY (V)",
"health": "ok",
"severity": "info",
"value": "",
"updatedAt": "2021-09-24T20:42:14Z"
}
]
}
},
{
"key": "appliance/hardware/memory",
"state": {
"name": "Memory",
"health": "ok",
"severity": "info"
},
"attributes": {
"attribute": [
{
"name": "memory:sensor:temperature",
"description": "Memory DIMM temperature (C)",
"health": "ok",
"severity": "info",
"value": "",
"updatedAt": "2021-09-24T20:42:13Z"
},
{
"name": "rasdaemon:mc:corrected:event",
"description": "RAS Daemon MC corrected event",
"health": "ok",
"severity": "info",
"value": "0",
"updatedAt": "2022-01-24T05:28:38Z"
},
{
"name": "rasdaemon:mc:fatal:event",
"description": "RAS Daemon MC fatal event",
"health": "ok",
"severity": "info",
"value": "0",
"updatedAt": "2022-01-24T05:28:38Z"
},
{
"name": "rasdaemon:mc:uncorrected:event",
"description": "RAS Daemon MC uncorrected event",
"health": "ok",
"severity": "info",
"value": "0",
"updatedAt": "2022-01-24T05:28:38Z"
},
{
"name": "v6h:thermal-fault:vddq-abcd-vr-hot",
"description": "VDDQ_ABCD_VR_HOT thermal fault",
"health": "ok",
"severity": "info",
"value": "0",
"updatedAt": "2022-01-22T22:13:38Z"
},
{
"name": "v6h:thermal-fault:vddq-efgh-vr-hot",
"description": "VDDQ_EFGH_VR_HOT thermal fault",
"health": "ok",
"severity": "info",
"value": "0",
"updatedAt": "2022-01-22T22:13:38Z"
}
]
}
},
{
"key": "appliance/hardware/optics",
"state": {
"name": "Optics",
"health": "ok",
"severity": "info"
}
},
{
"key": "appliance/hardware/optics/optic1",
"state": {
"name": "Optic 1.0",
"health": "ok",
"severity": "info"
},
"attributes": {
"attribute": [
{
"name": "optics:rx-power:alarm-warning-stats",
"description": "Latched RX-Power alarm warning stats",
"health": "ok",
"severity": "info",
"value": "0",
"updatedAt": "2022-01-24T05:27:44Z"
},
{
"name": "optics:rx1-power",
"description": "RX power, channel 1",
"health": "ok",
"severity": "info",
"value": "0.32",
"updatedAt": "2022-01-24T05:27:44Z"
},
{
"name": "optics:rx2-power",
"description": "RX power, channel 2",
"health": "ok",
"severity": "info",
"value": "0.32",
"updatedAt": "2022-01-24T05:27:44Z"
},
{
"name": "optics:rx3-power",
"description": "RX power, channel 3",
"health": "ok",
"severity": "info",
"value": "0.32",
"updatedAt": "2022-01-24T05:27:44Z"
},
{
"name": "optics:rx4-power",
"description": "RX power, channel 4",
"health": "ok",
"severity": "info",
"value": "0.32",
"updatedAt": "2022-01-24T05:27:44Z"
},
{
"name": "optics:temperature",
"description": "Temperature (C)",
"health": "ok",
"severity": "info",
"value": "34",
"updatedAt": "2022-01-24T05:27:44Z"
},
{
"name": "optics:temperature:alarm-warning-stats",
"description": "Latched temperature alarm warning stats",
"health": "ok",
"severity": "info",
"value": "0",
"updatedAt": "2022-01-24T05:27:44Z"
},
{
"name": "optics:tx-bias:alarm-warning-stats",
"description": "Latched Tx-Bias alarm warning stats",
"health": "ok",
"severity": "info",
"value": "0",
"updatedAt": "2022-01-24T05:27:44Z"
},
{
"name": "optics:tx-fault",
"description": "TX Fault",
"health": "ok",
"severity": "info",
"value": "0",
"updatedAt": "2022-01-24T05:27:44Z"
},
{
"name": "optics:tx-power:alarm-warning-stats",
"description": "Latched TX-Power alarm warning stats",
"health": "ok",
"severity": "info",
"value": "0",
"updatedAt": "2022-01-24T05:27:44Z"
},
{
"name": "optics:tx-rx-los",
"description": "TX RX LOS",
"health": "ok",
"severity": "info",
"value": "0",
"updatedAt": "2022-01-24T05:27:44Z"
},
{
"name": "optics:tx1-bias",
"description": "TX bias, channel 1",
"health": "ok",
"severity": "info",
"value": "0.006012",
"updatedAt": "2022-01-24T05:27:44Z"
},
{
"name": "optics:tx1-power",
"description": "TX power, channel 1",
"health": "ok",
"severity": "info",
"value": "-0.24",
"updatedAt": "2022-01-24T05:27:44Z"
},
{
"name": "optics:tx2-bias",
"description": "TX bias, channel 2",
"health": "ok",
"severity": "info",
"value": "0.006006",
"updatedAt": "2022-01-24T05:27:44Z"
},
{
"name": "optics:tx2-power",
"description": "TX power, channel 2",
"health": "ok",
"severity": "info",
"value": "-0.24",
"updatedAt": "2022-01-24T05:27:44Z"
},
{
"name": "optics:tx3-bias",
"description": "TX bias, channel 3",
"health": "ok",
"severity": "info",
"value": "0.005998",
"updatedAt": "2022-01-24T05:27:44Z"
},
{
"name": "optics:tx3-power",
"description": "TX power, channel 3",
"health": "ok",
"severity": "info",
"value": "-0.25",
"updatedAt": "2022-01-24T05:27:44Z"
},
{
"name": "optics:tx4-bias",
"description": "TX bias, channel 4",
"health": "ok",
"severity": "info",
"value": "0.005992",
"updatedAt": "2022-01-24T05:27:44Z"
},
{
"name": "optics:tx4-power",
"description": "TX power, channel 4",
"health": "ok",
"severity": "info",
"value": "-0.25",
"updatedAt": "2022-01-24T05:27:44Z"
},
{
"name": "optics:voltage",
"description": "Voltage (V)",
"health": "ok",
"severity": "info",
"value": "3.278",
"updatedAt": "2022-01-24T05:27:44Z"
},
{
"name": "optics:voltage:alarm-warning-stats",
"description": "Latched voltage alarm warning stats",
"health": "ok",
"severity": "info",
"value": "0",
"updatedAt": "2022-01-24T05:27:44Z"
}
]
}
},
{
"key": "appliance/hardware/optics/optic10",
"state": {
"name": "Optic 10.0",
"health": "ok",
"severity": "info"
},
"attributes": {
"attribute": [
{
"name": "optics:rx-power:alarm-warning-stats",
"description": "Latched RX-Power alarm warning stats",
"health": "ok",
"severity": "info",
"value": "0",
"updatedAt": "2021-09-24T20:42:13Z"
},
{
"name": "optics:rx1-power",
"description": "RX power, channel 1",
"health": "ok",
"severity": "info",
"value": "0",
"updatedAt": "2021-09-24T20:42:13Z"
},
{
"name": "optics:rx2-power",
"description": "RX power, channel 2",
"health": "ok",
"severity": "info",
"value": "0",
"updatedAt": "2021-09-24T20:42:13Z"
},
{
"name": "optics:rx3-power",
"description": "RX power, channel 3",
"health": "ok",
"severity": "info",
"value": "0",
"updatedAt": "2021-09-24T20:42:13Z"
},
{
"name": "optics:rx4-power",
"description": "RX power, channel 4",
"health": "ok",
"severity": "info",
"value": "0",
"updatedAt": "2021-09-24T20:42:13Z"
},
{
"name": "optics:temperature",
"description": "Temperature (C)",
"health": "ok",
"severity": "info",
"value": "0",
"updatedAt": "2021-09-24T20:42:13Z"
},
{
"name": "optics:temperature:alarm-warning-stats",
"description": "Latched temperature alarm warning stats",
"health": "ok",
"severity": "info",
"value": "0",
"updatedAt": "2021-09-24T20:42:13Z"
},
{
"name": "optics:tx-bias:alarm-warning-stats",
"description": "Latched Tx-Bias alarm warning stats",
"health": "ok",
"severity": "info",
"value": "0",
"updatedAt": "2021-09-24T20:42:13Z"
},
{
"name": "optics:tx-fault",
"description": "TX Fault",
"health": "ok",
"severity": "info",
"value": "0",
"updatedAt": "2021-09-24T20:42:13Z"
},
{
"name": "optics:tx-power:alarm-warning-stats",
"description": "Latched TX-Power alarm warning stats",
"health": "ok",
"severity": "info",
"value": "0",
"updatedAt": "2021-09-24T20:42:13Z"
},
{
"name": "optics:tx-rx-los",
"description": "TX RX LOS",
"health": "ok",
"severity": "info",
"value": "0",
"updatedAt": "2021-09-24T20:42:13Z"
},
{
"name": "optics:tx1-bias",
"description": "TX bias, channel 1",
"health": "ok",
"severity": "info",
"value": "0",
"updatedAt": "2021-09-24T20:42:13Z"
},
{
"name": "optics:tx1-power",
"description": "TX power, channel 1",
"health": "ok",
"severity": "info",
"value": "0",
"updatedAt": "2021-09-24T20:42:13Z"
},
{
"name": "optics:tx2-bias",
"description": "TX bias, channel 2",
"health": "ok",
"severity": "info",
"value": "0",
"updatedAt": "2021-09-24T20:42:13Z"
},
{
"name": "optics:tx2-power",
"description": "TX power, channel 2",
"health": "ok",
"severity": "info",
"value": "0",
"updatedAt": "2021-09-24T20:42:13Z"
},
{
"name": "optics:tx3-bias",
"description": "TX bias, channel 3",
"health": "ok",
"severity": "info",
"value": "0",
"updatedAt": "2021-09-24T20:42:13Z"
},
{
"name": "optics:tx3-power",
"description": "TX power, channel 3",
"health": "ok",
"severity": "info",
"value": "0",
"updatedAt": "2021-09-24T20:42:13Z"
},
{
"name": "optics:tx4-bias",
"description": "TX bias, channel 4",
"health": "ok",
"severity": "info",
"value": "0",
"updatedAt": "2021-09-24T20:42:13Z"
},
{
"name": "optics:tx4-power",
"description": "TX power, channel 4",
"health": "ok",
"severity": "info",
"value": "0",
"updatedAt": "2021-09-24T20:42:13Z"
},
{
"name": "optics:voltage",
"description": "Voltage (V)",
"health": "ok",
"severity": "info",
"value": "0",
"updatedAt": "2021-09-24T20:42:13Z"
},
{
"name": "optics:voltage:alarm-warning-stats",
"description": "Latched voltage alarm warning stats",
"health": "ok",
"severity": "info",
"value": "0",
"updatedAt": "2021-09-24T20:42:13Z"
}
]
}
},
{
"key": "appliance/hardware/optics/optic2",
"state": {
"name": "Optic 2.0",
"health": "ok",
"severity": "info"
},
"attributes": {
"attribute": [
{
"name": "optics:rx-power:alarm-warning-stats",
"description": "Latched RX-Power alarm warning stats",
"health": "ok",
"severity": "info",
"value": "0",
"updatedAt": "2022-01-24T05:27:46Z"
},
{
"name": "optics:rx1-power",
"description": "RX power, channel 1",
"health": "ok",
"severity": "info",
"value": "1.89",
"updatedAt": "2022-01-24T05:27:46Z"
},
{
"name": "optics:rx2-power",
"description": "RX power, channel 2",
"health": "ok",
"severity": "info",
"value": "2",
"updatedAt": "2022-01-24T05:27:46Z"
},
{
"name": "optics:rx3-power",
"description": "RX power, channel 3",
"health": "ok",
"severity": "info",
"value": "2.07",
"updatedAt": "2022-01-24T05:27:46Z"
},
{
"name": "optics:rx4-power",
"description": "RX power, channel 4",
"health": "ok",
"severity": "info",
"value": "1.83",
"updatedAt": "2022-01-24T05:27:46Z"
},
{
"name": "optics:temperature",
"description": "Temperature (C)",
"health": "ok",
"severity": "info",
"value": "36.9453",
"updatedAt": "2022-01-24T05:27:46Z"
},
{
"name": "optics:temperature:alarm-warning-stats",
"description": "Latched temperature alarm warning stats",
"health": "ok",
"severity": "info",
"value": "0",
"updatedAt": "2022-01-24T05:27:46Z"
},
{
"name": "optics:tx-bias:alarm-warning-stats",
"description": "Latched Tx-Bias alarm warning stats",
"health": "ok",
"severity": "info",
"value": "0",
"updatedAt": "2022-01-24T05:27:46Z"
},
{
"name": "optics:tx-fault",
"description": "TX Fault",
"health": "ok",
"severity": "info",
"value": "0",
"updatedAt": "2022-01-24T05:27:46Z"
},
{
"name": "optics:tx-power:alarm-warning-stats",
"description": "Latched TX-Power alarm warning stats",
"health": "ok",
"severity": "info",
"value": "0",
"updatedAt": "2022-01-24T05:27:46Z"
},
{
"name": "optics:tx-rx-los",
"description": "TX RX LOS",
"health": "ok",
"severity": "info",
"value": "0",
"updatedAt": "2022-01-24T05:27:46Z"
},
{
"name": "optics:tx1-bias",
"description": "TX bias, channel 1",
"health": "ok",
"severity": "info",
"value": "0.006168",
"updatedAt": "2022-01-24T05:27:46Z"
},
{
"name": "optics:tx1-power",
"description": "TX power, channel 1",
"health": "ok",
"severity": "info",
"value": "2.55",
"updatedAt": "2022-01-24T05:27:46Z"
},
{
"name": "optics:tx2-bias",
"description": "TX bias, channel 2",
"health": "ok",
"severity": "info",
"value": "0.006358",
"updatedAt": "2022-01-24T05:27:46Z"
},
{
"name": "optics:tx2-power",
"description": "TX power, channel 2",
"health": "ok",
"severity": "info",
"value": "2.61",
"updatedAt": "2022-01-24T05:27:46Z"
},
{
"name": "optics:tx3-bias",
"description": "TX bias, channel 3",
"health": "ok",
"severity": "info",
"value": "0.006232",
"updatedAt": "2022-01-24T05:27:46Z"
},
{
"name": "optics:tx3-power",
"description": "TX power, channel 3",
"health": "ok",
"severity": "info",
"value": "2.51",
"updatedAt": "2022-01-24T05:27:46Z"
},
{
"name": "optics:tx4-bias",
"description": "TX bias, channel 4",
"health": "ok",
"severity": "info",
"value": "0.006168",
"updatedAt": "2022-01-24T05:27:46Z"
},
{
"name": "optics:tx4-power",
"description": "TX power, channel 4",
"health": "ok",
"severity": "info",
"value": "2.47",
"updatedAt": "2022-01-24T05:27:46Z"
},
{
"name": "optics:voltage",
"description": "Voltage (V)",
"health": "ok",
"severity": "info",
"value": "3.3157",
"updatedAt": "2022-01-24T05:27:46Z"
},
{
"name": "optics:voltage:alarm-warning-stats",
"description": "Latched voltage alarm warning stats",
"health": "ok",
"severity": "info",
"value": "0",
"updatedAt": "2022-01-24T05:27:46Z"
}
]
}
},
{
"key": "appliance/hardware/optics/optic3",
"state": {
"name": "Optic 3.0",
"health": "ok",
"severity": "info"
},
"attributes": {
"attribute": [
{
"name": "optics:rx-power:alarm-warning-stats",
"description": "Latched RX-Power alarm warning stats",
"health": "ok",
"severity": "info",
"value": "0",
"updatedAt": "2021-09-24T20:42:13Z"
},
{
"name": "optics:rx1-power",
"description": "RX power, channel 1",
"health": "ok",
"severity": "info",
"value": "0",
"updatedAt": "2021-09-24T20:42:13Z"
},
{
"name": "optics:rx2-power",
"description": "RX power, channel 2",
"health": "ok",
"severity": "info",
"value": "0",
"updatedAt": "2021-09-24T20:42:13Z"
},
{
"name": "optics:rx3-power",
"description": "RX power, channel 3",
"health": "ok",
"severity": "info",
"value": "0",
"updatedAt": "2021-09-24T20:42:13Z"
},
{
"name": "optics:rx4-power",
"description": "RX power, channel 4",
"health": "ok",
"severity": "info",
"value": "0",
"updatedAt": "2021-09-24T20:42:13Z"
},
{
"name": "optics:temperature",
"description": "Temperature (C)",
"health": "ok",
"severity": "info",
"value": "0",
"updatedAt": "2021-09-24T20:42:13Z"
},
{
"name": "optics:temperature:alarm-warning-stats",
"description": "Latched temperature alarm warning stats",
"health": "ok",
"severity": "info",
"value": "0",
"updatedAt": "2021-09-24T20:42:13Z"
},
{
"name": "optics:tx-bias:alarm-warning-stats",
"description": "Latched Tx-Bias alarm warning stats",
"health": "ok",
"severity": "info",
"value": "0",
"updatedAt": "2021-09-24T20:42:13Z"
},
{
"name": "optics:tx-fault",
"description": "TX Fault",
"health": "ok",
"severity": "info",
"value": "0",
"updatedAt": "2021-09-24T20:42:13Z"
},
{
"name": "optics:tx-power:alarm-warning-stats",
"description": "Latched TX-Power alarm warning stats",
"health": "ok",
"severity": "info",
"value": "0",
"updatedAt": "2021-09-24T20:42:13Z"
},
{
"name": "optics:tx-rx-los",
"description": "TX RX LOS",
"health": "ok",
"severity": "info",
"value": "0",
"updatedAt": "2021-09-24T20:42:13Z"
},
{
"name": "optics:tx1-bias",
"description": "TX bias, channel 1",
"health": "ok",
"severity": "info",
"value": "0",
"updatedAt": "2021-09-24T20:42:13Z"
},
{
"name": "optics:tx1-power",
"description": "TX power, channel 1",
"health": "ok",
"severity": "info",
"value": "0",
"updatedAt": "2021-09-24T20:42:13Z"
},
{
"name": "optics:tx2-bias",
"description": "TX bias, channel 2",
"health": "ok",
"severity": "info",
"value": "0",
"updatedAt": "2021-09-24T20:42:13Z"
},
{
"name": "optics:tx2-power",
"description": "TX power, channel 2",
"health": "ok",
"severity": "info",
"value": "0",
"updatedAt": "2021-09-24T20:42:13Z"
},
{
"name": "optics:tx3-bias",
"description": "TX bias, channel 3",
"health": "ok",
"severity": "info",
"value": "0",
"updatedAt": "2021-09-24T20:42:13Z"
},
{
"name": "optics:tx3-power",
"description": "TX power, channel 3",
"health": "ok",
"severity": "info",
"value": "0",
"updatedAt": "2021-09-24T20:42:13Z"
},
{
"name": "optics:tx4-bias",
"description": "TX bias, channel 4",
"health": "ok",
"severity": "info",
"value": "0",
"updatedAt": "2021-09-24T20:42:13Z"
},
{
"name": "optics:tx4-power",
"description": "TX power, channel 4",
"health": "ok",
"severity": "info",
"value": "0",
"updatedAt": "2021-09-24T20:42:13Z"
},
{
"name": "optics:voltage",
"description": "Voltage (V)",
"health": "ok",
"severity": "info",
"value": "0",
"updatedAt": "2021-09-24T20:42:13Z"
},
{
"name": "optics:voltage:alarm-warning-stats",
"description": "Latched voltage alarm warning stats",
"health": "ok",
"severity": "info",
"value": "0",
"updatedAt": "2021-09-24T20:42:13Z"
}
]
}
},
{
"key": "appliance/hardware/optics/optic4",
"state": {
"name": "Optic 4.0",
"health": "ok",
"severity": "info"
},
"attributes": {
"attribute": [
{
"name": "optics:rx-power:alarm-warning-stats",
"description": "Latched RX-Power alarm warning stats",
"health": "ok",
"severity": "info",
"value": "0",
"updatedAt": "2021-09-24T20:42:13Z"
},
{
"name": "optics:rx1-power",
"description": "RX power, channel 1",
"health": "ok",
"severity": "info",
"value": "0",
"updatedAt": "2021-09-24T20:42:13Z"
},
{
"name": "optics:rx2-power",
"description": "RX power, channel 2",
"health": "ok",
"severity": "info",
"value": "0",
"updatedAt": "2021-09-24T20:42:13Z"
},
{
"name": "optics:rx3-power",
"description": "RX power, channel 3",
"health": "ok",
"severity": "info",
"value": "0",
"updatedAt": "2021-09-24T20:42:13Z"
},
{
"name": "optics:rx4-power",
"description": "RX power, channel 4",
"health": "ok",
"severity": "info",
"value": "0",
"updatedAt": "2021-09-24T20:42:13Z"
},
{
"name": "optics:temperature",
"description": "Temperature (C)",
"health": "ok",
"severity": "info",
"value": "0",
"updatedAt": "2021-09-24T20:42:13Z"
},
{
"name": "optics:temperature:alarm-warning-stats",
"description": "Latched temperature alarm warning stats",
"health": "ok",
"severity": "info",
"value": "0",
"updatedAt": "2021-09-24T20:42:13Z"
},
{
"name": "optics:tx-bias:alarm-warning-stats",
"description": "Latched Tx-Bias alarm warning stats",
"health": "ok",
"severity": "info",
"value": "0",
"updatedAt": "2021-09-24T20:42:13Z"
},
{
"name": "optics:tx-fault",
"description": "TX Fault",
"health": "ok",
"severity": "info",
"value": "0",
"updatedAt": "2021-09-24T20:42:13Z"
},
{
"name": "optics:tx-power:alarm-warning-stats",
"description": "Latched TX-Power alarm warning stats",
"health": "ok",
"severity": "info",
"value": "0",
"updatedAt": "2021-09-24T20:42:13Z"
},
{
"name": "optics:tx-rx-los",
"description": "TX RX LOS",
"health": "ok",
"severity": "info",
"value": "0",
"updatedAt": "2021-09-24T20:42:13Z"
},
{
"name": "optics:tx1-bias",
"description": "TX bias, channel 1",
"health": "ok",
"severity": "info",
"value": "0",
"updatedAt": "2021-09-24T20:42:13Z"
},
{
"name": "optics:tx1-power",
"description": "TX power, channel 1",
"health": "ok",
"severity": "info",
"value": "0",
"updatedAt": "2021-09-24T20:42:13Z"
},
{
"name": "optics:tx2-bias",
"description": "TX bias, channel 2",
"health": "ok",
"severity": "info",
"value": "0",
"updatedAt": "2021-09-24T20:42:13Z"
},
{
"name": "optics:tx2-power",
"description": "TX power, channel 2",
"health": "ok",
"severity": "info",
"value": "0",
"updatedAt": "2021-09-24T20:42:13Z"
},
{
"name": "optics:tx3-bias",
"description": "TX bias, channel 3",
"health": "ok",
"severity": "info",
"value": "0",
"updatedAt": "2021-09-24T20:42:13Z"
},
{
"name": "optics:tx3-power",
"description": "TX power, channel 3",
"health": "ok",
"severity": "info",
"value": "0",
"updatedAt": "2021-09-24T20:42:13Z"
},
{
"name": "optics:tx4-bias",
"description": "TX bias, channel 4",
"health": "ok",
"severity": "info",
"value": "0",
"updatedAt": "2021-09-24T20:42:13Z"
},
{
"name": "optics:tx4-power",
"description": "TX power, channel 4",
"health": "ok",
"severity": "info",
"value": "0",
"updatedAt": "2021-09-24T20:42:13Z"
},
{
"name": "optics:voltage",
"description": "Voltage (V)",
"health": "ok",
"severity": "info",
"value": "0",
"updatedAt": "2021-09-24T20:42:13Z"
},
{
"name": "optics:voltage:alarm-warning-stats",
"description": "Latched voltage alarm warning stats",
"health": "ok",
"severity": "info",
"value": "0",
"updatedAt": "2021-09-24T20:42:13Z"
}
]
}
},
{
"key": "appliance/hardware/optics/optic5",
"state": {
"name": "Optic 5.0",
"health": "ok",
"severity": "info"
},
"attributes": {
"attribute": [
{
"name": "optics:rx-power:alarm-warning-stats",
"description": "Latched RX-Power alarm warning stats",
"health": "ok",
"severity": "info",
"value": "0",
"updatedAt": "2021-09-24T20:42:13Z"
},
{
"name": "optics:rx1-power",
"description": "RX power, channel 1",
"health": "ok",
"severity": "info",
"value": "0",
"updatedAt": "2021-09-24T20:42:13Z"
},
{
"name": "optics:rx2-power",
"description": "RX power, channel 2",
"health": "ok",
"severity": "info",
"value": "0",
"updatedAt": "2021-09-24T20:42:13Z"
},
{
"name": "optics:rx3-power",
"description": "RX power, channel 3",
"health": "ok",
"severity": "info",
"value": "0",
"updatedAt": "2021-09-24T20:42:13Z"
},
{
"name": "optics:rx4-power",
"description": "RX power, channel 4",
"health": "ok",
"severity": "info",
"value": "0",
"updatedAt": "2021-09-24T20:42:13Z"
},
{
"name": "optics:temperature",
"description": "Temperature (C)",
"health": "ok",
"severity": "info",
"value": "0",
"updatedAt": "2021-09-24T20:42:13Z"
},
{
"name": "optics:temperature:alarm-warning-stats",
"description": "Latched temperature alarm warning stats",
"health": "ok",
"severity": "info",
"value": "0",
"updatedAt": "2021-09-24T20:42:13Z"
},
{
"name": "optics:tx-bias:alarm-warning-stats",
"description": "Latched Tx-Bias alarm warning stats",
"health": "ok",
"severity": "info",
"value": "0",
"updatedAt": "2021-09-24T20:42:13Z"
},
{
"name": "optics:tx-fault",
"description": "TX Fault",
"health": "ok",
"severity": "info",
"value": "0",
"updatedAt": "2021-09-24T20:42:13Z"
},
{
"name": "optics:tx-power:alarm-warning-stats",
"description": "Latched TX-Power alarm warning stats",
"health": "ok",
"severity": "info",
"value": "0",
"updatedAt": "2021-09-24T20:42:13Z"
},
{
"name": "optics:tx-rx-los",
"description": "TX RX LOS",
"health": "ok",
"severity": "info",
"value": "0",
"updatedAt": "2021-09-24T20:42:13Z"
},
{
"name": "optics:tx1-bias",
"description": "TX bias, channel 1",
"health": "ok",
"severity": "info",
"value": "0",
"updatedAt": "2021-09-24T20:42:13Z"
},
{
"name": "optics:tx1-power",
"description": "TX power, channel 1",
"health": "ok",
"severity": "info",
"value": "0",
"updatedAt": "2021-09-24T20:42:13Z"
},
{
"name": "optics:tx2-bias",
"description": "TX bias, channel 2",
"health": "ok",
"severity": "info",
"value": "0",
"updatedAt": "2021-09-24T20:42:13Z"
},
{
"name": "optics:tx2-power",
"description": "TX power, channel 2",
"health": "ok",
"severity": "info",
"value": "0",
"updatedAt": "2021-09-24T20:42:13Z"
},
{
"name": "optics:tx3-bias",
"description": "TX bias, channel 3",
"health": "ok",
"severity": "info",
"value": "0",
"updatedAt": "2021-09-24T20:42:13Z"
},
{
"name": "optics:tx3-power",
"description": "TX power, channel 3",
"health": "ok",
"severity": "info",
"value": "0",
"updatedAt": "2021-09-24T20:42:13Z"
},
{
"name": "optics:tx4-bias",
"description": "TX bias, channel 4",
"health": "ok",
"severity": "info",
"value": "0",
"updatedAt": "2021-09-24T20:42:13Z"
},
{
"name": "optics:tx4-power",
"description": "TX power, channel 4",
"health": "ok",
"severity": "info",
"value": "0",
"updatedAt": "2021-09-24T20:42:13Z"
},
{
"name": "optics:voltage",
"description": "Voltage (V)",
"health": "ok",
"severity": "info",
"value": "0",
"updatedAt": "2021-09-24T20:42:13Z"
},
{
"name": "optics:voltage:alarm-warning-stats",
"description": "Latched voltage alarm warning stats",
"health": "ok",
"severity": "info",
"value": "0",
"updatedAt": "2021-09-24T20:42:13Z"
}
]
}
},
{
"key": "appliance/hardware/optics/optic6",
"state": {
"name": "Optic 6.0",
"health": "ok",
"severity": "info"
},
"attributes": {
"attribute": [
{
"name": "optics:rx-power:alarm-warning-stats",
"description": "Latched RX-Power alarm warning stats",
"health": "ok",
"severity": "info",
"value": "0",
"updatedAt": "2021-09-24T20:42:13Z"
},
{
"name": "optics:rx1-power",
"description": "RX power, channel 1",
"health": "ok",
"severity": "info",
"value": "0",
"updatedAt": "2021-09-24T20:42:13Z"
},
{
"name": "optics:rx2-power",
"description": "RX power, channel 2",
"health": "ok",
"severity": "info",
"value": "0",
"updatedAt": "2021-09-24T20:42:13Z"
},
{
"name": "optics:rx3-power",
"description": "RX power, channel 3",
"health": "ok",
"severity": "info",
"value": "0",
"updatedAt": "2021-09-24T20:42:13Z"
},
{
"name": "optics:rx4-power",
"description": "RX power, channel 4",
"health": "ok",
"severity": "info",
"value": "0",
"updatedAt": "2021-09-24T20:42:13Z"
},
{
"name": "optics:temperature",
"description": "Temperature (C)",
"health": "ok",
"severity": "info",
"value": "0",
"updatedAt": "2021-09-24T20:42:13Z"
},
{
"name": "optics:temperature:alarm-warning-stats",
"description": "Latched temperature alarm warning stats",
"health": "ok",
"severity": "info",
"value": "0",
"updatedAt": "2021-09-24T20:42:13Z"
},
{
"name": "optics:tx-bias:alarm-warning-stats",
"description": "Latched Tx-Bias alarm warning stats",
"health": "ok",
"severity": "info",
"value": "0",
"updatedAt": "2021-09-24T20:42:13Z"
},
{
"name": "optics:tx-fault",
"description": "TX Fault",
"health": "ok",
"severity": "info",
"value": "0",
"updatedAt": "2021-09-24T20:42:13Z"
},
{
"name": "optics:tx-power:alarm-warning-stats",
"description": "Latched TX-Power alarm warning stats",
"health": "ok",
"severity": "info",
"value": "0",
"updatedAt": "2021-09-24T20:42:13Z"
},
{
"name": "optics:tx-rx-los",
"description": "TX RX LOS",
"health": "ok",
"severity": "info",
"value": "0",
"updatedAt": "2021-09-24T20:42:13Z"
},
{
"name": "optics:tx1-bias",
"description": "TX bias, channel 1",
"health": "ok",
"severity": "info",
"value": "0",
"updatedAt": "2021-09-24T20:42:13Z"
},
{
"name": "optics:tx1-power",
"description": "TX power, channel 1",
"health": "ok",
"severity": "info",
"value": "0",
"updatedAt": "2021-09-24T20:42:13Z"
},
{
"name": "optics:tx2-bias",
"description": "TX bias, channel 2",
"health": "ok",
"severity": "info",
"value": "0",
"updatedAt": "2021-09-24T20:42:13Z"
},
{
"name": "optics:tx2-power",
"description": "TX power, channel 2",
"health": "ok",
"severity": "info",
"value": "0",
"updatedAt": "2021-09-24T20:42:13Z"
},
{
"name": "optics:tx3-bias",
"description": "TX bias, channel 3",
"health": "ok",
"severity": "info",
"value": "0",
"updatedAt": "2021-09-24T20:42:13Z"
},
{
"name": "optics:tx3-power",
"description": "TX power, channel 3",
"health": "ok",
"severity": "info",
"value": "0",
"updatedAt": "2021-09-24T20:42:13Z"
},
{
"name": "optics:tx4-bias",
"description": "TX bias, channel 4",
"health": "ok",
"severity": "info",
"value": "0",
"updatedAt": "2021-09-24T20:42:13Z"
},
{
"name": "optics:tx4-power",
"description": "TX power, channel 4",
"health": "ok",
"severity": "info",
"value": "0",
"updatedAt": "2021-09-24T20:42:13Z"
},
{
"name": "optics:voltage",
"description": "Voltage (V)",
"health": "ok",
"severity": "info",
"value": "0",
"updatedAt": "2021-09-24T20:42:13Z"
},
{
"name": "optics:voltage:alarm-warning-stats",
"description": "Latched voltage alarm warning stats",
"health": "ok",
"severity": "info",
"value": "0",
"updatedAt": "2021-09-24T20:42:13Z"
}
]
}
},
{
"key": "appliance/hardware/optics/optic7",
"state": {
"name": "Optic 7.0",
"health": "ok",
"severity": "info"
},
"attributes": {
"attribute": [
{
"name": "optics:rx-power:alarm-warning-stats",
"description": "Latched RX-Power alarm warning stats",
"health": "ok",
"severity": "info",
"value": "0",
"updatedAt": "2021-09-24T20:42:13Z"
},
{
"name": "optics:rx1-power",
"description": "RX power, channel 1",
"health": "ok",
"severity": "info",
"value": "0",
"updatedAt": "2021-09-24T20:42:13Z"
},
{
"name": "optics:rx2-power",
"description": "RX power, channel 2",
"health": "ok",
"severity": "info",
"value": "0",
"updatedAt": "2021-09-24T20:42:13Z"
},
{
"name": "optics:rx3-power",
"description": "RX power, channel 3",
"health": "ok",
"severity": "info",
"value": "0",
"updatedAt": "2021-09-24T20:42:13Z"
},
{
"name": "optics:rx4-power",
"description": "RX power, channel 4",
"health": "ok",
"severity": "info",
"value": "0",
"updatedAt": "2021-09-24T20:42:13Z"
},
{
"name": "optics:temperature",
"description": "Temperature (C)",
"health": "ok",
"severity": "info",
"value": "0",
"updatedAt": "2021-09-24T20:42:13Z"
},
{
"name": "optics:temperature:alarm-warning-stats",
"description": "Latched temperature alarm warning stats",
"health": "ok",
"severity": "info",
"value": "0",
"updatedAt": "2021-09-24T20:42:13Z"
},
{
"name": "optics:tx-bias:alarm-warning-stats",
"description": "Latched Tx-Bias alarm warning stats",
"health": "ok",
"severity": "info",
"value": "0",
"updatedAt": "2021-09-24T20:42:13Z"
},
{
"name": "optics:tx-fault",
"description": "TX Fault",
"health": "ok",
"severity": "info",
"value": "0",
"updatedAt": "2021-09-24T20:42:13Z"
},
{
"name": "optics:tx-power:alarm-warning-stats",
"description": "Latched TX-Power alarm warning stats",
"health": "ok",
"severity": "info",
"value": "0",
"updatedAt": "2021-09-24T20:42:13Z"
},
{
"name": "optics:tx-rx-los",
"description": "TX RX LOS",
"health": "ok",
"severity": "info",
"value": "0",
"updatedAt": "2021-09-24T20:42:13Z"
},
{
"name": "optics:tx1-bias",
"description": "TX bias, channel 1",
"health": "ok",
"severity": "info",
"value": "0",
"updatedAt": "2021-09-24T20:42:13Z"
},
{
"name": "optics:tx1-power",
"description": "TX power, channel 1",
"health": "ok",
"severity": "info",
"value": "0",
"updatedAt": "2021-09-24T20:42:13Z"
},
{
"name": "optics:tx2-bias",
"description": "TX bias, channel 2",
"health": "ok",
"severity": "info",
"value": "0",
"updatedAt": "2021-09-24T20:42:13Z"
},
{
"name": "optics:tx2-power",
"description": "TX power, channel 2",
"health": "ok",
"severity": "info",
"value": "0",
"updatedAt": "2021-09-24T20:42:13Z"
},
{
"name": "optics:tx3-bias",
"description": "TX bias, channel 3",
"health": "ok",
"severity": "info",
"value": "0",
"updatedAt": "2021-09-24T20:42:13Z"
},
{
"name": "optics:tx3-power",
"description": "TX power, channel 3",
"health": "ok",
"severity": "info",
"value": "0",
"updatedAt": "2021-09-24T20:42:13Z"
},
{
"name": "optics:tx4-bias",
"description": "TX bias, channel 4",
"health": "ok",
"severity": "info",
"value": "0",
"updatedAt": "2021-09-24T20:42:13Z"
},
{
"name": "optics:tx4-power",
"description": "TX power, channel 4",
"health": "ok",
"severity": "info",
"value": "0",
"updatedAt": "2021-09-24T20:42:13Z"
},
{
"name": "optics:voltage",
"description": "Voltage (V)",
"health": "ok",
"severity": "info",
"value": "0",
"updatedAt": "2021-09-24T20:42:13Z"
},
{
"name": "optics:voltage:alarm-warning-stats",
"description": "Latched voltage alarm warning stats",
"health": "ok",
"severity": "info",
"value": "0",
"updatedAt": "2021-09-24T20:42:13Z"
}
]
}
},
{
"key": "appliance/hardware/optics/optic8",
"state": {
"name": "Optic 8.0",
"health": "ok",
"severity": "info"
},
"attributes": {
"attribute": [
{
"name": "optics:rx-power:alarm-warning-stats",
"description": "Latched RX-Power alarm warning stats",
"health": "ok",
"severity": "info",
"value": "0",
"updatedAt": "2022-01-24T05:27:46Z"
},
{
"name": "optics:rx1-power",
"description": "RX power, channel 1",
"health": "ok",
"severity": "info",
"value": "-1.18",
"updatedAt": "2022-01-24T05:27:46Z"
},
{
"name": "optics:rx2-power",
"description": "RX power, channel 2",
"health": "ok",
"severity": "info",
"value": "-10000",
"updatedAt": "2022-01-24T05:27:46Z"
},
{
"name": "optics:rx3-power",
"description": "RX power, channel 3",
"health": "ok",
"severity": "info",
"value": "-10000",
"updatedAt": "2022-01-24T05:27:46Z"
},
{
"name": "optics:rx4-power",
"description": "RX power, channel 4",
"health": "ok",
"severity": "info",
"value": "-10000",
"updatedAt": "2022-01-24T05:27:46Z"
},
{
"name": "optics:temperature",
"description": "Temperature (C)",
"health": "ok",
"severity": "info",
"value": "37.2421",
"updatedAt": "2022-01-24T05:27:46Z"
},
{
"name": "optics:temperature:alarm-warning-stats",
"description": "Latched temperature alarm warning stats",
"health": "ok",
"severity": "info",
"value": "0",
"updatedAt": "2022-01-24T05:27:46Z"
},
{
"name": "optics:tx-bias:alarm-warning-stats",
"description": "Latched Tx-Bias alarm warning stats",
"health": "ok",
"severity": "info",
"value": "0",
"updatedAt": "2022-01-24T05:27:46Z"
},
{
"name": "optics:tx-fault",
"description": "TX Fault",
"health": "ok",
"severity": "info",
"value": "0",
"updatedAt": "2022-01-24T05:27:46Z"
},
{
"name": "optics:tx-power:alarm-warning-stats",
"description": "Latched TX-Power alarm warning stats",
"health": "ok",
"severity": "info",
"value": "0",
"updatedAt": "2022-01-24T05:27:46Z"
},
{
"name": "optics:tx-rx-los",
"description": "TX RX LOS",
"health": "ok",
"severity": "info",
"value": "0",
"updatedAt": "2022-01-24T05:27:46Z"
},
{
"name": "optics:tx1-bias",
"description": "TX bias, channel 1",
"health": "ok",
"severity": "info",
"value": "0.00801",
"updatedAt": "2022-01-24T05:27:46Z"
},
{
"name": "optics:tx1-power",
"description": "TX power, channel 1",
"health": "ok",
"severity": "info",
"value": "-0.7",
"updatedAt": "2022-01-24T05:27:46Z"
},
{
"name": "optics:tx2-bias",
"description": "TX bias, channel 2",
"health": "ok",
"severity": "info",
"value": "4294.967295",
"updatedAt": "2022-01-24T05:27:46Z"
},
{
"name": "optics:tx2-power",
"description": "TX power, channel 2",
"health": "ok",
"severity": "info",
"value": "-10000",
"updatedAt": "2022-01-24T05:27:46Z"
},
{
"name": "optics:tx3-bias",
"description": "TX bias, channel 3",
"health": "ok",
"severity": "info",
"value": "4294.967295",
"updatedAt": "2022-01-24T05:27:46Z"
},
{
"name": "optics:tx3-power",
"description": "TX power, channel 3",
"health": "ok",
"severity": "info",
"value": "-10000",
"updatedAt": "2022-01-24T05:27:46Z"
},
{
"name": "optics:tx4-bias",
"description": "TX bias, channel 4",
"health": "ok",
"severity": "info",
"value": "4294.967295",
"updatedAt": "2022-01-24T05:27:46Z"
},
{
"name": "optics:tx4-power",
"description": "TX power, channel 4",
"health": "ok",
"severity": "info",
"value": "-10000",
"updatedAt": "2022-01-24T05:27:46Z"
},
{
"name": "optics:voltage",
"description": "Voltage (V)",
"health": "ok",
"severity": "info",
"value": "3.3483",
"updatedAt": "2022-01-24T05:27:46Z"
},
{
"name": "optics:voltage:alarm-warning-stats",
"description": "Latched voltage alarm warning stats",
"health": "ok",
"severity": "info",
"value": "0",
"updatedAt": "2022-01-24T05:27:46Z"
}
]
}
},
{
"key": "appliance/hardware/optics/optic9",
"state": {
"name": "Optic 9.0",
"health": "ok",
"severity": "info"
},
"attributes": {
"attribute": [
{
"name": "optics:rx-power:alarm-warning-stats",
"description": "Latched RX-Power alarm warning stats",
"health": "ok",
"severity": "info",
"value": "0",
"updatedAt": "2022-01-24T05:27:46Z"
},
{
"name": "optics:rx1-power",
"description": "RX power, channel 1",
"health": "ok",
"severity": "info",
"value": "-0.46",
"updatedAt": "2022-01-24T05:27:46Z"
},
{
"name": "optics:rx2-power",
"description": "RX power, channel 2",
"health": "ok",
"severity": "info",
"value": "-10000",
"updatedAt": "2022-01-24T05:27:46Z"
},
{
"name": "optics:rx3-power",
"description": "RX power, channel 3",
"health": "ok",
"severity": "info",
"value": "-10000",
"updatedAt": "2022-01-24T05:27:46Z"
},
{
"name": "optics:rx4-power",
"description": "RX power, channel 4",
"health": "ok",
"severity": "info",
"value": "-10000",
"updatedAt": "2022-01-24T05:27:46Z"
},
{
"name": "optics:temperature",
"description": "Temperature (C)",
"health": "ok",
"severity": "info",
"value": "33.9726",
"updatedAt": "2022-01-24T05:27:46Z"
},
{
"name": "optics:temperature:alarm-warning-stats",
"description": "Latched temperature alarm warning stats",
"health": "ok",
"severity": "info",
"value": "0",
"updatedAt": "2022-01-24T05:27:46Z"
},
{
"name": "optics:tx-bias:alarm-warning-stats",
"description": "Latched Tx-Bias alarm warning stats",
"health": "ok",
"severity": "info",
"value": "0",
"updatedAt": "2022-01-24T05:27:46Z"
},
{
"name": "optics:tx-fault",
"description": "TX Fault",
"health": "ok",
"severity": "info",
"value": "0",
"updatedAt": "2022-01-24T05:27:46Z"
},
{
"name": "optics:tx-power:alarm-warning-stats",
"description": "Latched TX-Power alarm warning stats",
"health": "ok",
"severity": "info",
"value": "0",
"updatedAt": "2022-01-24T05:27:46Z"
},
{
"name": "optics:tx-rx-los",
"description": "TX RX LOS",
"health": "ok",
"severity": "info",
"value": "0",
"updatedAt": "2022-01-24T05:27:46Z"
},
{
"name": "optics:tx1-bias",
"description": "TX bias, channel 1",
"health": "ok",
"severity": "info",
"value": "0.008022",
"updatedAt": "2022-01-24T05:27:46Z"
},
{
"name": "optics:tx1-power",
"description": "TX power, channel 1",
"health": "ok",
"severity": "info",
"value": "-0.82",
"updatedAt": "2022-01-24T05:27:46Z"
},
{
"name": "optics:tx2-bias",
"description": "TX bias, channel 2",
"health": "ok",
"severity": "info",
"value": "4294.967295",
"updatedAt": "2022-01-24T05:27:46Z"
},
{
"name": "optics:tx2-power",
"description": "TX power, channel 2",
"health": "ok",
"severity": "info",
"value": "-10000",
"updatedAt": "2022-01-24T05:27:46Z"
},
{
"name": "optics:tx3-bias",
"description": "TX bias, channel 3",
"health": "ok",
"severity": "info",
"value": "4294.967295",
"updatedAt": "2022-01-24T05:27:46Z"
},
{
"name": "optics:tx3-power",
"description": "TX power, channel 3",
"health": "ok",
"severity": "info",
"value": "-10000",
"updatedAt": "2022-01-24T05:27:46Z"
},
{
"name": "optics:tx4-bias",
"description": "TX bias, channel 4",
"health": "ok",
"severity": "info",
"value": "4294.967295",
"updatedAt": "2022-01-24T05:27:46Z"
},
{
"name": "optics:tx4-power",
"description": "TX power, channel 4",
"health": "ok",
"severity": "info",
"value": "-10000",
"updatedAt": "2022-01-24T05:27:46Z"
},
{
"name": "optics:voltage",
"description": "Voltage (V)",
"health": "ok",
"severity": "info",
"value": "3.3885",
"updatedAt": "2022-01-24T05:27:46Z"
},
{
"name": "optics:voltage:alarm-warning-stats",
"description": "Latched voltage alarm warning stats",
"health": "ok",
"severity": "info",
"value": "0",
"updatedAt": "2022-01-24T05:27:46Z"
}
]
}
},
{
"key": "appliance/hardware/psu",
"state": {
"name": "PSU Subsystem",
"health": "ok",
"severity": "notice"
},
"attributes": {
"attribute": [
{
"name": "psu:mismatch",
"description": "PSU Configuration Mismatch",
"health": "ok",
"severity": "info",
"value": "0",
"updatedAt": "2021-09-24T20:42:13Z"
}
]
}
},
{
"key": "appliance/hardware/qat",
"state": {
"name": "QAT",
"health": "ok",
"severity": "info"
}
},
{
"key": "appliance/hardware/tpm",
"state": {
"name": "TPM",
"health": "ok",
"severity": "info"
},
"attributes": {
"attribute": [
{
"name": "tpm:health",
"description": "TPM Self test",
"health": "ok",
"severity": "info",
"value": "",
"updatedAt": "2021-09-24T20:42:13Z"
}
]
}
}
],
"services": [
{
"key": "appliance/services/alert-service",
"state": {
"name": "alert-service",
"health": "ok",
"severity": "info"
},
"attributes": {
"attribute": [
{
"name": "container:event:attach",
"description": "Container attach event",
"health": "ok",
"severity": "info",
"value": "0",
"updatedAt": "2021-09-24T20:42:29Z"
},
{
"name": "container:event:die",
"description": "Container die event",
"health": "ok",
"severity": "info",
"value": "0",
"updatedAt": "2021-09-24T20:42:29Z"
},
{
"name": "container:event:exec-create",
"description": "Container exec create event",
"health": "ok",
"severity": "info",
"value": "0",
"updatedAt": "2021-09-24T20:42:29Z"
},
{
"name": "container:event:exec-detach",
"description": "Container exec detach event",
"health": "ok",
"severity": "info",
"value": "0",
"updatedAt": "2021-09-24T20:42:29Z"
},
{
"name": "container:event:exec-die",
"description": "Container exec die event",
"health": "ok",
"severity": "info",
"value": "0",
"updatedAt": "2021-09-24T20:42:29Z"
},
{
"name": "container:event:exec-start",
"description": "Container exec start event",
"health": "ok",
"severity": "info",
"value": "0",
"updatedAt": "2021-09-24T20:42:29Z"
},
{
"name": "container:event:kill",
"description": "Container kill event",
"health": "ok",
"severity": "info",
"value": "0",
"updatedAt": "2021-09-24T20:42:29Z"
},
{
"name": "container:event:restart",
"description": "Container restart event",
"health": "ok",
"severity": "info",
"value": "0",
"updatedAt": "2021-09-24T20:42:29Z"
},
{
"name": "container:event:restart-last-hour",
"description": "Container restart count in the last hour",
"health": "ok",
"severity": "info",
"value": "0",
"updatedAt": "2021-09-24T20:42:29Z"
},
{
"name": "container:event:start",
"description": "Container start event",
"health": "ok",
"severity": "info",
"value": "0",
"updatedAt": "2021-09-24T20:42:29Z"
},
{
"name": "container:event:stop",
"description": "Container stop event",
"health": "ok",
"severity": "info",
"value": "0",
"updatedAt": "2021-09-24T20:42:29Z"
},
{
"name": "container:running",
"description": "Container running",
"health": "ok",
"severity": "info",
"value": "false",
"updatedAt": "2021-09-24T20:42:29Z"
},
{
"name": "service:component:version",
"description": "Service component version",
"health": "ok",
"severity": "info",
"value": "",
"updatedAt": "2021-09-24T20:42:29Z"
},
{
"name": "service:file-watcher-error",
"description": "Service file watcher error",
"health": "ok",
"severity": "info",
"value": "false",
"updatedAt": "2021-09-24T20:42:29Z"
},
{
"name": "service:message-error",
"description": "Service health monitor error",
"health": "ok",
"severity": "info",
"value": "",
"updatedAt": "2022-01-22T22:13:38Z"
},
{
"name": "service:message-error-count",
"description": "Service health monitor error count",
"health": "ok",
"severity": "info",
"value": "0",
"updatedAt": "2021-09-24T20:42:29Z"
},
{
"name": "service:overall-health",
"description": "Service reported overall health",
"health": "ok",
"severity": "info",
"value": "Ok",
"updatedAt": "2022-01-22T22:13:38Z"
},
{
"name": "service:ready",
"description": "Service ready status",
"health": "ok",
"severity": "info",
"value": "true",
"updatedAt": "2022-01-22T22:13:38Z"
},
{
"name": "service:restart-count",
"description": "Service total restart count",
"health": "ok",
"severity": "info",
"value": "0",
"updatedAt": "2022-01-22T22:13:38Z"
},
{
"name": "service:restart-last-hour",
"description": "Service restart count in the last hour",
"health": "ok",
"severity": "info",
"value": "0",
"updatedAt": "2021-09-24T20:42:29Z"
},
{
"name": "service:startup-timestamp",
"description": "Service startup timestamp",
"health": "ok",
"severity": "info",
"value": "2022-01-22T22:13:15.120535997Z",
"updatedAt": "2022-01-22T22:13:38Z"
},
{
"name": "service:version",
"description": "Service version",
"health": "ok",
"severity": "info",
"value": "3.7.1",
"updatedAt": "2022-01-22T22:13:38Z"
}
]
}
},
{
"key": "appliance/services/appliance_orchestration_manager",
"state": {
"name": "appliance_orchestration_manager",
"health": "ok",
"severity": "info"
},
"attributes": {
"attribute": [
{
"name": "container:event:attach",
"description": "Container attach event",
"health": "ok",
"severity": "info",
"value": "0",
"updatedAt": "2021-09-24T20:42:30Z"
},
{
"name": "container:event:die",
"description": "Container die event",
"health": "ok",
"severity": "info",
"value": "0",
"updatedAt": "2021-09-24T20:42:30Z"
},
{
"name": "container:event:exec-create",
"description": "Container exec create event",
"health": "ok",
"severity": "info",
"value": "0",
"updatedAt": "2021-09-24T20:42:30Z"
},
{
"name": "container:event:exec-detach",
"description": "Container exec detach event",
"health": "ok",
"severity": "info",
"value": "0",
"updatedAt": "2021-09-24T20:42:30Z"
},
{
"name": "container:event:exec-die",
"description": "Container exec die event",
"health": "ok",
"severity": "info",
"value": "0",
"updatedAt": "2021-09-24T20:42:30Z"
},
{
"name": "container:event:exec-start",
"description": "Container exec start event",
"health": "ok",
"severity": "info",
"value": "0",
"updatedAt": "2021-09-24T20:42:30Z"
},
{
"name": "container:event:kill",
"description": "Container kill event",
"health": "ok",
"severity": "info",
"value": "0",
"updatedAt": "2021-09-24T20:42:30Z"
},
{
"name": "container:event:restart",
"description": "Container restart event",
"health": "ok",
"severity": "info",
"value": "0",
"updatedAt": "2021-09-24T20:42:30Z"
},
{
"name": "container:event:restart-last-hour",
"description": "Container restart count in the last hour",
"health": "ok",
"severity": "info",
"value": "0",
"updatedAt": "2021-09-24T20:42:30Z"
},
{
"name": "container:event:start",
"description": "Container start event",
"health": "ok",
"severity": "info",
"value": "0",
"updatedAt": "2021-09-24T20:42:30Z"
},
{
"name": "container:event:stop",
"description": "Container stop event",
"health": "ok",
"severity": "info",
"value": "0",
"updatedAt": "2021-09-24T20:42:30Z"
},
{
"name": "container:running",
"description": "Container running",
"health": "ok",
"severity": "info",
"value": "false",
"updatedAt": "2021-09-24T20:42:30Z"
},
{
"name": "service:component:version",
"description": "Service component version",
"health": "ok",
"severity": "info",
"value": "",
"updatedAt": "2021-09-24T20:42:30Z"
},
{
"name": "service:file-watcher-error",
"description": "Service file watcher error",
"health": "ok",
"severity": "info",
"value": "false",
"updatedAt": "2021-09-24T20:42:30Z"
},
{
"name": "service:message-error",
"description": "Service health monitor error",
"health": "ok",
"severity": "info",
"value": "",
"updatedAt": "2022-01-22T22:13:40Z"
},
{
"name": "service:message-error-count",
"description": "Service health monitor error count",
"health": "ok",
"severity": "info",
"value": "0",
"updatedAt": "2021-09-24T20:42:37Z"
},
{
"name": "service:overall-health",
"description": "Service reported overall health",
"health": "ok",
"severity": "info",
"value": "Ok",
"updatedAt": "2022-01-22T22:13:40Z"
},
{
"name": "service:ready",
"description": "Service ready status",
"health": "ok",
"severity": "info",
"value": "true",
"updatedAt": "2022-01-22T22:13:40Z"
},
{
"name": "service:restart-count",
"description": "Service total restart count",
"health": "ok",
"severity": "info",
"value": "0",
"updatedAt": "2022-01-22T22:13:38Z"
},
{
"name": "service:restart-last-hour",
"description": "Service restart count in the last hour",
"health": "ok",
"severity": "info",
"value": "0",
"updatedAt": "2021-11-13T17:36:55Z"
},
{
"name": "service:startup-timestamp",
"description": "Service startup timestamp",
"health": "ok",
"severity": "info",
"value": "2022-01-22T22:13:17.385769125Z",
"updatedAt": "2022-01-22T22:13:40Z"
},
{
"name": "service:version",
"description": "Service version",
"health": "ok",
"severity": "info",
"value": "1.26.4",
"updatedAt": "2022-01-22T22:13:40Z"
}
]
}
},
{
"key": "appliance/services/authentication-mgr",
"state": {
"name": "authentication-mgr",
"health": "ok",
"severity": "info"
},
"attributes": {
"attribute": [
{
"name": "container:event:attach",
"description": "Container attach event",
"health": "ok",
"severity": "info",
"value": "0",
"updatedAt": "2021-09-24T20:42:30Z"
},
{
"name": "container:event:die",
"description": "Container die event",
"health": "ok",
"severity": "info",
"value": "0",
"updatedAt": "2021-09-24T20:42:29Z"
},
{
"name": "container:event:exec-create",
"description": "Container exec create event",
"health": "ok",
"severity": "info",
"value": "0",
"updatedAt": "2022-01-18T01:29:42Z"
},
{
"name": "container:event:exec-detach",
"description": "Container exec detach event",
"health": "ok",
"severity": "info",
"value": "0",
"updatedAt": "2021-09-24T20:42:30Z"
},
{
"name": "container:event:exec-die",
"description": "Container exec die event",
"health": "ok",
"severity": "info",
"value": "0",
"updatedAt": "2021-09-24T20:42:30Z"
},
{
"name": "container:event:exec-start",
"description": "Container exec start event",
"health": "ok",
"severity": "info",
"value": "0",
"updatedAt": "2022-01-18T01:29:42Z"
},
{
"name": "container:event:kill",
"description": "Container kill event",
"health": "ok",
"severity": "info",
"value": "0",
"updatedAt": "2021-12-08T19:43:32Z"
},
{
"name": "container:event:restart",
"description": "Container restart event",
"health": "ok",
"severity": "info",
"value": "0",
"updatedAt": "2022-01-22T22:13:38Z"
},
{
"name": "container:event:restart-last-hour",
"description": "Container restart count in the last hour",
"health": "ok",
"severity": "info",
"value": "0",
"updatedAt": "2021-09-24T20:42:30Z"
},
{
"name": "container:event:start",
"description": "Container start event",
"health": "ok",
"severity": "info",
"value": "0",
"updatedAt": "2021-09-24T20:42:30Z"
},
{
"name": "container:event:stop",
"description": "Container stop event",
"health": "ok",
"severity": "info",
"value": "0",
"updatedAt": "2021-09-24T20:42:30Z"
},
{
"name": "container:running",
"description": "Container running",
"health": "ok",
"severity": "info",
"value": "true",
"updatedAt": "2022-01-24T05:31:38Z"
},
{
"name": "service:component:version",
"description": "Service component version",
"health": "ok",
"severity": "info",
"value": "",
"updatedAt": "2022-01-22T22:13:40Z"
},
{
"name": "service:message-error",
"description": "Service health monitor error",
"health": "ok",
"severity": "info",
"value": "",
"updatedAt": "2022-01-24T05:32:06Z"
},
{
"name": "service:message-error-count",
"description": "Service health monitor error count",
"health": "ok",
"severity": "info",
"value": "0",
"updatedAt": "2021-10-05T17:43:21Z"
},
{
"name": "service:overall-health",
"description": "Service reported overall health",
"health": "ok",
"severity": "info",
"value": "",
"updatedAt": "2021-09-24T20:42:29Z"
},
{
"name": "service:ready",
"description": "Service ready status",
"health": "ok",
"severity": "info",
"value": "true",
"updatedAt": "2022-01-24T05:32:06Z"
},
{
"name": "service:restart-count",
"description": "Service total restart count",
"health": "ok",
"severity": "info",
"value": "0",
"updatedAt": "2022-01-22T22:13:38Z"
},
{
"name": "service:restart-last-hour",
"description": "Service restart count in the last hour",
"health": "ok",
"severity": "info",
"value": "0",
"updatedAt": "2021-09-24T20:42:29Z"
},
{
"name": "service:startup-timestamp",
"description": "Service startup timestamp",
"health": "ok",
"severity": "info",
"value": "2022-01-22T22:13:14.377017935Z",
"updatedAt": "2022-01-24T05:32:06Z"
},
{
"name": "service:version",
"description": "Service version",
"health": "ok",
"severity": "info",
"value": "",
"updatedAt": "2022-01-24T05:32:06Z"
}
]
}
},
{
"key": "appliance/services/authentication-mgr/service",
"state": {
"name": "Authentication Primary Service",
"health": "ok",
"severity": "info"
},
"attributes": {
"attribute": [
{
"name": "Authentication:state",
"description": "Authentication Service State",
"health": "ok",
"severity": "info",
"value": "true",
"updatedAt": "2022-01-24T05:32:06Z"
}
]
}
},
{
"key": "appliance/services/confd-key-migration-mgr",
"state": {
"name": "confd-key-migration-mgr",
"health": "ok",
"severity": "info"
},
"attributes": {
"attribute": [
{
"name": "container:event:attach",
"description": "Container attach event",
"health": "ok",
"severity": "info",
"value": "0",
"updatedAt": "2021-09-24T20:42:30Z"
},
{
"name": "container:event:die",
"description": "Container die event",
"health": "ok",
"severity": "info",
"value": "0",
"updatedAt": "2022-01-22T22:10:39Z"
},
{
"name": "container:event:exec-create",
"description": "Container exec create event",
"health": "ok",
"severity": "info",
"value": "0",
"updatedAt": "2022-01-18T01:30:10Z"
},
{
"name": "container:event:exec-detach",
"description": "Container exec detach event",
"health": "ok",
"severity": "info",
"value": "0",
"updatedAt": "2021-09-24T20:42:30Z"
},
{
"name": "container:event:exec-die",
"description": "Container exec die event",
"health": "ok",
"severity": "info",
"value": "0",
"updatedAt": "2021-09-24T20:42:30Z"
},
{
"name": "container:event:exec-start",
"description": "Container exec start event",
"health": "ok",
"severity": "info",
"value": "0",
"updatedAt": "2022-01-18T01:30:10Z"
},
{
"name": "container:event:kill",
"description": "Container kill event",
"health": "ok",
"severity": "info",
"value": "0",
"updatedAt": "2022-01-22T22:10:38Z"
},
{
"name": "container:event:restart",
"description": "Container restart event",
"health": "ok",
"severity": "info",
"value": "0",
"updatedAt": "2022-01-22T22:13:38Z"
},
{
"name": "container:event:restart-last-hour",
"description": "Container restart count in the last hour",
"health": "ok",
"severity": "info",
"value": "0",
"updatedAt": "2021-09-24T20:42:30Z"
},
{
"name": "container:event:start",
"description": "Container start event",
"health": "ok",
"severity": "info",
"value": "0",
"updatedAt": "2021-09-24T20:42:30Z"
},
{
"name": "container:event:stop",
"description": "Container stop event",
"health": "ok",
"severity": "info",
"value": "0",
"updatedAt": "2022-01-15T06:01:01Z"
},
{
"name": "container:running",
"description": "Container running",
"health": "ok",
"severity": "info",
"value": "true",
"updatedAt": "2022-01-24T05:31:38Z"
},
{
"name": "service:component:version",
"description": "Service component version",
"health": "ok",
"severity": "info",
"value": "",
"updatedAt": "2021-09-24T20:42:30Z"
},
{
"name": "service:file-watcher-error",
"description": "Service file watcher error",
"health": "ok",
"severity": "info",
"value": "false",
"updatedAt": "2021-09-24T20:42:30Z"
},
{
"name": "service:message-error",
"description": "Service health monitor error",
"health": "ok",
"severity": "info",
"value": "",
"updatedAt": "2022-01-22T22:13:38Z"
},
{
"name": "service:message-error-count",
"description": "Service health monitor error count",
"health": "ok",
"severity": "info",
"value": "0",
"updatedAt": "2021-09-24T20:42:30Z"
},
{
"name": "service:overall-health",
"description": "Service reported overall health",
"health": "ok",
"severity": "info",
"value": "Ok",
"updatedAt": "2022-01-22T22:13:38Z"
},
{
"name": "service:ready",
"description": "Service ready status",
"health": "ok",
"severity": "info",
"value": "true",
"updatedAt": "2022-01-22T22:13:38Z"
},
{
"name": "service:restart-count",
"description": "Service total restart count",
"health": "ok",
"severity": "info",
"value": "0",
"updatedAt": "2022-01-22T22:13:38Z"
},
{
"name": "service:restart-last-hour",
"description": "Service restart count in the last hour",
"health": "ok",
"severity": "info",
"value": "0",
"updatedAt": "2021-09-24T20:42:30Z"
},
{
"name": "service:startup-timestamp",
"description": "Service startup timestamp",
"health": "ok",
"severity": "info",
"value": "2022-01-22T22:13:14.377019329Z",
"updatedAt": "2022-01-22T22:13:38Z"
},
{
"name": "service:version",
"description": "Service version",
"health": "ok",
"severity": "info",
"value": "1.8.0~appliance_main.2021_11_10_06_46_48.S49e94298",
"updatedAt": "2022-01-22T22:13:38Z"
}
]
}
},
{
"key": "appliance/services/diag-agent",
"state": {
"name": "diag-agent",
"health": "ok",
"severity": "info"
},
"attributes": {
"attribute": [
{
"name": "container:event:attach",
"description": "Container attach event",
"health": "ok",
"severity": "info",
"value": "0",
"updatedAt": "2021-09-24T20:42:29Z"
},
{
"name": "container:event:die",
"description": "Container die event",
"health": "ok",
"severity": "info",
"value": "0",
"updatedAt": "2021-09-24T20:42:29Z"
},
{
"name": "container:event:exec-create",
"description": "Container exec create event",
"health": "ok",
"severity": "info",
"value": "0",
"updatedAt": "2022-01-18T01:28:20Z"
},
{
"name": "container:event:exec-detach",
"description": "Container exec detach event",
"health": "ok",
"severity": "info",
"value": "0",
"updatedAt": "2021-09-24T20:42:29Z"
},
{
"name": "container:event:exec-die",
"description": "Container exec die event",
"health": "ok",
"severity": "info",
"value": "0",
"updatedAt": "2021-09-24T20:42:29Z"
},
{
"name": "container:event:exec-start",
"description": "Container exec start event",
"health": "ok",
"severity": "info",
"value": "0",
"updatedAt": "2022-01-18T01:28:20Z"
},
{
"name": "container:event:kill",
"description": "Container kill event",
"health": "ok",
"severity": "info",
"value": "0",
"updatedAt": "2022-01-22T22:10:38Z"
},
{
"name": "container:event:restart",
"description": "Container restart event",
"health": "ok",
"severity": "info",
"value": "0",
"updatedAt": "2022-01-22T22:13:38Z"
},
{
"name": "container:event:restart-last-hour",
"description": "Container restart count in the last hour",
"health": "ok",
"severity": "info",
"value": "0",
"updatedAt": "2021-09-24T20:42:29Z"
},
{
"name": "container:event:start",
"description": "Container start event",
"health": "ok",
"severity": "info",
"value": "0",
"updatedAt": "2021-09-24T20:42:29Z"
},
{
"name": "container:event:stop",
"description": "Container stop event",
"health": "ok",
"severity": "info",
"value": "0",
"updatedAt": "2021-09-24T20:42:29Z"
},
{
"name": "container:running",
"description": "Container running",
"health": "ok",
"severity": "info",
"value": "true",
"updatedAt": "2022-01-24T05:31:38Z"
},
{
"name": "service:component:version",
"description": "Service component version",
"health": "ok",
"severity": "info",
"value": "",
"updatedAt": "2022-01-22T22:13:38Z"
},
{
"name": "service:file-watcher-error",
"description": "Service file watcher error",
"health": "ok",
"severity": "info",
"value": "false",
"updatedAt": "2021-09-24T20:42:29Z"
},
{
"name": "service:message-error",
"description": "Service health monitor error",
"health": "ok",
"severity": "info",
"value": "",
"updatedAt": "2022-01-22T22:13:38Z"
},
{
"name": "service:message-error-count",
"description": "Service health monitor error count",
"health": "ok",
"severity": "info",
"value": "0",
"updatedAt": "2021-09-24T20:42:29Z"
},
{
"name": "service:overall-health",
"description": "Service reported overall health",
"health": "ok",
"severity": "info",
"value": "Ok",
"updatedAt": "2022-01-22T22:13:38Z"
},
{
"name": "service:ready",
"description": "Service ready status",
"health": "ok",
"severity": "info",
"value": "true",
"updatedAt": "2022-01-22T22:13:38Z"
},
{
"name": "service:restart-count",
"description": "Service total restart count",
"health": "ok",
"severity": "info",
"value": "0",
"updatedAt": "2022-01-22T22:13:38Z"
},
{
"name": "service:restart-last-hour",
"description": "Service restart count in the last hour",
"health": "ok",
"severity": "info",
"value": "0",
"updatedAt": "2021-09-24T20:42:29Z"
},
{
"name": "service:startup-timestamp",
"description": "Service startup timestamp",
"health": "ok",
"severity": "info",
"value": "2022-01-22T22:13:15.19396659Z",
"updatedAt": "2022-01-22T22:13:38Z"
},
{
"name": "service:version",
"description": "Service version",
"health": "ok",
"severity": "info",
"value": "1.45.10-f5os-a-1-0-0-candidate.2021-12-01-13-21-23.Sf53d3ed8",
"updatedAt": "2022-01-22T22:13:38Z"
}
]
}
},
{
"key": "appliance/services/diag-agent/alert-manager",
"state": {
"name": "alert-manager",
"health": "ok",
"severity": "info"
},
"attributes": {
"attribute": [
{
"name": "alert-manager:alarm-maintainer",
"description": "Diag-agent is able to initialize the alarm maintainer",
"health": "ok",
"severity": "info",
"value": "true",
"updatedAt": "2022-01-22T22:13:38Z"
},
{
"name": "alert-manager:lop",
"description": "Diag-agent is able to initialize the LOP alert manager",
"health": "ok",
"severity": "info",
"value": "true",
"updatedAt": "2022-01-22T22:13:38Z"
},
{
"name": "alert-manager:lop:alert-handler:analog",
"description": "Diag-agent is able to initialize the analog LOP alert handler",
"health": "ok",
"severity": "info",
"value": "true",
"updatedAt": "2022-01-22T22:13:38Z"
},
{
"name": "alert-manager:lop:alert-handler:binary",
"description": "Diag-agent is able to initialize the binary LOP alert handler",
"health": "ok",
"severity": "info",
"value": "true",
"updatedAt": "2022-01-22T22:13:38Z"
},
{
"name": "alert-manager:platform:alarm-handler",
"description": "Diag-agent is able to initialize the platform alarm handler",
"health": "ok",
"severity": "info",
"value": "true",
"updatedAt": "2022-01-22T22:13:38Z"
},
{
"name": "alert-manager:platform:alarm-manager",
"description": "Diag-agent is able to initialize the platform alarm manager",
"health": "ok",
"severity": "info",
"value": "true",
"updatedAt": "2022-01-22T22:13:38Z"
}
]
}
},
{
"key": "appliance/services/diag-agent/confd-bridge",
"state": {
"name": "confd-bridge",
"health": "ok",
"severity": "info"
},
"attributes": {
"attribute": [
{
"name": "confd-bridge:connection",
"description": "Diag-agent is able to communicate with Confd",
"health": "ok",
"severity": "info",
"value": "true",
"updatedAt": "2022-01-22T22:13:38Z"
}
]
}
},
{
"key": "appliance/services/diag-agent/publisher",
"state": {
"name": "publisher",
"health": "ok",
"severity": "info"
},
"attributes": {
"attribute": [
{
"name": "publisher:push-endpoint",
"description": "Diag-agent is able to push & publish events over zmq interface",
"health": "ok",
"severity": "info",
"value": "true",
"updatedAt": "2022-01-22T22:13:38Z"
}
]
}
},
{
"key": "appliance/services/diag-agent/service",
"state": {
"name": "service",
"health": "ok",
"severity": "info"
},
"attributes": {
"attribute": [
{
"name": "service:hal:connection",
"description": "Diag-agent is able to communicate with platform-hal",
"health": "ok",
"severity": "info",
"value": "true",
"updatedAt": "2022-01-22T22:13:38Z"
},
{
"name": "service:monitor:connection",
"description": "Diag-agent is able to communicate with monitor agent",
"health": "ok",
"severity": "info",
"value": "true",
"updatedAt": "2022-01-22T22:13:38Z"
},
{
"name": "service:monitor:connection:firmware",
"description": "Diag-agent is able initialize monitoring of firmware events",
"health": "ok",
"severity": "info",
"value": "true",
"updatedAt": "2022-01-22T22:13:38Z"
}
]
}
},
{
"key": "appliance/services/dma-agent",
"state": {
"name": "dma-agent",
"health": "ok",
"severity": "notice"
},
"attributes": {
"attribute": [
{
"name": "container:event:attach",
"description": "Container attach event",
"health": "ok",
"severity": "info",
"value": "0",
"updatedAt": "2021-09-24T20:42:29Z"
},
{
"name": "container:event:die",
"description": "Container die event",
"health": "ok",
"severity": "info",
"value": "0",
"updatedAt": "2021-09-24T20:42:29Z"
},
{
"name": "container:event:exec-create",
"description": "Container exec create event",
"health": "ok",
"severity": "info",
"value": "0",
"updatedAt": "2022-01-18T01:29:18Z"
},
{
"name": "container:event:exec-detach",
"description": "Container exec detach event",
"health": "ok",
"severity": "info",
"value": "0",
"updatedAt": "2021-09-24T20:42:29Z"
},
{
"name": "container:event:exec-die",
"description": "Container exec die event",
"health": "ok",
"severity": "info",
"value": "0",
"updatedAt": "2021-09-24T20:42:29Z"
},
{
"name": "container:event:exec-start",
"description": "Container exec start event",
"health": "ok",
"severity": "info",
"value": "0",
"updatedAt": "2022-01-18T01:29:18Z"
},
{
"name": "container:event:kill",
"description": "Container kill event",
"health": "ok",
"severity": "info",
"value": "0",
"updatedAt": "2021-09-24T20:42:29Z"
},
{
"name": "container:event:restart",
"description": "Container restart event",
"health": "ok",
"severity": "info",
"value": "0",
"updatedAt": "2022-01-22T22:13:38Z"
},
{
"name": "container:event:restart-last-hour",
"description": "Container restart count in the last hour",
"health": "ok",
"severity": "info",
"value": "0",
"updatedAt": "2021-09-24T20:42:29Z"
},
{
"name": "container:event:start",
"description": "Container start event",
"health": "ok",
"severity": "info",
"value": "0",
"updatedAt": "2021-09-24T20:42:29Z"
},
{
"name": "container:event:stop",
"description": "Container stop event",
"health": "ok",
"severity": "info",
"value": "0",
"updatedAt": "2021-09-24T20:42:29Z"
},
{
"name": "container:running",
"description": "Container running",
"health": "ok",
"severity": "info",
"value": "true",
"updatedAt": "2022-01-24T05:31:38Z"
},
{
"name": "service:component:version",
"description": "Service component version",
"health": "ok",
"severity": "info",
"value": "",
"updatedAt": "2021-09-24T20:42:29Z"
},
{
"name": "service:file-watcher-error",
"description": "Service file watcher error",
"health": "ok",
"severity": "info",
"value": "false",
"updatedAt": "2021-09-24T20:42:29Z"
},
{
"name": "service:message-error",
"description": "Service health monitor error",
"health": "ok",
"severity": "info",
"value": "",
"updatedAt": "2022-01-22T22:14:06Z"
},
{
"name": "service:message-error-count",
"description": "Service health monitor error count",
"health": "ok",
"severity": "info",
"value": "0",
"updatedAt": "2021-09-24T20:43:13Z"
},
{
"name": "service:overall-health",
"description": "Service reported overall health",
"health": "ok",
"severity": "info",
"value": "Ok",
"updatedAt": "2022-01-22T22:14:06Z"
},
{
"name": "service:ready",
"description": "Service ready status",
"health": "ok",
"severity": "info",
"value": "true",
"updatedAt": "2022-01-22T22:14:06Z"
},
{
"name": "service:restart-count",
"description": "Service total restart count",
"health": "ok",
"severity": "notice",
"value": "1",
"updatedAt": "2022-01-22T22:14:06Z"
},
{
"name": "service:restart-last-hour",
"description": "Service restart count in the last hour",
"health": "ok",
"severity": "notice",
"value": "1",
"updatedAt": "2022-01-22T22:14:06Z"
},
{
"name": "service:startup-timestamp",
"description": "Service startup timestamp",
"health": "ok",
"severity": "info",
"value": "2022-01-22T22:14:06.221466574Z",
"updatedAt": "2022-01-22T22:14:06Z"
},
{
"name": "service:version",
"description": "Service version",
"health": "ok",
"severity": "info",
"value": "7.5.8",
"updatedAt": "2022-01-22T22:14:06Z"
}
]
}
},
{
"key": "appliance/services/fips-service",
"state": {
"name": "fips-service",
"health": "ok",
"severity": "info"
},
"attributes": {
"attribute": [
{
"name": "container:event:attach",
"description": "Container attach event",
"health": "ok",
"severity": "info",
"value": "0",
"updatedAt": "2021-09-24T20:42:30Z"
},
{
"name": "container:event:die",
"description": "Container die event",
"health": "ok",
"severity": "info",
"value": "0",
"updatedAt": "2021-09-24T20:42:30Z"
},
{
"name": "container:event:exec-create",
"description": "Container exec create event",
"health": "ok",
"severity": "info",
"value": "0",
"updatedAt": "2022-01-18T01:30:16Z"
},
{
"name": "container:event:exec-detach",
"description": "Container exec detach event",
"health": "ok",
"severity": "info",
"value": "0",
"updatedAt": "2021-09-24T20:42:30Z"
},
{
"name": "container:event:exec-die",
"description": "Container exec die event",
"health": "ok",
"severity": "info",
"value": "0",
"updatedAt": "2021-09-24T20:42:30Z"
},
{
"name": "container:event:exec-start",
"description": "Container exec start event",
"health": "ok",
"severity": "info",
"value": "0",
"updatedAt": "2022-01-18T01:30:16Z"
},
{
"name": "container:event:kill",
"description": "Container kill event",
"health": "ok",
"severity": "info",
"value": "0",
"updatedAt": "2022-01-22T22:10:38Z"
},
{
"name": "container:event:restart",
"description": "Container restart event",
"health": "ok",
"severity": "info",
"value": "0",
"updatedAt": "2022-01-22T22:13:38Z"
},
{
"name": "container:event:restart-last-hour",
"description": "Container restart count in the last hour",
"health": "ok",
"severity": "info",
"value": "0",
"updatedAt": "2021-09-24T20:42:30Z"
},
{
"name": "container:event:start",
"description": "Container start event",
"health": "ok",
"severity": "info",
"value": "0",
"updatedAt": "2021-09-24T20:42:30Z"
},
{
"name": "container:event:stop",
"description": "Container stop event",
"health": "ok",
"severity": "info",
"value": "0",
"updatedAt": "2021-09-24T20:42:30Z"
},
{
"name": "container:running",
"description": "Container running",
"health": "ok",
"severity": "info",
"value": "true",
"updatedAt": "2022-01-24T05:31:38Z"
}
]
}
},
{
"key": "appliance/services/firmware",
"state": {
"name": "firmware",
"health": "ok",
"severity": "info"
},
"attributes": {
"attribute": [
{
"name": "container:event:attach",
"description": "Container attach event",
"health": "ok",
"severity": "info",
"value": "0",
"updatedAt": "2021-09-24T20:42:31Z"
},
{
"name": "container:event:die",
"description": "Container die event",
"health": "ok",
"severity": "info",
"value": "0",
"updatedAt": "2021-09-24T20:42:31Z"
},
{
"name": "container:event:exec-create",
"description": "Container exec create event",
"health": "ok",
"severity": "info",
"value": "0",
"updatedAt": "2022-01-18T01:30:20Z"
},
{
"name": "container:event:exec-detach",
"description": "Container exec detach event",
"health": "ok",
"severity": "info",
"value": "0",
"updatedAt": "2021-09-24T20:42:31Z"
},
{
"name": "container:event:exec-die",
"description": "Container exec die event",
"health": "ok",
"severity": "info",
"value": "0",
"updatedAt": "2021-09-24T20:42:31Z"
},
{
"name": "container:event:exec-start",
"description": "Container exec start event",
"health": "ok",
"severity": "info",
"value": "0",
"updatedAt": "2022-01-18T01:30:20Z"
},
{
"name": "container:event:kill",
"description": "Container kill event",
"health": "ok",
"severity": "info",
"value": "0",
"updatedAt": "2021-09-24T20:42:31Z"
},
{
"name": "container:event:restart",
"description": "Container restart event",
"health": "ok",
"severity": "info",
"value": "0",
"updatedAt": "2022-01-22T22:13:38Z"
},
{
"name": "container:event:restart-last-hour",
"description": "Container restart count in the last hour",
"health": "ok",
"severity": "info",
"value": "0",
"updatedAt": "2021-09-24T20:42:31Z"
},
{
"name": "container:event:start",
"description": "Container start event",
"health": "ok",
"severity": "info",
"value": "0",
"updatedAt": "2021-09-24T20:42:31Z"
},
{
"name": "container:event:stop",
"description": "Container stop event",
"health": "ok",
"severity": "info",
"value": "0",
"updatedAt": "2021-09-24T20:42:31Z"
},
{
"name": "container:running",
"description": "Container running",
"health": "ok",
"severity": "info",
"value": "true",
"updatedAt": "2022-01-24T05:31:38Z"
}
]
}
},
{
"key": "appliance/services/firmware-fpga",
"state": {
"name": "firmware-fpga",
"health": "ok",
"severity": "info"
},
"attributes": {
"attribute": [
{
"name": "container:event:attach",
"description": "Container attach event",
"health": "ok",
"severity": "info",
"value": "0",
"updatedAt": "2021-09-24T20:42:30Z"
},
{
"name": "container:event:die",
"description": "Container die event",
"health": "ok",
"severity": "info",
"value": "0",
"updatedAt": "2021-09-24T20:42:30Z"
},
{
"name": "container:event:exec-create",
"description": "Container exec create event",
"health": "ok",
"severity": "info",
"value": "0",
"updatedAt": "2022-01-18T01:30:26Z"
},
{
"name": "container:event:exec-detach",
"description": "Container exec detach event",
"health": "ok",
"severity": "info",
"value": "0",
"updatedAt": "2021-09-24T20:42:30Z"
},
{
"name": "container:event:exec-die",
"description": "Container exec die event",
"health": "ok",
"severity": "info",
"value": "0",
"updatedAt": "2021-09-24T20:42:30Z"
},
{
"name": "container:event:exec-start",
"description": "Container exec start event",
"health": "ok",
"severity": "info",
"value": "0",
"updatedAt": "2022-01-18T01:30:26Z"
},
{
"name": "container:event:kill",
"description": "Container kill event",
"health": "ok",
"severity": "info",
"value": "0",
"updatedAt": "2021-09-24T20:42:30Z"
},
{
"name": "container:event:restart",
"description": "Container restart event",
"health": "ok",
"severity": "info",
"value": "0",
"updatedAt": "2022-01-22T22:13:38Z"
},
{
"name": "container:event:restart-last-hour",
"description": "Container restart count in the last hour",
"health": "ok",
"severity": "info",
"value": "0",
"updatedAt": "2021-09-24T20:42:30Z"
},
{
"name": "container:event:start",
"description": "Container start event",
"health": "ok",
"severity": "info",
"value": "0",
"updatedAt": "2021-09-24T20:42:30Z"
},
{
"name": "container:event:stop",
"description": "Container stop event",
"health": "ok",
"severity": "info",
"value": "0",
"updatedAt": "2021-09-24T20:42:30Z"
},
{
"name": "container:running",
"description": "Container running",
"health": "ok",
"severity": "info",
"value": "true",
"updatedAt": "2022-01-24T05:31:38Z"
}
]
}
},
{
"key": "appliance/services/http-server",
"state": {
"name": "http-server",
"health": "ok",
"severity": "info"
},
"attributes": {
"attribute": [
{
"name": "container:event:attach",
"description": "Container attach event",
"health": "ok",
"severity": "info",
"value": "0",
"updatedAt": "2021-09-24T20:42:29Z"
},
{
"name": "container:event:die",
"description": "Container die event",
"health": "ok",
"severity": "info",
"value": "0",
"updatedAt": "2021-09-24T20:42:29Z"
},
{
"name": "container:event:exec-create",
"description": "Container exec create event",
"health": "ok",
"severity": "info",
"value": "0",
"updatedAt": "2022-01-18T01:30:02Z"
},
{
"name": "container:event:exec-detach",
"description": "Container exec detach event",
"health": "ok",
"severity": "info",
"value": "0",
"updatedAt": "2021-09-24T20:42:29Z"
},
{
"name": "container:event:exec-die",
"description": "Container exec die event",
"health": "ok",
"severity": "info",
"value": "0",
"updatedAt": "2021-09-24T20:42:29Z"
},
{
"name": "container:event:exec-start",
"description": "Container exec start event",
"health": "ok",
"severity": "info",
"value": "0",
"updatedAt": "2022-01-18T01:30:02Z"
},
{
"name": "container:event:kill",
"description": "Container kill event",
"health": "ok",
"severity": "info",
"value": "0",
"updatedAt": "2021-09-24T20:42:29Z"
},
{
"name": "container:event:restart",
"description": "Container restart event",
"health": "ok",
"severity": "info",
"value": "0",
"updatedAt": "2022-01-22T22:13:38Z"
},
{
"name": "container:event:restart-last-hour",
"description": "Container restart count in the last hour",
"health": "ok",
"severity": "info",
"value": "0",
"updatedAt": "2021-09-24T20:42:29Z"
},
{
"name": "container:event:start",
"description": "Container start event",
"health": "ok",
"severity": "info",
"value": "0",
"updatedAt": "2021-09-24T20:42:29Z"
},
{
"name": "container:event:stop",
"description": "Container stop event",
"health": "ok",
"severity": "info",
"value": "0",
"updatedAt": "2021-09-24T20:42:29Z"
},
{
"name": "container:running",
"description": "Container running",
"health": "ok",
"severity": "info",
"value": "true",
"updatedAt": "2022-01-24T05:31:38Z"
},
{
"name": "service:component:version",
"description": "Service component version",
"health": "ok",
"severity": "info",
"value": "",
"updatedAt": "2022-01-22T22:13:38Z"
},
{
"name": "service:message-error",
"description": "Service health monitor error",
"health": "ok",
"severity": "info",
"value": "",
"updatedAt": "2022-01-22T22:13:38Z"
},
{
"name": "service:message-error-count",
"description": "Service health monitor error count",
"health": "ok",
"severity": "info",
"value": "0",
"updatedAt": "2021-09-24T20:42:29Z"
},
{
"name": "service:overall-health",
"description": "Service reported overall health",
"health": "ok",
"severity": "info",
"value": "",
"updatedAt": "2021-09-24T20:42:29Z"
},
{
"name": "service:ready",
"description": "Service ready status",
"health": "ok",
"severity": "info",
"value": "true",
"updatedAt": "2022-01-22T22:13:38Z"
},
{
"name": "service:restart-count",
"description": "Service total restart count",
"health": "ok",
"severity": "info",
"value": "0",
"updatedAt": "2022-01-22T22:13:38Z"
},
{
"name": "service:restart-last-hour",
"description": "Service restart count in the last hour",
"health": "ok",
"severity": "info",
"value": "0",
"updatedAt": "2021-09-24T20:42:29Z"
},
{
"name": "service:startup-timestamp",
"description": "Service startup timestamp",
"health": "ok",
"severity": "info",
"value": "2022-01-22T22:13:38.716460039Z",
"updatedAt": "2022-01-22T22:13:38Z"
},
{
"name": "service:version",
"description": "Service version",
"health": "ok",
"severity": "info",
"value": "",
"updatedAt": "2022-01-22T22:13:38Z"
}
]
}
},
{
"key": "appliance/services/http-server/connections",
"state": {
"name": "Active Connections",
"health": "ok",
"severity": "info"
},
"attributes": {
"attribute": [
{
"name": "http:connections:active",
"description": "Number of active connections",
"health": "ok",
"severity": "info",
"value": "1",
"updatedAt": "2022-01-24T05:32:10Z"
},
{
"name": "http:connections:idle",
"description": "Number of idle connections",
"health": "ok",
"severity": "info",
"value": "0",
"updatedAt": "2022-01-24T05:32:10Z"
}
]
}
},
{
"key": "appliance/services/http-server/mpm",
"state": {
"name": "MPM Block",
"health": "ok",
"severity": "info"
},
"attributes": {
"attribute": [
{
"name": "http:mpm:active-servers",
"description": "Number of active servers",
"health": "ok",
"severity": "info",
"value": "10",
"updatedAt": "2022-01-24T05:32:10Z"
}
]
}
},
{
"key": "appliance/services/http-server/server",
"state": {
"name": "HTTP Server Status",
"health": "ok",
"severity": "info"
},
"attributes": {
"attribute": [
{
"name": "http:server:bytes",
"description": "Total number of bytes",
"health": "ok",
"severity": "info",
"value": "183623028",
"updatedAt": "2022-01-24T05:32:08Z"
},
{
"name": "http:server:connections",
"description": "Total number of connections",
"health": "ok",
"severity": "info",
"value": "4166",
"updatedAt": "2022-01-24T05:32:08Z"
},
{
"name": "http:server:uptime",
"description": "Server uptime in seconds (S)",
"health": "ok",
"severity": "info",
"value": "112733",
"updatedAt": "2022-01-24T05:32:08Z"
}
]
}
},
{
"key": "appliance/services/ihealth-service",
"state": {
"name": "ihealth-service",
"health": "ok",
"severity": "info"
},
"attributes": {
"attribute": [
{
"name": "container:event:attach",
"description": "Container attach event",
"health": "ok",
"severity": "info",
"value": "0",
"updatedAt": "2021-09-24T20:42:30Z"
},
{
"name": "container:event:die",
"description": "Container die event",
"health": "ok",
"severity": "info",
"value": "0",
"updatedAt": "2022-01-15T06:44:35Z"
},
{
"name": "container:event:exec-create",
"description": "Container exec create event",
"health": "ok",
"severity": "info",
"value": "0",
"updatedAt": "2022-01-18T01:28:24Z"
},
{
"name": "container:event:exec-detach",
"description": "Container exec detach event",
"health": "ok",
"severity": "info",
"value": "0",
"updatedAt": "2021-09-24T20:42:30Z"
},
{
"name": "container:event:exec-die",
"description": "Container exec die event",
"health": "ok",
"severity": "info",
"value": "0",
"updatedAt": "2021-09-24T20:42:30Z"
},
{
"name": "container:event:exec-start",
"description": "Container exec start event",
"health": "ok",
"severity": "info",
"value": "0",
"updatedAt": "2022-01-18T01:28:24Z"
},
{
"name": "container:event:kill",
"description": "Container kill event",
"health": "ok",
"severity": "info",
"value": "0",
"updatedAt": "2022-01-22T22:10:38Z"
},
{
"name": "container:event:restart",
"description": "Container restart event",
"health": "ok",
"severity": "info",
"value": "0",
"updatedAt": "2022-01-22T22:13:38Z"
},
{
"name": "container:event:restart-last-hour",
"description": "Container restart count in the last hour",
"health": "ok",
"severity": "info",
"value": "0",
"updatedAt": "2021-09-24T20:42:30Z"
},
{
"name": "container:event:start",
"description": "Container start event",
"health": "ok",
"severity": "info",
"value": "0",
"updatedAt": "2021-09-24T20:42:30Z"
},
{
"name": "container:event:stop",
"description": "Container stop event",
"health": "ok",
"severity": "info",
"value": "0",
"updatedAt": "2021-10-21T16:16:48Z"
},
{
"name": "container:running",
"description": "Container running",
"health": "ok",
"severity": "info",
"value": "true",
"updatedAt": "2022-01-24T05:31:38Z"
}
]
}
},
{
"key": "appliance/services/lcd-webserver",
"state": {
"name": "lcd-webserver",
"health": "ok",
"severity": "info"
},
"attributes": {
"attribute": [
{
"name": "container:event:attach",
"description": "Container attach event",
"health": "ok",
"severity": "info",
"value": "0",
"updatedAt": "2021-09-24T20:42:30Z"
},
{
"name": "container:event:die",
"description": "Container die event",
"health": "ok",
"severity": "info",
"value": "0",
"updatedAt": "2021-12-08T19:43:32Z"
},
{
"name": "container:event:exec-create",
"description": "Container exec create event",
"health": "ok",
"severity": "info",
"value": "0",
"updatedAt": "2022-01-18T01:29:46Z"
},
{
"name": "container:event:exec-detach",
"description": "Container exec detach event",
"health": "ok",
"severity": "info",
"value": "0",
"updatedAt": "2021-09-24T20:42:30Z"
},
{
"name": "container:event:exec-die",
"description": "Container exec die event",
"health": "ok",
"severity": "info",
"value": "0",
"updatedAt": "2021-09-24T20:42:30Z"
},
{
"name": "container:event:exec-start",
"description": "Container exec start event",
"health": "ok",
"severity": "info",
"value": "0",
"updatedAt": "2022-01-18T01:29:46Z"
},
{
"name": "container:event:kill",
"description": "Container kill event",
"health": "ok",
"severity": "info",
"value": "0",
"updatedAt": "2022-01-22T22:10:38Z"
},
{
"name": "container:event:restart",
"description": "Container restart event",
"health": "ok",
"severity": "info",
"value": "0",
"updatedAt": "2022-01-22T22:13:38Z"
},
{
"name": "container:event:restart-last-hour",
"description": "Container restart count in the last hour",
"health": "ok",
"severity": "info",
"value": "0",
"updatedAt": "2021-09-24T20:42:30Z"
},
{
"name": "container:event:start",
"description": "Container start event",
"health": "ok",
"severity": "info",
"value": "0",
"updatedAt": "2021-09-24T20:42:30Z"
},
{
"name": "container:event:stop",
"description": "Container stop event",
"health": "ok",
"severity": "info",
"value": "0",
"updatedAt": "2021-11-30T03:09:43Z"
},
{
"name": "container:running",
"description": "Container running",
"health": "ok",
"severity": "info",
"value": "true",
"updatedAt": "2022-01-24T05:31:38Z"
}
]
}
},
{
"key": "appliance/services/line-dma-agent",
"state": {
"name": "line-dma-agent",
"health": "ok",
"severity": "info"
},
"attributes": {
"attribute": [
{
"name": "container:event:attach",
"description": "Container attach event",
"health": "ok",
"severity": "info",
"value": "0",
"updatedAt": "2021-09-24T20:42:29Z"
},
{
"name": "container:event:die",
"description": "Container die event",
"health": "ok",
"severity": "info",
"value": "0",
"updatedAt": "2021-09-24T20:42:29Z"
},
{
"name": "container:event:exec-create",
"description": "Container exec create event",
"health": "ok",
"severity": "info",
"value": "0",
"updatedAt": "2022-01-18T01:29:22Z"
},
{
"name": "container:event:exec-detach",
"description": "Container exec detach event",
"health": "ok",
"severity": "info",
"value": "0",
"updatedAt": "2021-09-24T20:42:29Z"
},
{
"name": "container:event:exec-die",
"description": "Container exec die event",
"health": "ok",
"severity": "info",
"value": "0",
"updatedAt": "2021-09-24T20:42:29Z"
},
{
"name": "container:event:exec-start",
"description": "Container exec start event",
"health": "ok",
"severity": "info",
"value": "0",
"updatedAt": "2022-01-18T01:29:22Z"
},
{
"name": "container:event:kill",
"description": "Container kill event",
"health": "ok",
"severity": "info",
"value": "0",
"updatedAt": "2021-09-24T20:42:29Z"
},
{
"name": "container:event:restart",
"description": "Container restart event",
"health": "ok",
"severity": "info",
"value": "0",
"updatedAt": "2022-01-22T22:13:38Z"
},
{
"name": "container:event:restart-last-hour",
"description": "Container restart count in the last hour",
"health": "ok",
"severity": "info",
"value": "0",
"updatedAt": "2021-09-24T20:42:29Z"
},
{
"name": "container:event:start",
"description": "Container start event",
"health": "ok",
"severity": "info",
"value": "0",
"updatedAt": "2021-09-24T20:42:29Z"
},
{
"name": "container:event:stop",
"description": "Container stop event",
"health": "ok",
"severity": "info",
"value": "0",
"updatedAt": "2021-09-24T20:42:29Z"
},
{
"name": "container:running",
"description": "Container running",
"health": "ok",
"severity": "info",
"value": "true",
"updatedAt": "2022-01-24T05:31:38Z"
},
{
"name": "service:component:version",
"description": "Service component version",
"health": "ok",
"severity": "info",
"value": "",
"updatedAt": "2021-09-24T20:42:29Z"
},
{
"name": "service:file-watcher-error",
"description": "Service file watcher error",
"health": "ok",
"severity": "info",
"value": "false",
"updatedAt": "2021-09-24T20:42:29Z"
},
{
"name": "service:message-error",
"description": "Service health monitor error",
"health": "ok",
"severity": "info",
"value": "",
"updatedAt": "2022-01-22T22:14:08Z"
},
{
"name": "service:message-error-count",
"description": "Service health monitor error count",
"health": "ok",
"severity": "info",
"value": "0",
"updatedAt": "2021-09-24T20:43:12Z"
},
{
"name": "service:overall-health",
"description": "Service reported overall health",
"health": "ok",
"severity": "info",
"value": "Ok",
"updatedAt": "2022-01-22T22:14:08Z"
},
{
"name": "service:ready",
"description": "Service ready status",
"health": "ok",
"severity": "info",
"value": "true",
"updatedAt": "2022-01-22T22:14:08Z"
},
{
"name": "service:restart-count",
"description": "Service total restart count",
"health": "ok",
"severity": "info",
"value": "0",
"updatedAt": "2022-01-22T22:13:38Z"
},
{
"name": "service:restart-last-hour",
"description": "Service restart count in the last hour",
"health": "ok",
"severity": "info",
"value": "0",
"updatedAt": "2022-01-14T19:10:53Z"
},
{
"name": "service:startup-timestamp",
"description": "Service startup timestamp",
"health": "ok",
"severity": "info",
"value": "2022-01-22T22:14:06.954557346Z",
"updatedAt": "2022-01-22T22:14:08Z"
},
{
"name": "service:version",
"description": "Service version",
"health": "ok",
"severity": "info",
"value": "1.3.27",
"updatedAt": "2022-01-22T22:14:08Z"
}
]
}
},
{
"key": "appliance/services/lopd",
"state": {
"name": "lopd",
"health": "ok",
"severity": "info"
},
"attributes": {
"attribute": [
{
"name": "container:event:attach",
"description": "Container attach event",
"health": "ok",
"severity": "info",
"value": "0",
"updatedAt": "2021-09-24T20:42:29Z"
},
{
"name": "container:event:die",
"description": "Container die event",
"health": "ok",
"severity": "info",
"value": "0",
"updatedAt": "2021-09-24T20:42:29Z"
},
{
"name": "container:event:exec-create",
"description": "Container exec create event",
"health": "ok",
"severity": "info",
"value": "0",
"updatedAt": "2022-01-18T01:30:12Z"
},
{
"name": "container:event:exec-detach",
"description": "Container exec detach event",
"health": "ok",
"severity": "info",
"value": "0",
"updatedAt": "2021-09-24T20:42:29Z"
},
{
"name": "container:event:exec-die",
"description": "Container exec die event",
"health": "ok",
"severity": "info",
"value": "0",
"updatedAt": "2021-09-24T20:42:29Z"
},
{
"name": "container:event:exec-start",
"description": "Container exec start event",
"health": "ok",
"severity": "info",
"value": "0",
"updatedAt": "2022-01-18T01:30:12Z"
},
{
"name": "container:event:kill",
"description": "Container kill event",
"health": "ok",
"severity": "info",
"value": "0",
"updatedAt": "2021-09-24T20:42:29Z"
},
{
"name": "container:event:restart",
"description": "Container restart event",
"health": "ok",
"severity": "info",
"value": "0",
"updatedAt": "2022-01-22T22:13:38Z"
},
{
"name": "container:event:restart-last-hour",
"description": "Container restart count in the last hour",
"health": "ok",
"severity": "info",
"value": "0",
"updatedAt": "2021-09-24T20:42:29Z"
},
{
"name": "container:event:start",
"description": "Container start event",
"health": "ok",
"severity": "info",
"value": "0",
"updatedAt": "2021-09-24T20:42:29Z"
},
{
"name": "container:event:stop",
"description": "Container stop event",
"health": "ok",
"severity": "info",
"value": "0",
"updatedAt": "2021-09-24T20:42:29Z"
},
{
"name": "container:running",
"description": "Container running",
"health": "ok",
"severity": "info",
"value": "true",
"updatedAt": "2022-01-24T05:31:38Z"
},
{
"name": "service:component:version",
"description": "Service component version",
"health": "ok",
"severity": "info",
"value": "",
"updatedAt": "2021-09-24T20:42:29Z"
},
{
"name": "service:file-watcher-error",
"description": "Service file watcher error",
"health": "ok",
"severity": "info",
"value": "false",
"updatedAt": "2021-09-24T20:42:29Z"
},
{
"name": "service:message-error",
"description": "Service health monitor error",
"health": "ok",
"severity": "info",
"value": "",
"updatedAt": "2022-01-22T22:13:38Z"
},
{
"name": "service:message-error-count",
"description": "Service health monitor error count",
"health": "ok",
"severity": "info",
"value": "0",
"updatedAt": "2021-09-24T20:42:29Z"
},
{
"name": "service:overall-health",
"description": "Service reported overall health",
"health": "ok",
"severity": "info",
"value": "Ok",
"updatedAt": "2022-01-22T22:13:38Z"
},
{
"name": "service:ready",
"description": "Service ready status",
"health": "ok",
"severity": "info",
"value": "true",
"updatedAt": "2022-01-22T22:13:38Z"
},
{
"name": "service:restart-count",
"description": "Service total restart count",
"health": "ok",
"severity": "info",
"value": "0",
"updatedAt": "2022-01-22T22:13:38Z"
},
{
"name": "service:restart-last-hour",
"description": "Service restart count in the last hour",
"health": "ok",
"severity": "info",
"value": "0",
"updatedAt": "2021-11-30T03:05:26Z"
},
{
"name": "service:startup-timestamp",
"description": "Service startup timestamp",
"health": "ok",
"severity": "info",
"value": "2022-01-22T22:13:23.930446439Z",
"updatedAt": "2022-01-22T22:13:38Z"
},
{
"name": "service:version",
"description": "Service version",
"health": "ok",
"severity": "info",
"value": "2.2.1",
"updatedAt": "2022-01-22T22:13:38Z"
}
]
}
},
{
"key": "appliance/services/name-service-ldap",
"state": {
"name": "name-service-ldap",
"health": "ok",
"severity": "info"
},
"attributes": {
"attribute": [
{
"name": "container:event:attach",
"description": "Container attach event",
"health": "ok",
"severity": "info",
"value": "0",
"updatedAt": "2021-09-24T20:42:30Z"
},
{
"name": "container:event:die",
"description": "Container die event",
"health": "ok",
"severity": "info",
"value": "0",
"updatedAt": "2022-01-22T22:10:39Z"
},
{
"name": "container:event:exec-create",
"description": "Container exec create event",
"health": "ok",
"severity": "info",
"value": "0",
"updatedAt": "2022-01-18T01:29:24Z"
},
{
"name": "container:event:exec-detach",
"description": "Container exec detach event",
"health": "ok",
"severity": "info",
"value": "0",
"updatedAt": "2021-09-24T20:42:30Z"
},
{
"name": "container:event:exec-die",
"description": "Container exec die event",
"health": "ok",
"severity": "info",
"value": "0",
"updatedAt": "2021-09-24T20:42:30Z"
},
{
"name": "container:event:exec-start",
"description": "Container exec start event",
"health": "ok",
"severity": "info",
"value": "0",
"updatedAt": "2022-01-18T01:29:24Z"
},
{
"name": "container:event:kill",
"description": "Container kill event",
"health": "ok",
"severity": "info",
"value": "0",
"updatedAt": "2022-01-22T22:10:38Z"
},
{
"name": "container:event:restart",
"description": "Container restart event",
"health": "ok",
"severity": "info",
"value": "0",
"updatedAt": "2022-01-22T22:13:38Z"
},
{
"name": "container:event:restart-last-hour",
"description": "Container restart count in the last hour",
"health": "ok",
"severity": "info",
"value": "0",
"updatedAt": "2021-09-24T20:42:30Z"
},
{
"name": "container:event:start",
"description": "Container start event",
"health": "ok",
"severity": "info",
"value": "0",
"updatedAt": "2021-09-24T20:42:30Z"
},
{
"name": "container:event:stop",
"description": "Container stop event",
"health": "ok",
"severity": "info",
"value": "0",
"updatedAt": "2022-01-15T06:01:01Z"
},
{
"name": "container:running",
"description": "Container running",
"health": "ok",
"severity": "info",
"value": "true",
"updatedAt": "2022-01-24T05:31:38Z"
}
]
}
},
{
"key": "appliance/services/optics-mgr",
"state": {
"name": "optics-mgr",
"health": "ok",
"severity": "info"
},
"attributes": {
"attribute": [
{
"name": "container:event:attach",
"description": "Container attach event",
"health": "ok",
"severity": "info",
"value": "0",
"updatedAt": "2021-09-24T20:42:30Z"
},
{
"name": "container:event:die",
"description": "Container die event",
"health": "ok",
"severity": "info",
"value": "0",
"updatedAt": "2022-01-22T22:10:39Z"
},
{
"name": "container:event:exec-create",
"description": "Container exec create event",
"health": "ok",
"severity": "info",
"value": "0",
"updatedAt": "2022-01-18T01:29:38Z"
},
{
"name": "container:event:exec-detach",
"description": "Container exec detach event",
"health": "ok",
"severity": "info",
"value": "0",
"updatedAt": "2021-09-24T20:42:30Z"
},
{
"name": "container:event:exec-die",
"description": "Container exec die event",
"health": "ok",
"severity": "info",
"value": "0",
"updatedAt": "2021-09-24T20:42:30Z"
},
{
"name": "container:event:exec-start",
"description": "Container exec start event",
"health": "ok",
"severity": "info",
"value": "0",
"updatedAt": "2022-01-18T01:29:38Z"
},
{
"name": "container:event:kill",
"description": "Container kill event",
"health": "ok",
"severity": "info",
"value": "0",
"updatedAt": "2022-01-22T22:10:38Z"
},
{
"name": "container:event:restart",
"description": "Container restart event",
"health": "ok",
"severity": "info",
"value": "0",
"updatedAt": "2022-01-22T22:13:38Z"
},
{
"name": "container:event:restart-last-hour",
"description": "Container restart count in the last hour",
"health": "ok",
"severity": "info",
"value": "0",
"updatedAt": "2021-09-24T20:42:30Z"
},
{
"name": "container:event:start",
"description": "Container start event",
"health": "ok",
"severity": "info",
"value": "0",
"updatedAt": "2021-09-24T20:42:30Z"
},
{
"name": "container:event:stop",
"description": "Container stop event",
"health": "ok",
"severity": "info",
"value": "0",
"updatedAt": "2022-01-22T22:10:39Z"
},
{
"name": "container:running",
"description": "Container running",
"health": "ok",
"severity": "info",
"value": "true",
"updatedAt": "2022-01-24T05:31:38Z"
}
]
}
},
{
"key": "appliance/services/platform-diag",
"state": {
"name": "platform-diag",
"health": "ok",
"severity": "info"
},
"attributes": {
"attribute": [
{
"name": "container:event:attach",
"description": "Container attach event",
"health": "ok",
"severity": "info",
"value": "0",
"updatedAt": "2021-09-24T20:42:29Z"
},
{
"name": "container:event:die",
"description": "Container die event",
"health": "ok",
"severity": "info",
"value": "0",
"updatedAt": "2021-09-24T20:42:29Z"
},
{
"name": "container:event:exec-create",
"description": "Container exec create event",
"health": "ok",
"severity": "info",
"value": "0",
"updatedAt": "2022-01-18T01:30:06Z"
},
{
"name": "container:event:exec-detach",
"description": "Container exec detach event",
"health": "ok",
"severity": "info",
"value": "0",
"updatedAt": "2021-09-24T20:42:29Z"
},
{
"name": "container:event:exec-die",
"description": "Container exec die event",
"health": "ok",
"severity": "info",
"value": "0",
"updatedAt": "2021-09-24T20:42:29Z"
},
{
"name": "container:event:exec-start",
"description": "Container exec start event",
"health": "ok",
"severity": "info",
"value": "0",
"updatedAt": "2022-01-18T01:30:06Z"
},
{
"name": "container:event:kill",
"description": "Container kill event",
"health": "ok",
"severity": "info",
"value": "0",
"updatedAt": "2021-09-24T20:42:29Z"
},
{
"name": "container:event:restart",
"description": "Container restart event",
"health": "ok",
"severity": "info",
"value": "0",
"updatedAt": "2022-01-22T22:13:38Z"
},
{
"name": "container:event:restart-last-hour",
"description": "Container restart count in the last hour",
"health": "ok",
"severity": "info",
"value": "0",
"updatedAt": "2021-09-24T20:42:29Z"
},
{
"name": "container:event:start",
"description": "Container start event",
"health": "ok",
"severity": "info",
"value": "0",
"updatedAt": "2021-09-24T20:42:29Z"
},
{
"name": "container:event:stop",
"description": "Container stop event",
"health": "ok",
"severity": "info",
"value": "0",
"updatedAt": "2021-09-24T20:42:29Z"
},
{
"name": "container:running",
"description": "Container running",
"health": "ok",
"severity": "info",
"value": "true",
"updatedAt": "2022-01-24T05:31:38Z"
},
{
"name": "service:component:version",
"description": "Service component version",
"health": "ok",
"severity": "info",
"value": "",
"updatedAt": "2022-01-22T22:13:38Z"
},
{
"name": "service:file-watcher-error",
"description": "Service file watcher error",
"health": "ok",
"severity": "info",
"value": "false",
"updatedAt": "2021-09-24T20:42:29Z"
},
{
"name": "service:message-error",
"description": "Service health monitor error",
"health": "ok",
"severity": "info",
"value": "",
"updatedAt": "2022-01-22T22:13:38Z"
},
{
"name": "service:message-error-count",
"description": "Service health monitor error count",
"health": "ok",
"severity": "info",
"value": "0",
"updatedAt": "2021-09-24T20:42:29Z"
},
{
"name": "service:overall-health",
"description": "Service reported overall health",
"health": "ok",
"severity": "info",
"value": "Ok",
"updatedAt": "2022-01-22T22:13:38Z"
},
{
"name": "service:ready",
"description": "Service ready status",
"health": "ok",
"severity": "info",
"value": "true",
"updatedAt": "2022-01-22T22:13:38Z"
},
{
"name": "service:restart-count",
"description": "Service total restart count",
"health": "ok",
"severity": "info",
"value": "0",
"updatedAt": "2022-01-22T22:13:38Z"
},
{
"name": "service:restart-last-hour",
"description": "Service restart count in the last hour",
"health": "ok",
"severity": "info",
"value": "0",
"updatedAt": "2021-09-24T20:42:29Z"
},
{
"name": "service:startup-timestamp",
"description": "Service startup timestamp",
"health": "ok",
"severity": "info",
"value": "2022-01-22T22:13:13.660793178Z",
"updatedAt": "2022-01-22T22:13:38Z"
},
{
"name": "service:version",
"description": "Service version",
"health": "ok",
"severity": "info",
"value": "1.2.197",
"updatedAt": "2022-01-22T22:13:38Z"
}
]
}
},
{
"key": "appliance/services/platform-diag/service",
"state": {
"name": "service",
"health": "ok",
"severity": "info"
},
"attributes": {
"attribute": [
{
"name": "f5sw:service",
"description": "F5 Software SDK",
"health": "ok",
"severity": "info",
"value": "true",
"updatedAt": "2022-01-22T22:13:38Z"
},
{
"name": "fpgamgr:service",
"description": "FPGA Manager",
"health": "ok",
"severity": "info",
"value": "true",
"updatedAt": "2022-01-22T22:13:38Z"
}
]
}
},
{
"key": "appliance/services/platform-fwu",
"state": {
"name": "platform-fwu",
"health": "ok",
"severity": "info"
},
"attributes": {
"attribute": [
{
"name": "container:event:attach",
"description": "Container attach event",
"health": "ok",
"severity": "info",
"value": "0",
"updatedAt": "2021-09-24T20:42:29Z"
},
{
"name": "container:event:die",
"description": "Container die event",
"health": "ok",
"severity": "info",
"value": "0",
"updatedAt": "2021-09-24T20:42:29Z"
},
{
"name": "container:event:exec-create",
"description": "Container exec create event",
"health": "ok",
"severity": "info",
"value": "0",
"updatedAt": "2022-01-18T01:29:07Z"
},
{
"name": "container:event:exec-detach",
"description": "Container exec detach event",
"health": "ok",
"severity": "info",
"value": "0",
"updatedAt": "2021-09-24T20:42:29Z"
},
{
"name": "container:event:exec-die",
"description": "Container exec die event",
"health": "ok",
"severity": "info",
"value": "0",
"updatedAt": "2021-09-24T20:42:29Z"
},
{
"name": "container:event:exec-start",
"description": "Container exec start event",
"health": "ok",
"severity": "info",
"value": "0",
"updatedAt": "2022-01-18T01:29:07Z"
},
{
"name": "container:event:kill",
"description": "Container kill event",
"health": "ok",
"severity": "info",
"value": "0",
"updatedAt": "2021-09-24T20:42:29Z"
},
{
"name": "container:event:restart",
"description": "Container restart event",
"health": "ok",
"severity": "info",
"value": "0",
"updatedAt": "2022-01-22T22:13:38Z"
},
{
"name": "container:event:restart-last-hour",
"description": "Container restart count in the last hour",
"health": "ok",
"severity": "info",
"value": "0",
"updatedAt": "2021-09-24T20:42:29Z"
},
{
"name": "container:event:start",
"description": "Container start event",
"health": "ok",
"severity": "info",
"value": "0",
"updatedAt": "2021-09-24T20:42:29Z"
},
{
"name": "container:event:stop",
"description": "Container stop event",
"health": "ok",
"severity": "info",
"value": "0",
"updatedAt": "2021-09-24T20:42:29Z"
},
{
"name": "container:running",
"description": "Container running",
"health": "ok",
"severity": "info",
"value": "true",
"updatedAt": "2022-01-24T05:31:38Z"
},
{
"name": "service:component:version",
"description": "Service component version",
"health": "ok",
"severity": "info",
"value": "",
"updatedAt": "2022-01-22T22:13:38Z"
},
{
"name": "service:file-watcher-error",
"description": "Service file watcher error",
"health": "ok",
"severity": "info",
"value": "false",
"updatedAt": "2021-09-24T20:42:29Z"
},
{
"name": "service:message-error",
"description": "Service health monitor error",
"health": "ok",
"severity": "info",
"value": "",
"updatedAt": "2022-01-22T22:13:38Z"
},
{
"name": "service:message-error-count",
"description": "Service health monitor error count",
"health": "ok",
"severity": "info",
"value": "0",
"updatedAt": "2021-09-24T20:42:29Z"
},
{
"name": "service:overall-health",
"description": "Service reported overall health",
"health": "ok",
"severity": "info",
"value": "Ok",
"updatedAt": "2022-01-22T22:13:38Z"
},
{
"name": "service:ready",
"description": "Service ready status",
"health": "ok",
"severity": "info",
"value": "true",
"updatedAt": "2022-01-22T22:13:38Z"
},
{
"name": "service:restart-count",
"description": "Service total restart count",
"health": "ok",
"severity": "info",
"value": "0",
"updatedAt": "2022-01-22T22:13:38Z"
},
{
"name": "service:restart-last-hour",
"description": "Service restart count in the last hour",
"health": "ok",
"severity": "info",
"value": "0",
"updatedAt": "2021-09-24T20:42:29Z"
},
{
"name": "service:startup-timestamp",
"description": "Service startup timestamp",
"health": "ok",
"severity": "info",
"value": "2022-01-22T22:13:14.550073349Z",
"updatedAt": "2022-01-22T22:13:38Z"
},
{
"name": "service:version",
"description": "Service version",
"health": "ok",
"severity": "info",
"value": "0.0.0",
"updatedAt": "2022-01-22T22:13:38Z"
}
]
}
},
{
"key": "appliance/services/platform-fwu/service",
"state": {
"name": "service",
"health": "ok",
"severity": "info"
},
"attributes": {
"attribute": [
{
"name": "bios:recovery:image",
"description": "FWU was able to execute creation of BIOS recovery image",
"health": "ok",
"severity": "info",
"value": "true",
"updatedAt": "2022-01-22T22:13:38Z"
},
{
"name": "hal:connection",
"description": "FWU is able to communicate with HAL using ZMQ",
"health": "ok",
"severity": "info",
"value": "true",
"updatedAt": "2022-01-22T22:13:38Z"
}
]
}
},
{
"key": "appliance/services/platform-hal",
"state": {
"name": "platform-hal",
"health": "ok",
"severity": "info"
},
"attributes": {
"attribute": [
{
"name": "container:event:attach",
"description": "Container attach event",
"health": "ok",
"severity": "info",
"value": "0",
"updatedAt": "2021-09-24T20:42:29Z"
},
{
"name": "container:event:die",
"description": "Container die event",
"health": "ok",
"severity": "info",
"value": "0",
"updatedAt": "2021-09-24T20:42:29Z"
},
{
"name": "container:event:exec-create",
"description": "Container exec create event",
"health": "ok",
"severity": "info",
"value": "0",
"updatedAt": "2022-01-22T22:10:35Z"
},
{
"name": "container:event:exec-detach",
"description": "Container exec detach event",
"health": "ok",
"severity": "info",
"value": "0",
"updatedAt": "2021-09-24T20:42:29Z"
},
{
"name": "container:event:exec-die",
"description": "Container exec die event",
"health": "ok",
"severity": "info",
"value": "0",
"updatedAt": "2021-09-24T20:42:29Z"
},
{
"name": "container:event:exec-start",
"description": "Container exec start event",
"health": "ok",
"severity": "info",
"value": "0",
"updatedAt": "2022-01-22T22:10:35Z"
},
{
"name": "container:event:kill",
"description": "Container kill event",
"health": "ok",
"severity": "info",
"value": "0",
"updatedAt": "2021-09-24T20:42:29Z"
},
{
"name": "container:event:restart",
"description": "Container restart event",
"health": "ok",
"severity": "info",
"value": "0",
"updatedAt": "2022-01-22T22:13:38Z"
},
{
"name": "container:event:restart-last-hour",
"description": "Container restart count in the last hour",
"health": "ok",
"severity": "info",
"value": "0",
"updatedAt": "2021-09-24T20:42:29Z"
},
{
"name": "container:event:start",
"description": "Container start event",
"health": "ok",
"severity": "info",
"value": "0",
"updatedAt": "2021-09-24T20:42:29Z"
},
{
"name": "container:event:stop",
"description": "Container stop event",
"health": "ok",
"severity": "info",
"value": "0",
"updatedAt": "2021-09-24T20:42:29Z"
},
{
"name": "container:running",
"description": "Container running",
"health": "ok",
"severity": "info",
"value": "true",
"updatedAt": "2022-01-24T05:31:38Z"
},
{
"name": "service:component:version",
"description": "Service component version",
"health": "ok",
"severity": "info",
"value": "1.0",
"updatedAt": "2022-01-22T22:13:40Z"
},
{
"name": "service:message-error",
"description": "Service health monitor error",
"health": "ok",
"severity": "info",
"value": "",
"updatedAt": "2022-01-24T05:32:06Z"
},
{
"name": "service:message-error-count",
"description": "Service health monitor error count",
"health": "ok",
"severity": "info",
"value": "0",
"updatedAt": "2021-11-30T03:09:40Z"
},
{
"name": "service:overall-health",
"description": "Service reported overall health",
"health": "ok",
"severity": "info",
"value": "",
"updatedAt": "2021-09-24T20:42:29Z"
},
{
"name": "service:ready",
"description": "Service ready status",
"health": "ok",
"severity": "info",
"value": "true",
"updatedAt": "2022-01-24T05:32:06Z"
},
{
"name": "service:restart-count",
"description": "Service total restart count",
"health": "ok",
"severity": "info",
"value": "0",
"updatedAt": "2022-01-22T22:13:38Z"
},
{
"name": "service:restart-last-hour",
"description": "Service restart count in the last hour",
"health": "ok",
"severity": "info",
"value": "0",
"updatedAt": "2021-09-24T20:42:29Z"
},
{
"name": "service:startup-timestamp",
"description": "Service startup timestamp",
"health": "ok",
"severity": "info",
"value": "2022-01-22T22:13:24.156131057Z",
"updatedAt": "2022-01-24T05:32:06Z"
},
{
"name": "service:version",
"description": "Service version",
"health": "ok",
"severity": "info",
"value": "1.14.54",
"updatedAt": "2022-01-24T05:32:06Z"
}
]
}
},
{
"key": "appliance/services/platform-hal/lopd",
"state": {
"name": "LOPd Service",
"health": "ok",
"severity": "info"
},
"attributes": {
"attribute": [
{
"name": "lopd:network:port",
"description": "LOPd Port",
"health": "ok",
"severity": "info",
"value": "true",
"updatedAt": "2022-01-24T05:32:06Z"
},
{
"name": "lopd:usb:device",
"description": "LOP USB Device",
"health": "ok",
"severity": "info",
"value": "true",
"updatedAt": "2022-01-24T05:32:06Z"
}
]
}
},
{
"key": "appliance/services/platform-monitor",
"state": {
"name": "platform-monitor",
"health": "ok",
"severity": "info"
},
"attributes": {
"attribute": [
{
"name": "container:event:attach",
"description": "Container attach event",
"health": "ok",
"severity": "info",
"value": "0",
"updatedAt": "2021-09-24T20:42:29Z"
},
{
"name": "container:event:die",
"description": "Container die event",
"health": "ok",
"severity": "info",
"value": "0",
"updatedAt": "2021-09-24T20:42:29Z"
},
{
"name": "container:event:exec-create",
"description": "Container exec create event",
"health": "ok",
"severity": "info",
"value": "0",
"updatedAt": "2022-01-18T01:29:16Z"
},
{
"name": "container:event:exec-detach",
"description": "Container exec detach event",
"health": "ok",
"severity": "info",
"value": "0",
"updatedAt": "2021-09-24T20:42:29Z"
},
{
"name": "container:event:exec-die",
"description": "Container exec die event",
"health": "ok",
"severity": "info",
"value": "0",
"updatedAt": "2021-09-24T20:42:29Z"
},
{
"name": "container:event:exec-start",
"description": "Container exec start event",
"health": "ok",
"severity": "info",
"value": "0",
"updatedAt": "2022-01-18T01:29:16Z"
},
{
"name": "container:event:kill",
"description": "Container kill event",
"health": "ok",
"severity": "info",
"value": "0",
"updatedAt": "2021-09-24T20:42:29Z"
},
{
"name": "container:event:restart",
"description": "Container restart event",
"health": "ok",
"severity": "info",
"value": "0",
"updatedAt": "2022-01-22T22:13:38Z"
},
{
"name": "container:event:restart-last-hour",
"description": "Container restart count in the last hour",
"health": "ok",
"severity": "info",
"value": "0",
"updatedAt": "2021-09-24T20:42:29Z"
},
{
"name": "container:event:start",
"description": "Container start event",
"health": "ok",
"severity": "info",
"value": "0",
"updatedAt": "2021-09-24T20:42:29Z"
},
{
"name": "container:event:stop",
"description": "Container stop event",
"health": "ok",
"severity": "info",
"value": "0",
"updatedAt": "2021-09-24T20:42:29Z"
},
{
"name": "container:running",
"description": "Container running",
"health": "ok",
"severity": "info",
"value": "true",
"updatedAt": "2022-01-24T05:31:38Z"
},
{
"name": "service:component:version",
"description": "Service component version",
"health": "ok",
"severity": "info",
"value": "",
"updatedAt": "2022-01-22T22:13:38Z"
},
{
"name": "service:file-watcher-error",
"description": "Service file watcher error",
"health": "ok",
"severity": "info",
"value": "false",
"updatedAt": "2021-09-24T20:42:29Z"
},
{
"name": "service:message-error",
"description": "Service health monitor error",
"health": "ok",
"severity": "info",
"value": "",
"updatedAt": "2022-01-22T22:13:38Z"
},
{
"name": "service:message-error-count",
"description": "Service health monitor error count",
"health": "ok",
"severity": "info",
"value": "0",
"updatedAt": "2021-09-24T20:42:29Z"
},
{
"name": "service:overall-health",
"description": "Service reported overall health",
"health": "ok",
"severity": "info",
"value": "Ok",
"updatedAt": "2022-01-22T22:13:38Z"
},
{
"name": "service:ready",
"description": "Service ready status",
"health": "ok",
"severity": "info",
"value": "true",
"updatedAt": "2022-01-22T22:13:38Z"
},
{
"name": "service:restart-count",
"description": "Service total restart count",
"health": "ok",
"severity": "info",
"value": "0",
"updatedAt": "2022-01-22T22:13:38Z"
},
{
"name": "service:restart-last-hour",
"description": "Service restart count in the last hour",
"health": "ok",
"severity": "info",
"value": "0",
"updatedAt": "2021-09-24T20:42:29Z"
},
{
"name": "service:startup-timestamp",
"description": "Service startup timestamp",
"health": "ok",
"severity": "info",
"value": "2022-01-22T22:13:14.45812303Z",
"updatedAt": "2022-01-22T22:13:38Z"
},
{
"name": "service:version",
"description": "Service version",
"health": "ok",
"severity": "info",
"value": "1.17.11",
"updatedAt": "2022-01-22T22:13:38Z"
}
]
}
},
{
"key": "appliance/services/platform-monitor/service",
"state": {
"name": "service",
"health": "ok",
"severity": "info"
},
"attributes": {
"attribute": [
{
"name": "hal:connection",
"description": "Monitor is able to communicate with HAL",
"health": "ok",
"severity": "info",
"value": "true",
"updatedAt": "2022-01-22T22:13:38Z"
}
]
}
},
{
"key": "appliance/services/platform-stats",
"state": {
"name": "platform-stats",
"health": "ok",
"severity": "info"
},
"attributes": {
"attribute": [
{
"name": "container:event:attach",
"description": "Container attach event",
"health": "ok",
"severity": "info",
"value": "0",
"updatedAt": "2021-09-24T20:42:29Z"
},
{
"name": "container:event:die",
"description": "Container die event",
"health": "ok",
"severity": "info",
"value": "0",
"updatedAt": "2022-01-15T06:44:35Z"
},
{
"name": "container:event:exec-create",
"description": "Container exec create event",
"health": "ok",
"severity": "info",
"value": "0",
"updatedAt": "2022-01-18T01:29:44Z"
},
{
"name": "container:event:exec-detach",
"description": "Container exec detach event",
"health": "ok",
"severity": "info",
"value": "0",
"updatedAt": "2021-09-24T20:42:29Z"
},
{
"name": "container:event:exec-die",
"description": "Container exec die event",
"health": "ok",
"severity": "info",
"value": "0",
"updatedAt": "2021-09-24T20:42:29Z"
},
{
"name": "container:event:exec-start",
"description": "Container exec start event",
"health": "ok",
"severity": "info",
"value": "0",
"updatedAt": "2022-01-18T01:29:44Z"
},
{
"name": "container:event:kill",
"description": "Container kill event",
"health": "ok",
"severity": "info",
"value": "0",
"updatedAt": "2022-01-22T22:10:39Z"
},
{
"name": "container:event:restart",
"description": "Container restart event",
"health": "ok",
"severity": "info",
"value": "0",
"updatedAt": "2022-01-22T22:13:38Z"
},
{
"name": "container:event:restart-last-hour",
"description": "Container restart count in the last hour",
"health": "ok",
"severity": "info",
"value": "0",
"updatedAt": "2021-09-24T20:42:29Z"
},
{
"name": "container:event:start",
"description": "Container start event",
"health": "ok",
"severity": "info",
"value": "0",
"updatedAt": "2021-09-24T20:42:29Z"
},
{
"name": "container:event:stop",
"description": "Container stop event",
"health": "ok",
"severity": "info",
"value": "0",
"updatedAt": "2022-01-15T06:01:01Z"
},
{
"name": "container:running",
"description": "Container running",
"health": "ok",
"severity": "info",
"value": "true",
"updatedAt": "2022-01-24T05:31:38Z"
},
{
"name": "service:component:version",
"description": "Service component version",
"health": "ok",
"severity": "info",
"value": "",
"updatedAt": "2022-01-22T22:13:38Z"
},
{
"name": "service:file-watcher-error",
"description": "Service file watcher error",
"health": "ok",
"severity": "info",
"value": "false",
"updatedAt": "2021-09-24T20:42:29Z"
},
{
"name": "service:message-error",
"description": "Service health monitor error",
"health": "ok",
"severity": "info",
"value": "",
"updatedAt": "2022-01-22T22:13:38Z"
},
{
"name": "service:message-error-count",
"description": "Service health monitor error count",
"health": "ok",
"severity": "info",
"value": "0",
"updatedAt": "2021-09-24T20:42:29Z"
},
{
"name": "service:overall-health",
"description": "Service reported overall health",
"health": "ok",
"severity": "info",
"value": "Ok",
"updatedAt": "2022-01-22T22:13:38Z"
},
{
"name": "service:ready",
"description": "Service ready status",
"health": "ok",
"severity": "info",
"value": "true",
"updatedAt": "2022-01-22T22:13:38Z"
},
{
"name": "service:restart-count",
"description": "Service total restart count",
"health": "ok",
"severity": "info",
"value": "0",
"updatedAt": "2022-01-22T22:13:38Z"
},
{
"name": "service:restart-last-hour",
"description": "Service restart count in the last hour",
"health": "ok",
"severity": "info",
"value": "0",
"updatedAt": "2021-09-24T20:42:29Z"
},
{
"name": "service:startup-timestamp",
"description": "Service startup timestamp",
"health": "ok",
"severity": "info",
"value": "2022-01-22T22:13:14.115696097Z",
"updatedAt": "2022-01-22T22:13:38Z"
},
{
"name": "service:version",
"description": "Service version",
"health": "ok",
"severity": "info",
"value": "1.6.5",
"updatedAt": "2022-01-22T22:13:38Z"
}
]
}
},
{
"key": "appliance/services/platform-stats/service",
"state": {
"name": "service",
"health": "ok",
"severity": "info"
}
},
{
"key": "appliance/services/qat-support-pod",
"state": {
"name": "qat-support-pod",
"health": "ok",
"severity": "info"
},
"attributes": {
"attribute": [
{
"name": "container:event:attach",
"description": "Container attach event",
"health": "ok",
"severity": "info",
"value": "0",
"updatedAt": "2021-09-24T20:42:30Z"
},
{
"name": "container:event:die",
"description": "Container die event",
"health": "ok",
"severity": "info",
"value": "0",
"updatedAt": "2022-01-15T06:44:35Z"
},
{
"name": "container:event:exec-create",
"description": "Container exec create event",
"health": "ok",
"severity": "info",
"value": "0",
"updatedAt": "2022-01-18T01:29:50Z"
},
{
"name": "container:event:exec-detach",
"description": "Container exec detach event",
"health": "ok",
"severity": "info",
"value": "0",
"updatedAt": "2021-09-24T20:42:30Z"
},
{
"name": "container:event:exec-die",
"description": "Container exec die event",
"health": "ok",
"severity": "info",
"value": "0",
"updatedAt": "2021-09-24T20:42:30Z"
},
{
"name": "container:event:exec-start",
"description": "Container exec start event",
"health": "ok",
"severity": "info",
"value": "0",
"updatedAt": "2022-01-18T01:29:50Z"
},
{
"name": "container:event:kill",
"description": "Container kill event",
"health": "ok",
"severity": "info",
"value": "0",
"updatedAt": "2022-01-22T22:10:39Z"
},
{
"name": "container:event:restart",
"description": "Container restart event",
"health": "ok",
"severity": "info",
"value": "0",
"updatedAt": "2022-01-22T22:13:38Z"
},
{
"name": "container:event:restart-last-hour",
"description": "Container restart count in the last hour",
"health": "ok",
"severity": "info",
"value": "0",
"updatedAt": "2021-09-24T20:42:30Z"
},
{
"name": "container:event:start",
"description": "Container start event",
"health": "ok",
"severity": "info",
"value": "0",
"updatedAt": "2021-09-24T20:42:30Z"
},
{
"name": "container:event:stop",
"description": "Container stop event",
"health": "ok",
"severity": "info",
"value": "0",
"updatedAt": "2022-01-15T06:01:01Z"
},
{
"name": "container:running",
"description": "Container running",
"health": "ok",
"severity": "info",
"value": "true",
"updatedAt": "2022-01-24T05:31:38Z"
}
]
}
},
{
"key": "appliance/services/qkviewd",
"state": {
"name": "qkviewd",
"health": "ok",
"severity": "info"
},
"attributes": {
"attribute": [
{
"name": "container:event:attach",
"description": "Container attach event",
"health": "ok",
"severity": "info",
"value": "0",
"updatedAt": "2021-09-24T20:42:30Z"
},
{
"name": "container:event:die",
"description": "Container die event",
"health": "ok",
"severity": "info",
"value": "0",
"updatedAt": "2022-01-15T06:01:01Z"
},
{
"name": "container:event:exec-create",
"description": "Container exec create event",
"health": "ok",
"severity": "info",
"value": "0",
"updatedAt": "2022-01-18T01:29:40Z"
},
{
"name": "container:event:exec-detach",
"description": "Container exec detach event",
"health": "ok",
"severity": "info",
"value": "0",
"updatedAt": "2021-09-24T20:42:30Z"
},
{
"name": "container:event:exec-die",
"description": "Container exec die event",
"health": "ok",
"severity": "info",
"value": "0",
"updatedAt": "2021-09-24T20:42:30Z"
},
{
"name": "container:event:exec-start",
"description": "Container exec start event",
"health": "ok",
"severity": "info",
"value": "0",
"updatedAt": "2022-01-18T01:29:40Z"
},
{
"name": "container:event:kill",
"description": "Container kill event",
"health": "ok",
"severity": "info",
"value": "0",
"updatedAt": "2022-01-22T22:10:38Z"
},
{
"name": "container:event:restart",
"description": "Container restart event",
"health": "ok",
"severity": "info",
"value": "0",
"updatedAt": "2022-01-22T22:13:38Z"
},
{
"name": "container:event:restart-last-hour",
"description": "Container restart count in the last hour",
"health": "ok",
"severity": "info",
"value": "0",
"updatedAt": "2021-09-24T20:42:30Z"
},
{
"name": "container:event:start",
"description": "Container start event",
"health": "ok",
"severity": "info",
"value": "0",
"updatedAt": "2021-09-24T20:42:30Z"
},
{
"name": "container:event:stop",
"description": "Container stop event",
"health": "ok",
"severity": "info",
"value": "0",
"updatedAt": "2022-01-15T06:01:01Z"
},
{
"name": "container:running",
"description": "Container running",
"health": "ok",
"severity": "info",
"value": "true",
"updatedAt": "2022-01-24T05:31:38Z"
}
]
}
},
{
"key": "appliance/services/snmp-trapd",
"state": {
"name": "snmp-trapd",
"health": "ok",
"severity": "info"
},
"attributes": {
"attribute": [
{
"name": "container:event:attach",
"description": "Container attach event",
"health": "ok",
"severity": "info",
"value": "0",
"updatedAt": "2021-09-24T20:42:30Z"
},
{
"name": "container:event:die",
"description": "Container die event",
"health": "ok",
"severity": "info",
"value": "0",
"updatedAt": "2022-01-15T06:01:01Z"
},
{
"name": "container:event:exec-create",
"description": "Container exec create event",
"health": "ok",
"severity": "info",
"value": "0",
"updatedAt": "2022-01-18T01:30:18Z"
},
{
"name": "container:event:exec-detach",
"description": "Container exec detach event",
"health": "ok",
"severity": "info",
"value": "0",
"updatedAt": "2021-09-24T20:42:30Z"
},
{
"name": "container:event:exec-die",
"description": "Container exec die event",
"health": "ok",
"severity": "info",
"value": "0",
"updatedAt": "2021-09-24T20:42:30Z"
},
{
"name": "container:event:exec-start",
"description": "Container exec start event",
"health": "ok",
"severity": "info",
"value": "0",
"updatedAt": "2022-01-18T01:30:18Z"
},
{
"name": "container:event:kill",
"description": "Container kill event",
"health": "ok",
"severity": "info",
"value": "0",
"updatedAt": "2022-01-22T22:10:39Z"
},
{
"name": "container:event:restart",
"description": "Container restart event",
"health": "ok",
"severity": "info",
"value": "0",
"updatedAt": "2022-01-22T22:13:38Z"
},
{
"name": "container:event:restart-last-hour",
"description": "Container restart count in the last hour",
"health": "ok",
"severity": "info",
"value": "0",
"updatedAt": "2021-09-24T20:42:30Z"
},
{
"name": "container:event:start",
"description": "Container start event",
"health": "ok",
"severity": "info",
"value": "0",
"updatedAt": "2021-10-06T22:37:03Z"
},
{
"name": "container:event:stop",
"description": "Container stop event",
"health": "ok",
"severity": "info",
"value": "0",
"updatedAt": "2022-01-15T06:01:01Z"
},
{
"name": "container:running",
"description": "Container running",
"health": "ok",
"severity": "info",
"value": "true",
"updatedAt": "2022-01-24T05:31:38Z"
}
]
}
},
{
"key": "appliance/services/snmpd",
"state": {
"name": "snmpd",
"health": "ok",
"severity": "info"
},
"attributes": {
"attribute": [
{
"name": "container:event:attach",
"description": "Container attach event",
"health": "ok",
"severity": "info",
"value": "0",
"updatedAt": "2021-09-24T20:42:30Z"
},
{
"name": "container:event:die",
"description": "Container die event",
"health": "ok",
"severity": "info",
"value": "0",
"updatedAt": "2022-01-22T22:10:39Z"
},
{
"name": "container:event:exec-create",
"description": "Container exec create event",
"health": "ok",
"severity": "info",
"value": "0",
"updatedAt": "2022-01-18T01:30:08Z"
},
{
"name": "container:event:exec-detach",
"description": "Container exec detach event",
"health": "ok",
"severity": "info",
"value": "0",
"updatedAt": "2021-09-24T20:42:30Z"
},
{
"name": "container:event:exec-die",
"description": "Container exec die event",
"health": "ok",
"severity": "info",
"value": "0",
"updatedAt": "2021-09-24T20:42:30Z"
},
{
"name": "container:event:exec-start",
"description": "Container exec start event",
"health": "ok",
"severity": "info",
"value": "0",
"updatedAt": "2022-01-18T01:30:08Z"
},
{
"name": "container:event:kill",
"description": "Container kill event",
"health": "ok",
"severity": "info",
"value": "0",
"updatedAt": "2022-01-22T22:10:39Z"
},
{
"name": "container:event:restart",
"description": "Container restart event",
"health": "ok",
"severity": "info",
"value": "0",
"updatedAt": "2022-01-22T22:13:38Z"
},
{
"name": "container:event:restart-last-hour",
"description": "Container restart count in the last hour",
"health": "ok",
"severity": "info",
"value": "0",
"updatedAt": "2021-09-24T20:42:30Z"
},
{
"name": "container:event:start",
"description": "Container start event",
"health": "ok",
"severity": "info",
"value": "0",
"updatedAt": "2021-09-24T20:42:30Z"
},
{
"name": "container:event:stop",
"description": "Container stop event",
"health": "ok",
"severity": "info",
"value": "0",
"updatedAt": "2021-10-21T16:16:48Z"
},
{
"name": "container:running",
"description": "Container running",
"health": "ok",
"severity": "info",
"value": "true",
"updatedAt": "2022-01-24T05:31:38Z"
}
]
}
},
{
"key": "appliance/services/stream-generator",
"state": {
"name": "stream-generator",
"health": "ok",
"severity": "info"
},
"attributes": {
"attribute": [
{
"name": "container:event:attach",
"description": "Container attach event",
"health": "ok",
"severity": "info",
"value": "0",
"updatedAt": "2021-09-24T20:42:30Z"
},
{
"name": "container:event:die",
"description": "Container die event",
"health": "ok",
"severity": "info",
"value": "0",
"updatedAt": "2021-09-24T20:42:30Z"
},
{
"name": "container:event:exec-create",
"description": "Container exec create event",
"health": "ok",
"severity": "info",
"value": "0",
"updatedAt": "2022-01-18T01:29:52Z"
},
{
"name": "container:event:exec-detach",
"description": "Container exec detach event",
"health": "ok",
"severity": "info",
"value": "0",
"updatedAt": "2021-09-24T20:42:30Z"
},
{
"name": "container:event:exec-die",
"description": "Container exec die event",
"health": "ok",
"severity": "info",
"value": "0",
"updatedAt": "2021-09-24T20:42:30Z"
},
{
"name": "container:event:exec-start",
"description": "Container exec start event",
"health": "ok",
"severity": "info",
"value": "0",
"updatedAt": "2022-01-18T01:29:52Z"
},
{
"name": "container:event:kill",
"description": "Container kill event",
"health": "ok",
"severity": "info",
"value": "0",
"updatedAt": "2022-01-22T22:10:38Z"
},
{
"name": "container:event:restart",
"description": "Container restart event",
"health": "ok",
"severity": "info",
"value": "0",
"updatedAt": "2022-01-22T22:13:38Z"
},
{
"name": "container:event:restart-last-hour",
"description": "Container restart count in the last hour",
"health": "ok",
"severity": "info",
"value": "0",
"updatedAt": "2021-09-24T20:42:30Z"
},
{
"name": "container:event:start",
"description": "Container start event",
"health": "ok",
"severity": "info",
"value": "0",
"updatedAt": "2021-09-24T20:42:30Z"
},
{
"name": "container:event:stop",
"description": "Container stop event",
"health": "ok",
"severity": "info",
"value": "0",
"updatedAt": "2021-09-24T20:42:30Z"
},
{
"name": "container:running",
"description": "Container running",
"health": "ok",
"severity": "info",
"value": "true",
"updatedAt": "2022-01-24T05:31:38Z"
}
]
}
},
{
"key": "appliance/services/swdiag-agent",
"state": {
"name": "swdiag-agent",
"health": "ok",
"severity": "info"
},
"attributes": {
"attribute": [
{
"name": "container:event:attach",
"description": "Container attach event",
"health": "ok",
"severity": "info",
"value": "0",
"updatedAt": "2021-09-24T20:42:30Z"
},
{
"name": "container:event:die",
"description": "Container die event",
"health": "ok",
"severity": "info",
"value": "0",
"updatedAt": "2022-01-15T06:44:35Z"
},
{
"name": "container:event:exec-create",
"description": "Container exec create event",
"health": "ok",
"severity": "info",
"value": "0",
"updatedAt": "2022-01-18T01:29:50Z"
},
{
"name": "container:event:exec-detach",
"description": "Container exec detach event",
"health": "ok",
"severity": "info",
"value": "0",
"updatedAt": "2021-09-24T20:42:30Z"
},
{
"name": "container:event:exec-die",
"description": "Container exec die event",
"health": "ok",
"severity": "info",
"value": "0",
"updatedAt": "2021-09-24T20:42:30Z"
},
{
"name": "container:event:exec-start",
"description": "Container exec start event",
"health": "ok",
"severity": "info",
"value": "0",
"updatedAt": "2022-01-18T01:29:50Z"
},
{
"name": "container:event:kill",
"description": "Container kill event",
"health": "ok",
"severity": "info",
"value": "0",
"updatedAt": "2022-01-22T22:10:39Z"
},
{
"name": "container:event:restart",
"description": "Container restart event",
"health": "ok",
"severity": "info",
"value": "0",
"updatedAt": "2022-01-22T22:13:38Z"
},
{
"name": "container:event:restart-last-hour",
"description": "Container restart count in the last hour",
"health": "ok",
"severity": "info",
"value": "0",
"updatedAt": "2021-09-24T20:42:30Z"
},
{
"name": "container:event:start",
"description": "Container start event",
"health": "ok",
"severity": "info",
"value": "0",
"updatedAt": "2021-09-24T20:42:30Z"
},
{
"name": "container:event:stop",
"description": "Container stop event",
"health": "ok",
"severity": "info",
"value": "0",
"updatedAt": "2022-01-15T06:01:01Z"
},
{
"name": "container:running",
"description": "Container running",
"health": "ok",
"severity": "info",
"value": "true",
"updatedAt": "2022-01-24T05:31:38Z"
}
]
}
},
{
"key": "appliance/services/system-common",
"state": {
"name": "system-common",
"health": "ok",
"severity": "info"
},
"attributes": {
"attribute": [
{
"name": "container:event:attach",
"description": "Container attach event",
"health": "ok",
"severity": "info",
"value": "0",
"updatedAt": "2021-09-24T20:42:30Z"
},
{
"name": "container:event:die",
"description": "Container die event",
"health": "ok",
"severity": "info",
"value": "0",
"updatedAt": "2022-01-15T06:01:01Z"
},
{
"name": "container:event:exec-create",
"description": "Container exec create event",
"health": "ok",
"severity": "info",
"value": "0",
"updatedAt": "2022-01-18T01:27:54Z"
},
{
"name": "container:event:exec-detach",
"description": "Container exec detach event",
"health": "ok",
"severity": "info",
"value": "0",
"updatedAt": "2021-09-24T20:42:30Z"
},
{
"name": "container:event:exec-die",
"description": "Container exec die event",
"health": "ok",
"severity": "info",
"value": "0",
"updatedAt": "2021-09-24T20:42:30Z"
},
{
"name": "container:event:exec-start",
"description": "Container exec start event",
"health": "ok",
"severity": "info",
"value": "0",
"updatedAt": "2022-01-18T01:27:54Z"
},
{
"name": "container:event:kill",
"description": "Container kill event",
"health": "ok",
"severity": "info",
"value": "0",
"updatedAt": "2022-01-22T22:10:38Z"
},
{
"name": "container:event:restart",
"description": "Container restart event",
"health": "ok",
"severity": "info",
"value": "0",
"updatedAt": "2022-01-22T22:13:38Z"
},
{
"name": "container:event:restart-last-hour",
"description": "Container restart count in the last hour",
"health": "ok",
"severity": "info",
"value": "0",
"updatedAt": "2021-09-24T20:42:30Z"
},
{
"name": "container:event:start",
"description": "Container start event",
"health": "ok",
"severity": "info",
"value": "0",
"updatedAt": "2021-09-24T20:42:30Z"
},
{
"name": "container:event:stop",
"description": "Container stop event",
"health": "ok",
"severity": "info",
"value": "0",
"updatedAt": "2022-01-15T06:01:01Z"
},
{
"name": "container:running",
"description": "Container running",
"health": "ok",
"severity": "info",
"value": "true",
"updatedAt": "2022-01-24T05:31:38Z"
}
]
}
},
{
"key": "appliance/services/system-vconsole",
"state": {
"name": "system-vconsole",
"health": "ok",
"severity": "info"
},
"attributes": {
"attribute": [
{
"name": "container:event:attach",
"description": "Container attach event",
"health": "ok",
"severity": "info",
"value": "0",
"updatedAt": "2021-09-24T20:42:30Z"
},
{
"name": "container:event:die",
"description": "Container die event",
"health": "ok",
"severity": "info",
"value": "0",
"updatedAt": "2022-01-15T06:01:01Z"
},
{
"name": "container:event:exec-create",
"description": "Container exec create event",
"health": "ok",
"severity": "info",
"value": "0",
"updatedAt": "2022-01-18T01:27:46Z"
},
{
"name": "container:event:exec-detach",
"description": "Container exec detach event",
"health": "ok",
"severity": "info",
"value": "0",
"updatedAt": "2021-09-24T20:42:30Z"
},
{
"name": "container:event:exec-die",
"description": "Container exec die event",
"health": "ok",
"severity": "info",
"value": "0",
"updatedAt": "2021-09-24T20:42:30Z"
},
{
"name": "container:event:exec-start",
"description": "Container exec start event",
"health": "ok",
"severity": "info",
"value": "0",
"updatedAt": "2022-01-18T01:27:46Z"
},
{
"name": "container:event:kill",
"description": "Container kill event",
"health": "ok",
"severity": "info",
"value": "0",
"updatedAt": "2022-01-22T22:10:39Z"
},
{
"name": "container:event:restart",
"description": "Container restart event",
"health": "ok",
"severity": "info",
"value": "0",
"updatedAt": "2022-01-22T22:13:38Z"
},
{
"name": "container:event:restart-last-hour",
"description": "Container restart count in the last hour",
"health": "ok",
"severity": "info",
"value": "0",
"updatedAt": "2021-09-24T20:42:30Z"
},
{
"name": "container:event:start",
"description": "Container start event",
"health": "ok",
"severity": "info",
"value": "0",
"updatedAt": "2021-09-24T20:42:30Z"
},
{
"name": "container:event:stop",
"description": "Container stop event",
"health": "ok",
"severity": "info",
"value": "0",
"updatedAt": "2022-01-15T06:01:01Z"
},
{
"name": "container:running",
"description": "Container running",
"health": "ok",
"severity": "info",
"value": "true",
"updatedAt": "2022-01-24T05:31:38Z"
}
]
}
},
{
"key": "appliance/services/system_L2",
"state": {
"name": "system_L2",
"health": "ok",
"severity": "info"
},
"attributes": {
"attribute": [
{
"name": "container:event:attach",
"description": "Container attach event",
"health": "ok",
"severity": "info",
"value": "0",
"updatedAt": "2021-09-24T20:42:30Z"
},
{
"name": "container:event:die",
"description": "Container die event",
"health": "ok",
"severity": "info",
"value": "0",
"updatedAt": "2021-09-24T20:42:30Z"
},
{
"name": "container:event:exec-create",
"description": "Container exec create event",
"health": "ok",
"severity": "info",
"value": "0",
"updatedAt": "2022-01-18T01:27:52Z"
},
{
"name": "container:event:exec-detach",
"description": "Container exec detach event",
"health": "ok",
"severity": "info",
"value": "0",
"updatedAt": "2021-09-24T20:42:30Z"
},
{
"name": "container:event:exec-die",
"description": "Container exec die event",
"health": "ok",
"severity": "info",
"value": "0",
"updatedAt": "2021-09-24T20:42:30Z"
},
{
"name": "container:event:exec-start",
"description": "Container exec start event",
"health": "ok",
"severity": "info",
"value": "0",
"updatedAt": "2022-01-18T01:27:52Z"
},
{
"name": "container:event:kill",
"description": "Container kill event",
"health": "ok",
"severity": "info",
"value": "0",
"updatedAt": "2021-09-24T20:42:30Z"
},
{
"name": "container:event:restart",
"description": "Container restart event",
"health": "ok",
"severity": "info",
"value": "0",
"updatedAt": "2022-01-22T22:13:38Z"
},
{
"name": "container:event:restart-last-hour",
"description": "Container restart count in the last hour",
"health": "ok",
"severity": "info",
"value": "0",
"updatedAt": "2021-09-24T20:42:30Z"
},
{
"name": "container:event:start",
"description": "Container start event",
"health": "ok",
"severity": "info",
"value": "0",
"updatedAt": "2021-09-24T20:42:30Z"
},
{
"name": "container:event:stop",
"description": "Container stop event",
"health": "ok",
"severity": "info",
"value": "0",
"updatedAt": "2021-09-24T20:42:30Z"
},
{
"name": "container:running",
"description": "Container running",
"health": "ok",
"severity": "info",
"value": "true",
"updatedAt": "2022-01-24T05:31:38Z"
},
{
"name": "service:component:version",
"description": "Service component version",
"health": "ok",
"severity": "info",
"value": "",
"updatedAt": "2021-09-24T20:42:30Z"
},
{
"name": "service:file-watcher-error",
"description": "Service file watcher error",
"health": "ok",
"severity": "info",
"value": "false",
"updatedAt": "2021-09-24T20:42:30Z"
},
{
"name": "service:message-error",
"description": "Service health monitor error",
"health": "ok",
"severity": "info",
"value": "",
"updatedAt": "2022-01-22T22:13:38Z"
},
{
"name": "service:message-error-count",
"description": "Service health monitor error count",
"health": "ok",
"severity": "info",
"value": "0",
"updatedAt": "2021-09-24T20:42:30Z"
},
{
"name": "service:overall-health",
"description": "Service reported overall health",
"health": "ok",
"severity": "info",
"value": "Ok",
"updatedAt": "2022-01-22T22:13:38Z"
},
{
"name": "service:ready",
"description": "Service ready status",
"health": "ok",
"severity": "info",
"value": "true",
"updatedAt": "2022-01-22T22:13:38Z"
},
{
"name": "service:restart-count",
"description": "Service total restart count",
"health": "ok",
"severity": "info",
"value": "0",
"updatedAt": "2022-01-22T22:13:38Z"
},
{
"name": "service:restart-last-hour",
"description": "Service restart count in the last hour",
"health": "ok",
"severity": "info",
"value": "0",
"updatedAt": "2021-11-30T03:04:20Z"
},
{
"name": "service:startup-timestamp",
"description": "Service startup timestamp",
"health": "ok",
"severity": "info",
"value": "2022-01-22T22:13:27.484382666Z",
"updatedAt": "2022-01-22T22:13:38Z"
},
{
"name": "service:version",
"description": "Service version",
"health": "ok",
"severity": "info",
"value": "4.3.0~vanquish_master.2021_11_17_17_45_19.S5a9a5c6a",
"updatedAt": "2022-01-22T22:13:38Z"
}
]
}
},
{
"key": "appliance/services/system_TPOB",
"state": {
"name": "system_TPOB",
"health": "ok",
"severity": "info"
},
"attributes": {
"attribute": [
{
"name": "container:event:attach",
"description": "Container attach event",
"health": "ok",
"severity": "info",
"value": "0",
"updatedAt": "2021-09-24T20:42:30Z"
},
{
"name": "container:event:die",
"description": "Container die event",
"health": "ok",
"severity": "info",
"value": "0",
"updatedAt": "2022-01-15T06:01:01Z"
},
{
"name": "container:event:exec-create",
"description": "Container exec create event",
"health": "ok",
"severity": "info",
"value": "0",
"updatedAt": "2022-01-18T01:28:08Z"
},
{
"name": "container:event:exec-detach",
"description": "Container exec detach event",
"health": "ok",
"severity": "info",
"value": "0",
"updatedAt": "2021-09-24T20:42:30Z"
},
{
"name": "container:event:exec-die",
"description": "Container exec die event",
"health": "ok",
"severity": "info",
"value": "0",
"updatedAt": "2021-09-24T20:42:30Z"
},
{
"name": "container:event:exec-start",
"description": "Container exec start event",
"health": "ok",
"severity": "info",
"value": "0",
"updatedAt": "2022-01-18T01:28:08Z"
},
{
"name": "container:event:kill",
"description": "Container kill event",
"health": "ok",
"severity": "info",
"value": "0",
"updatedAt": "2022-01-22T22:10:38Z"
},
{
"name": "container:event:restart",
"description": "Container restart event",
"health": "ok",
"severity": "info",
"value": "0",
"updatedAt": "2022-01-22T22:13:38Z"
},
{
"name": "container:event:restart-last-hour",
"description": "Container restart count in the last hour",
"health": "ok",
"severity": "info",
"value": "0",
"updatedAt": "2021-09-24T20:42:30Z"
},
{
"name": "container:event:start",
"description": "Container start event",
"health": "ok",
"severity": "info",
"value": "0",
"updatedAt": "2021-09-24T20:42:30Z"
},
{
"name": "container:event:stop",
"description": "Container stop event",
"health": "ok",
"severity": "info",
"value": "0",
"updatedAt": "2022-01-15T06:01:01Z"
},
{
"name": "container:running",
"description": "Container running",
"health": "ok",
"severity": "info",
"value": "true",
"updatedAt": "2022-01-24T05:31:38Z"
}
]
}
},
{
"key": "appliance/services/system_api_svc_gateway",
"state": {
"name": "system_api_svc_gateway",
"health": "ok",
"severity": "info"
},
"attributes": {
"attribute": [
{
"name": "container:event:attach",
"description": "Container attach event",
"health": "ok",
"severity": "info",
"value": "0",
"updatedAt": "2021-09-24T20:42:30Z"
},
{
"name": "container:event:die",
"description": "Container die event",
"health": "ok",
"severity": "info",
"value": "0",
"updatedAt": "2022-01-22T22:10:39Z"
},
{
"name": "container:event:exec-create",
"description": "Container exec create event",
"health": "ok",
"severity": "info",
"value": "0",
"updatedAt": "2022-01-18T01:28:10Z"
},
{
"name": "container:event:exec-detach",
"description": "Container exec detach event",
"health": "ok",
"severity": "info",
"value": "0",
"updatedAt": "2021-09-24T20:42:30Z"
},
{
"name": "container:event:exec-die",
"description": "Container exec die event",
"health": "ok",
"severity": "info",
"value": "0",
"updatedAt": "2021-09-24T20:42:30Z"
},
{
"name": "container:event:exec-start",
"description": "Container exec start event",
"health": "ok",
"severity": "info",
"value": "0",
"updatedAt": "2022-01-18T01:28:10Z"
},
{
"name": "container:event:kill",
"description": "Container kill event",
"health": "ok",
"severity": "info",
"value": "0",
"updatedAt": "2022-01-22T22:10:38Z"
},
{
"name": "container:event:restart",
"description": "Container restart event",
"health": "ok",
"severity": "info",
"value": "0",
"updatedAt": "2022-01-22T22:13:38Z"
},
{
"name": "container:event:restart-last-hour",
"description": "Container restart count in the last hour",
"health": "ok",
"severity": "info",
"value": "0",
"updatedAt": "2021-09-24T20:42:30Z"
},
{
"name": "container:event:start",
"description": "Container start event",
"health": "ok",
"severity": "info",
"value": "0",
"updatedAt": "2021-09-24T20:42:30Z"
},
{
"name": "container:event:stop",
"description": "Container stop event",
"health": "ok",
"severity": "info",
"value": "0",
"updatedAt": "2022-01-15T06:01:01Z"
},
{
"name": "container:running",
"description": "Container running",
"health": "ok",
"severity": "info",
"value": "true",
"updatedAt": "2022-01-24T05:31:38Z"
},
{
"name": "service:component:version",
"description": "Service component version",
"health": "ok",
"severity": "info",
"value": "",
"updatedAt": "2021-09-24T20:42:30Z"
},
{
"name": "service:file-watcher-error",
"description": "Service file watcher error",
"health": "ok",
"severity": "info",
"value": "false",
"updatedAt": "2021-09-24T20:42:30Z"
},
{
"name": "service:message-error",
"description": "Service health monitor error",
"health": "ok",
"severity": "info",
"value": "",
"updatedAt": "2022-01-22T22:13:38Z"
},
{
"name": "service:message-error-count",
"description": "Service health monitor error count",
"health": "ok",
"severity": "info",
"value": "0",
"updatedAt": "2021-09-24T20:42:30Z"
},
{
"name": "service:overall-health",
"description": "Service reported overall health",
"health": "ok",
"severity": "info",
"value": "Ok",
"updatedAt": "2022-01-22T22:13:38Z"
},
{
"name": "service:ready",
"description": "Service ready status",
"health": "ok",
"severity": "info",
"value": "true",
"updatedAt": "2022-01-22T22:13:38Z"
},
{
"name": "service:restart-count",
"description": "Service total restart count",
"health": "ok",
"severity": "info",
"value": "0",
"updatedAt": "2022-01-22T22:13:38Z"
},
{
"name": "service:restart-last-hour",
"description": "Service restart count in the last hour",
"health": "ok",
"severity": "info",
"value": "0",
"updatedAt": "2021-09-24T20:42:30Z"
},
{
"name": "service:startup-timestamp",
"description": "Service startup timestamp",
"health": "ok",
"severity": "info",
"value": "2022-01-22T22:13:27.679595169Z",
"updatedAt": "2022-01-22T22:13:38Z"
},
{
"name": "service:version",
"description": "Service version",
"health": "ok",
"severity": "info",
"value": "4.6.0~vanquish_master.2021_11_15_09_08_18.S722a9889",
"updatedAt": "2022-01-22T22:13:38Z"
}
]
}
},
{
"key": "appliance/services/system_confgen",
"state": {
"name": "system_confgen",
"health": "ok",
"severity": "info"
},
"attributes": {
"attribute": [
{
"name": "container:event:attach",
"description": "Container attach event",
"health": "ok",
"severity": "info",
"value": "0",
"updatedAt": "2021-09-24T20:42:30Z"
},
{
"name": "container:event:die",
"description": "Container die event",
"health": "ok",
"severity": "info",
"value": "0",
"updatedAt": "2022-01-22T22:10:39Z"
},
{
"name": "container:event:exec-create",
"description": "Container exec create event",
"health": "ok",
"severity": "info",
"value": "0",
"updatedAt": "2022-01-18T01:30:24Z"
},
{
"name": "container:event:exec-detach",
"description": "Container exec detach event",
"health": "ok",
"severity": "info",
"value": "0",
"updatedAt": "2021-09-24T20:42:31Z"
},
{
"name": "container:event:exec-die",
"description": "Container exec die event",
"health": "ok",
"severity": "info",
"value": "0",
"updatedAt": "2021-09-24T20:42:31Z"
},
{
"name": "container:event:exec-start",
"description": "Container exec start event",
"health": "ok",
"severity": "info",
"value": "0",
"updatedAt": "2022-01-18T01:30:24Z"
},
{
"name": "container:event:kill",
"description": "Container kill event",
"health": "ok",
"severity": "info",
"value": "0",
"updatedAt": "2022-01-22T22:10:38Z"
},
{
"name": "container:event:restart",
"description": "Container restart event",
"health": "ok",
"severity": "info",
"value": "0",
"updatedAt": "2022-01-22T22:13:38Z"
},
{
"name": "container:event:restart-last-hour",
"description": "Container restart count in the last hour",
"health": "ok",
"severity": "info",
"value": "0",
"updatedAt": "2021-09-24T20:42:30Z"
},
{
"name": "container:event:start",
"description": "Container start event",
"health": "ok",
"severity": "info",
"value": "0",
"updatedAt": "2021-09-24T20:42:30Z"
},
{
"name": "container:event:stop",
"description": "Container stop event",
"health": "ok",
"severity": "info",
"value": "0",
"updatedAt": "2022-01-22T22:10:39Z"
},
{
"name": "container:running",
"description": "Container running",
"health": "ok",
"severity": "info",
"value": "true",
"updatedAt": "2022-01-24T05:31:38Z"
}
]
}
},
{
"key": "appliance/services/system_control",
"state": {
"name": "system_control",
"health": "ok",
"severity": "info"
},
"attributes": {
"attribute": [
{
"name": "container:event:attach",
"description": "Container attach event",
"health": "ok",
"severity": "info",
"value": "0",
"updatedAt": "2021-09-24T20:42:30Z"
},
{
"name": "container:event:die",
"description": "Container die event",
"health": "ok",
"severity": "info",
"value": "0",
"updatedAt": "2021-09-24T20:42:30Z"
},
{
"name": "container:event:exec-create",
"description": "Container exec create event",
"health": "ok",
"severity": "info",
"value": "0",
"updatedAt": "2022-01-18T01:28:30Z"
},
{
"name": "container:event:exec-detach",
"description": "Container exec detach event",
"health": "ok",
"severity": "info",
"value": "0",
"updatedAt": "2021-09-24T20:42:30Z"
},
{
"name": "container:event:exec-die",
"description": "Container exec die event",
"health": "ok",
"severity": "info",
"value": "0",
"updatedAt": "2021-09-24T20:42:30Z"
},
{
"name": "container:event:exec-start",
"description": "Container exec start event",
"health": "ok",
"severity": "info",
"value": "0",
"updatedAt": "2022-01-18T01:28:30Z"
},
{
"name": "container:event:kill",
"description": "Container kill event",
"health": "ok",
"severity": "info",
"value": "0",
"updatedAt": "2021-09-24T20:42:30Z"
},
{
"name": "container:event:restart",
"description": "Container restart event",
"health": "ok",
"severity": "info",
"value": "0",
"updatedAt": "2022-01-22T22:13:38Z"
},
{
"name": "container:event:restart-last-hour",
"description": "Container restart count in the last hour",
"health": "ok",
"severity": "info",
"value": "0",
"updatedAt": "2021-09-24T20:42:30Z"
},
{
"name": "container:event:start",
"description": "Container start event",
"health": "ok",
"severity": "info",
"value": "0",
"updatedAt": "2021-09-24T20:42:30Z"
},
{
"name": "container:event:stop",
"description": "Container stop event",
"health": "ok",
"severity": "info",
"value": "0",
"updatedAt": "2021-09-24T20:42:30Z"
},
{
"name": "container:running",
"description": "Container running",
"health": "ok",
"severity": "info",
"value": "true",
"updatedAt": "2022-01-24T05:31:38Z"
}
]
}
},
{
"key": "appliance/services/system_dagd",
"state": {
"name": "system_dagd",
"health": "ok",
"severity": "info"
},
"attributes": {
"attribute": [
{
"name": "container:event:attach",
"description": "Container attach event",
"health": "ok",
"severity": "info",
"value": "0",
"updatedAt": "2021-09-24T20:42:30Z"
},
{
"name": "container:event:die",
"description": "Container die event",
"health": "ok",
"severity": "info",
"value": "0",
"updatedAt": "2022-01-15T06:01:01Z"
},
{
"name": "container:event:exec-create",
"description": "Container exec create event",
"health": "ok",
"severity": "info",
"value": "0",
"updatedAt": "2022-01-18T01:27:44Z"
},
{
"name": "container:event:exec-detach",
"description": "Container exec detach event",
"health": "ok",
"severity": "info",
"value": "0",
"updatedAt": "2021-09-24T20:42:30Z"
},
{
"name": "container:event:exec-die",
"description": "Container exec die event",
"health": "ok",
"severity": "info",
"value": "0",
"updatedAt": "2021-09-24T20:42:30Z"
},
{
"name": "container:event:exec-start",
"description": "Container exec start event",
"health": "ok",
"severity": "info",
"value": "0",
"updatedAt": "2022-01-18T01:27:44Z"
},
{
"name": "container:event:kill",
"description": "Container kill event",
"health": "ok",
"severity": "info",
"value": "0",
"updatedAt": "2022-01-22T22:10:38Z"
},
{
"name": "container:event:restart",
"description": "Container restart event",
"health": "ok",
"severity": "info",
"value": "0",
"updatedAt": "2022-01-22T22:13:38Z"
},
{
"name": "container:event:restart-last-hour",
"description": "Container restart count in the last hour",
"health": "ok",
"severity": "info",
"value": "0",
"updatedAt": "2021-09-24T20:42:30Z"
},
{
"name": "container:event:start",
"description": "Container start event",
"health": "ok",
"severity": "info",
"value": "0",
"updatedAt": "2021-09-24T20:42:30Z"
},
{
"name": "container:event:stop",
"description": "Container stop event",
"health": "ok",
"severity": "info",
"value": "0",
"updatedAt": "2022-01-15T06:01:01Z"
},
{
"name": "container:running",
"description": "Container running",
"health": "ok",
"severity": "info",
"value": "true",
"updatedAt": "2022-01-24T05:31:38Z"
}
]
}
},
{
"key": "appliance/services/system_datapath_cp_proxy",
"state": {
"name": "system_datapath_cp_proxy",
"health": "ok",
"severity": "info"
},
"attributes": {
"attribute": [
{
"name": "container:event:attach",
"description": "Container attach event",
"health": "ok",
"severity": "info",
"value": "0",
"updatedAt": "2021-09-24T20:42:30Z"
},
{
"name": "container:event:die",
"description": "Container die event",
"health": "ok",
"severity": "info",
"value": "0",
"updatedAt": "2021-09-24T20:42:30Z"
},
{
"name": "container:event:exec-create",
"description": "Container exec create event",
"health": "ok",
"severity": "info",
"value": "0",
"updatedAt": "2022-01-18T01:28:34Z"
},
{
"name": "container:event:exec-detach",
"description": "Container exec detach event",
"health": "ok",
"severity": "info",
"value": "0",
"updatedAt": "2021-09-24T20:42:30Z"
},
{
"name": "container:event:exec-die",
"description": "Container exec die event",
"health": "ok",
"severity": "info",
"value": "0",
"updatedAt": "2021-09-24T20:42:30Z"
},
{
"name": "container:event:exec-start",
"description": "Container exec start event",
"health": "ok",
"severity": "info",
"value": "0",
"updatedAt": "2022-01-18T01:28:34Z"
},
{
"name": "container:event:kill",
"description": "Container kill event",
"health": "ok",
"severity": "info",
"value": "0",
"updatedAt": "2021-09-24T20:42:30Z"
},
{
"name": "container:event:restart",
"description": "Container restart event",
"health": "ok",
"severity": "info",
"value": "0",
"updatedAt": "2022-01-22T22:13:38Z"
},
{
"name": "container:event:restart-last-hour",
"description": "Container restart count in the last hour",
"health": "ok",
"severity": "info",
"value": "0",
"updatedAt": "2021-09-24T20:42:30Z"
},
{
"name": "container:event:start",
"description": "Container start event",
"health": "ok",
"severity": "info",
"value": "0",
"updatedAt": "2021-09-24T20:42:30Z"
},
{
"name": "container:event:stop",
"description": "Container stop event",
"health": "ok",
"severity": "info",
"value": "0",
"updatedAt": "2021-09-24T20:42:30Z"
},
{
"name": "container:running",
"description": "Container running",
"health": "ok",
"severity": "info",
"value": "true",
"updatedAt": "2022-01-24T05:31:38Z"
}
]
}
},
{
"key": "appliance/services/system_fpga",
"state": {
"name": "system_fpga",
"health": "ok",
"severity": "info"
},
"attributes": {
"attribute": [
{
"name": "container:event:attach",
"description": "Container attach event",
"health": "ok",
"severity": "info",
"value": "0",
"updatedAt": "2021-09-24T20:42:29Z"
},
{
"name": "container:event:die",
"description": "Container die event",
"health": "ok",
"severity": "info",
"value": "0",
"updatedAt": "2021-10-21T16:10:45Z"
},
{
"name": "container:event:exec-create",
"description": "Container exec create event",
"health": "ok",
"severity": "info",
"value": "0",
"updatedAt": "2022-01-18T19:58:46Z"
},
{
"name": "container:event:exec-detach",
"description": "Container exec detach event",
"health": "ok",
"severity": "info",
"value": "0",
"updatedAt": "2021-09-24T20:42:29Z"
},
{
"name": "container:event:exec-die",
"description": "Container exec die event",
"health": "ok",
"severity": "info",
"value": "0",
"updatedAt": "2021-09-24T20:42:29Z"
},
{
"name": "container:event:exec-start",
"description": "Container exec start event",
"health": "ok",
"severity": "info",
"value": "0",
"updatedAt": "2022-01-18T19:58:46Z"
},
{
"name": "container:event:kill",
"description": "Container kill event",
"health": "ok",
"severity": "info",
"value": "0",
"updatedAt": "2021-09-24T20:42:29Z"
},
{
"name": "container:event:restart",
"description": "Container restart event",
"health": "ok",
"severity": "info",
"value": "0",
"updatedAt": "2022-01-22T22:13:38Z"
},
{
"name": "container:event:restart-last-hour",
"description": "Container restart count in the last hour",
"health": "ok",
"severity": "info",
"value": "0",
"updatedAt": "2021-09-24T20:42:29Z"
},
{
"name": "container:event:start",
"description": "Container start event",
"health": "ok",
"severity": "info",
"value": "0",
"updatedAt": "2021-10-21T16:10:45Z"
},
{
"name": "container:event:stop",
"description": "Container stop event",
"health": "ok",
"severity": "info",
"value": "0",
"updatedAt": "2021-09-24T20:42:29Z"
},
{
"name": "container:running",
"description": "Container running",
"health": "ok",
"severity": "info",
"value": "true",
"updatedAt": "2022-01-24T05:31:38Z"
},
{
"name": "service:component:version",
"description": "Service component version",
"health": "ok",
"severity": "info",
"value": "",
"updatedAt": "2022-01-22T22:16:56Z"
},
{
"name": "service:message-error",
"description": "Service health monitor error",
"health": "ok",
"severity": "info",
"value": "",
"updatedAt": "2022-01-24T05:32:04Z"
},
{
"name": "service:message-error-count",
"description": "Service health monitor error count",
"health": "ok",
"severity": "info",
"value": "0",
"updatedAt": "2022-01-22T22:15:14Z"
},
{
"name": "service:overall-health",
"description": "Service reported overall health",
"health": "ok",
"severity": "info",
"value": "",
"updatedAt": "2021-09-24T20:42:29Z"
},
{
"name": "service:ready",
"description": "Service ready status",
"health": "ok",
"severity": "info",
"value": "true",
"updatedAt": "2022-01-24T05:32:04Z"
},
{
"name": "service:restart-count",
"description": "Service total restart count",
"health": "ok",
"severity": "info",
"value": "0",
"updatedAt": "2022-01-22T22:13:38Z"
},
{
"name": "service:restart-last-hour",
"description": "Service restart count in the last hour",
"health": "ok",
"severity": "info",
"value": "0",
"updatedAt": "2021-09-24T20:42:29Z"
},
{
"name": "service:startup-timestamp",
"description": "Service startup timestamp",
"health": "ok",
"severity": "info",
"value": "2022-01-22T22:13:27.545222779Z",
"updatedAt": "2022-01-24T05:32:04Z"
},
{
"name": "service:version",
"description": "Service version",
"health": "ok",
"severity": "info",
"value": "11.0.0~vanquish_master.2021_11_23_15_08_20.S5585f4c3",
"updatedAt": "2022-01-24T05:32:04Z"
}
]
}
},
{
"key": "appliance/services/system_fpga/asw",
"state": {
"name": "FPGA ASW",
"health": "ok",
"severity": "info"
}
},
{
"key": "appliance/services/system_fpga/atse/0",
"state": {
"name": "FPGA ATSE 0",
"health": "ok",
"severity": "info"
}
},
{
"key": "appliance/services/system_fpga/service",
"state": {
"name": "FPGA Mgr Service",
"health": "ok",
"severity": "info"
},
"attributes": {
"attribute": [
{
"name": "fpga-mgr:attached",
"description": "FPGA Mgr Attached State",
"health": "ok",
"severity": "info",
"value": "true",
"updatedAt": "2022-01-24T05:32:04Z"
},
{
"name": "fpga-mgr:ready",
"description": "FPGA Mgr Ready State",
"health": "ok",
"severity": "info",
"value": "1",
"updatedAt": "2022-01-24T05:32:04Z"
}
]
}
},
{
"key": "appliance/services/system_host_config",
"state": {
"name": "system_host_config",
"health": "ok",
"severity": "info"
},
"attributes": {
"attribute": [
{
"name": "container:event:attach",
"description": "Container attach event",
"health": "ok",
"severity": "info",
"value": "0",
"updatedAt": "2021-09-24T20:42:30Z"
},
{
"name": "container:event:die",
"description": "Container die event",
"health": "ok",
"severity": "info",
"value": "0",
"updatedAt": "2021-09-24T20:42:30Z"
},
{
"name": "container:event:exec-create",
"description": "Container exec create event",
"health": "ok",
"severity": "info",
"value": "0",
"updatedAt": "2022-01-18T01:28:18Z"
},
{
"name": "container:event:exec-detach",
"description": "Container exec detach event",
"health": "ok",
"severity": "info",
"value": "0",
"updatedAt": "2021-09-24T20:42:30Z"
},
{
"name": "container:event:exec-die",
"description": "Container exec die event",
"health": "ok",
"severity": "info",
"value": "0",
"updatedAt": "2021-09-24T20:42:30Z"
},
{
"name": "container:event:exec-start",
"description": "Container exec start event",
"health": "ok",
"severity": "info",
"value": "0",
"updatedAt": "2022-01-18T01:28:18Z"
},
{
"name": "container:event:kill",
"description": "Container kill event",
"health": "ok",
"severity": "info",
"value": "0",
"updatedAt": "2021-09-24T20:42:30Z"
},
{
"name": "container:event:restart",
"description": "Container restart event",
"health": "ok",
"severity": "info",
"value": "0",
"updatedAt": "2022-01-22T22:13:38Z"
},
{
"name": "container:event:restart-last-hour",
"description": "Container restart count in the last hour",
"health": "ok",
"severity": "info",
"value": "0",
"updatedAt": "2021-09-24T20:42:30Z"
},
{
"name": "container:event:start",
"description": "Container start event",
"health": "ok",
"severity": "info",
"value": "0",
"updatedAt": "2021-09-24T20:42:30Z"
},
{
"name": "container:event:stop",
"description": "Container stop event",
"health": "ok",
"severity": "info",
"value": "0",
"updatedAt": "2021-09-24T20:42:30Z"
},
{
"name": "container:running",
"description": "Container running",
"health": "ok",
"severity": "info",
"value": "true",
"updatedAt": "2022-01-24T05:31:38Z"
}
]
}
},
{
"key": "appliance/services/system_image_agent",
"state": {
"name": "system_image_agent",
"health": "ok",
"severity": "info"
},
"attributes": {
"attribute": [
{
"name": "container:event:attach",
"description": "Container attach event",
"health": "ok",
"severity": "info",
"value": "0",
"updatedAt": "2021-09-24T20:42:30Z"
},
{
"name": "container:event:die",
"description": "Container die event",
"health": "ok",
"severity": "info",
"value": "0",
"updatedAt": "2022-01-22T22:10:39Z"
},
{
"name": "container:event:exec-create",
"description": "Container exec create event",
"health": "ok",
"severity": "info",
"value": "0",
"updatedAt": "2022-01-18T01:28:12Z"
},
{
"name": "container:event:exec-detach",
"description": "Container exec detach event",
"health": "ok",
"severity": "info",
"value": "0",
"updatedAt": "2021-09-24T20:42:30Z"
},
{
"name": "container:event:exec-die",
"description": "Container exec die event",
"health": "ok",
"severity": "info",
"value": "0",
"updatedAt": "2021-09-24T20:42:30Z"
},
{
"name": "container:event:exec-start",
"description": "Container exec start event",
"health": "ok",
"severity": "info",
"value": "0",
"updatedAt": "2022-01-18T01:28:12Z"
},
{
"name": "container:event:kill",
"description": "Container kill event",
"health": "ok",
"severity": "info",
"value": "0",
"updatedAt": "2022-01-22T22:10:38Z"
},
{
"name": "container:event:restart",
"description": "Container restart event",
"health": "ok",
"severity": "info",
"value": "0",
"updatedAt": "2022-01-22T22:13:38Z"
},
{
"name": "container:event:restart-last-hour",
"description": "Container restart count in the last hour",
"health": "ok",
"severity": "info",
"value": "0",
"updatedAt": "2021-09-24T20:42:30Z"
},
{
"name": "container:event:start",
"description": "Container start event",
"health": "ok",
"severity": "info",
"value": "0",
"updatedAt": "2021-09-24T20:42:30Z"
},
{
"name": "container:event:stop",
"description": "Container stop event",
"health": "ok",
"severity": "info",
"value": "0",
"updatedAt": "2021-10-21T16:16:48Z"
},
{
"name": "container:running",
"description": "Container running",
"health": "ok",
"severity": "info",
"value": "true",
"updatedAt": "2022-01-24T05:31:38Z"
}
]
}
},
{
"key": "appliance/services/system_lacpd",
"state": {
"name": "system_lacpd",
"health": "ok",
"severity": "info"
},
"attributes": {
"attribute": [
{
"name": "container:event:attach",
"description": "Container attach event",
"health": "ok",
"severity": "info",
"value": "0",
"updatedAt": "2021-09-24T20:42:30Z"
},
{
"name": "container:event:die",
"description": "Container die event",
"health": "ok",
"severity": "info",
"value": "0",
"updatedAt": "2022-01-22T22:10:39Z"
},
{
"name": "container:event:exec-create",
"description": "Container exec create event",
"health": "ok",
"severity": "info",
"value": "0",
"updatedAt": "2022-01-18T01:29:20Z"
},
{
"name": "container:event:exec-detach",
"description": "Container exec detach event",
"health": "ok",
"severity": "info",
"value": "0",
"updatedAt": "2021-09-24T20:42:30Z"
},
{
"name": "container:event:exec-die",
"description": "Container exec die event",
"health": "ok",
"severity": "info",
"value": "0",
"updatedAt": "2021-09-24T20:42:30Z"
},
{
"name": "container:event:exec-start",
"description": "Container exec start event",
"health": "ok",
"severity": "info",
"value": "0",
"updatedAt": "2022-01-18T01:29:20Z"
},
{
"name": "container:event:kill",
"description": "Container kill event",
"health": "ok",
"severity": "info",
"value": "0",
"updatedAt": "2022-01-22T22:10:38Z"
},
{
"name": "container:event:restart",
"description": "Container restart event",
"health": "ok",
"severity": "info",
"value": "0",
"updatedAt": "2022-01-22T22:13:38Z"
},
{
"name": "container:event:restart-last-hour",
"description": "Container restart count in the last hour",
"health": "ok",
"severity": "info",
"value": "0",
"updatedAt": "2021-09-24T20:42:30Z"
},
{
"name": "container:event:start",
"description": "Container start event",
"health": "ok",
"severity": "info",
"value": "0",
"updatedAt": "2021-09-24T20:42:30Z"
},
{
"name": "container:event:stop",
"description": "Container stop event",
"health": "ok",
"severity": "info",
"value": "0",
"updatedAt": "2022-01-15T06:01:01Z"
},
{
"name": "container:running",
"description": "Container running",
"health": "ok",
"severity": "info",
"value": "true",
"updatedAt": "2022-01-24T05:31:38Z"
}
]
}
},
{
"key": "appliance/services/system_lacpd_proxy",
"state": {
"name": "system_lacpd_proxy",
"health": "ok",
"severity": "info"
},
"attributes": {
"attribute": [
{
"name": "container:event:attach",
"description": "Container attach event",
"health": "ok",
"severity": "info",
"value": "0",
"updatedAt": "2021-09-24T20:42:30Z"
},
{
"name": "container:event:die",
"description": "Container die event",
"health": "ok",
"severity": "info",
"value": "0",
"updatedAt": "2022-01-15T06:05:44Z"
},
{
"name": "container:event:exec-create",
"description": "Container exec create event",
"health": "ok",
"severity": "info",
"value": "0",
"updatedAt": "2022-01-18T01:30:00Z"
},
{
"name": "container:event:exec-detach",
"description": "Container exec detach event",
"health": "ok",
"severity": "info",
"value": "0",
"updatedAt": "2021-09-24T20:42:30Z"
},
{
"name": "container:event:exec-die",
"description": "Container exec die event",
"health": "ok",
"severity": "info",
"value": "0",
"updatedAt": "2021-09-24T20:42:30Z"
},
{
"name": "container:event:exec-start",
"description": "Container exec start event",
"health": "ok",
"severity": "info",
"value": "0",
"updatedAt": "2022-01-18T01:30:00Z"
},
{
"name": "container:event:kill",
"description": "Container kill event",
"health": "ok",
"severity": "info",
"value": "0",
"updatedAt": "2021-11-08T18:58:12Z"
},
{
"name": "container:event:restart",
"description": "Container restart event",
"health": "ok",
"severity": "info",
"value": "0",
"updatedAt": "2022-01-22T22:13:38Z"
},
{
"name": "container:event:restart-last-hour",
"description": "Container restart count in the last hour",
"health": "ok",
"severity": "info",
"value": "0",
"updatedAt": "2021-09-24T20:42:30Z"
},
{
"name": "container:event:start",
"description": "Container start event",
"health": "ok",
"severity": "info",
"value": "0",
"updatedAt": "2022-01-15T06:05:46Z"
},
{
"name": "container:event:stop",
"description": "Container stop event",
"health": "ok",
"severity": "info",
"value": "0",
"updatedAt": "2021-09-24T20:42:30Z"
},
{
"name": "container:running",
"description": "Container running",
"health": "ok",
"severity": "info",
"value": "true",
"updatedAt": "2022-01-24T05:31:38Z"
}
]
}
},
{
"key": "appliance/services/system_latest_vers",
"state": {
"name": "system_latest_vers",
"health": "ok",
"severity": "info"
},
"attributes": {
"attribute": [
{
"name": "container:event:attach",
"description": "Container attach event",
"health": "ok",
"severity": "info",
"value": "0",
"updatedAt": "2021-09-24T20:42:30Z"
},
{
"name": "container:event:die",
"description": "Container die event",
"health": "ok",
"severity": "info",
"value": "0",
"updatedAt": "2021-09-24T20:42:30Z"
},
{
"name": "container:event:exec-create",
"description": "Container exec create event",
"health": "ok",
"severity": "info",
"value": "0",
"updatedAt": "2022-01-18T01:30:22Z"
},
{
"name": "container:event:exec-detach",
"description": "Container exec detach event",
"health": "ok",
"severity": "info",
"value": "0",
"updatedAt": "2021-09-24T20:42:30Z"
},
{
"name": "container:event:exec-die",
"description": "Container exec die event",
"health": "ok",
"severity": "info",
"value": "0",
"updatedAt": "2021-09-24T20:42:30Z"
},
{
"name": "container:event:exec-start",
"description": "Container exec start event",
"health": "ok",
"severity": "info",
"value": "0",
"updatedAt": "2022-01-18T01:30:22Z"
},
{
"name": "container:event:kill",
"description": "Container kill event",
"health": "ok",
"severity": "info",
"value": "0",
"updatedAt": "2021-09-24T20:42:30Z"
},
{
"name": "container:event:restart",
"description": "Container restart event",
"health": "ok",
"severity": "info",
"value": "0",
"updatedAt": "2022-01-22T22:13:38Z"
},
{
"name": "container:event:restart-last-hour",
"description": "Container restart count in the last hour",
"health": "ok",
"severity": "info",
"value": "0",
"updatedAt": "2021-09-24T20:42:30Z"
},
{
"name": "container:event:start",
"description": "Container start event",
"health": "ok",
"severity": "info",
"value": "0",
"updatedAt": "2021-09-24T20:42:30Z"
},
{
"name": "container:event:stop",
"description": "Container stop event",
"health": "ok",
"severity": "info",
"value": "0",
"updatedAt": "2021-09-24T20:42:30Z"
},
{
"name": "container:running",
"description": "Container running",
"health": "ok",
"severity": "info",
"value": "true",
"updatedAt": "2022-01-24T05:31:38Z"
}
]
}
},
{
"key": "appliance/services/system_license_service",
"state": {
"name": "system_license_service",
"health": "ok",
"severity": "info"
},
"attributes": {
"attribute": [
{
"name": "container:event:attach",
"description": "Container attach event",
"health": "ok",
"severity": "info",
"value": "0",
"updatedAt": "2021-09-24T20:42:30Z"
},
{
"name": "container:event:die",
"description": "Container die event",
"health": "ok",
"severity": "info",
"value": "0",
"updatedAt": "2022-01-15T06:01:01Z"
},
{
"name": "container:event:exec-create",
"description": "Container exec create event",
"health": "ok",
"severity": "info",
"value": "0",
"updatedAt": "2022-01-18T01:27:58Z"
},
{
"name": "container:event:exec-detach",
"description": "Container exec detach event",
"health": "ok",
"severity": "info",
"value": "0",
"updatedAt": "2021-09-24T20:42:30Z"
},
{
"name": "container:event:exec-die",
"description": "Container exec die event",
"health": "ok",
"severity": "info",
"value": "0",
"updatedAt": "2021-09-24T20:42:30Z"
},
{
"name": "container:event:exec-start",
"description": "Container exec start event",
"health": "ok",
"severity": "info",
"value": "0",
"updatedAt": "2022-01-18T01:27:58Z"
},
{
"name": "container:event:kill",
"description": "Container kill event",
"health": "ok",
"severity": "info",
"value": "0",
"updatedAt": "2022-01-22T22:10:38Z"
},
{
"name": "container:event:restart",
"description": "Container restart event",
"health": "ok",
"severity": "info",
"value": "0",
"updatedAt": "2022-01-22T22:13:38Z"
},
{
"name": "container:event:restart-last-hour",
"description": "Container restart count in the last hour",
"health": "ok",
"severity": "info",
"value": "0",
"updatedAt": "2021-09-24T20:42:30Z"
},
{
"name": "container:event:start",
"description": "Container start event",
"health": "ok",
"severity": "info",
"value": "0",
"updatedAt": "2021-09-24T20:42:30Z"
},
{
"name": "container:event:stop",
"description": "Container stop event",
"health": "ok",
"severity": "info",
"value": "0",
"updatedAt": "2022-01-15T06:01:01Z"
},
{
"name": "container:running",
"description": "Container running",
"health": "ok",
"severity": "info",
"value": "true",
"updatedAt": "2022-01-24T05:31:38Z"
}
]
}
},
{
"key": "appliance/services/system_lldpd",
"state": {
"name": "system_lldpd",
"health": "ok",
"severity": "info"
},
"attributes": {
"attribute": [
{
"name": "container:event:attach",
"description": "Container attach event",
"health": "ok",
"severity": "info",
"value": "0",
"updatedAt": "2021-09-24T20:42:30Z"
},
{
"name": "container:event:die",
"description": "Container die event",
"health": "ok",
"severity": "info",
"value": "0",
"updatedAt": "2022-01-15T06:44:35Z"
},
{
"name": "container:event:exec-create",
"description": "Container exec create event",
"health": "ok",
"severity": "info",
"value": "0",
"updatedAt": "2022-01-18T01:27:48Z"
},
{
"name": "container:event:exec-detach",
"description": "Container exec detach event",
"health": "ok",
"severity": "info",
"value": "0",
"updatedAt": "2021-09-24T20:42:30Z"
},
{
"name": "container:event:exec-die",
"description": "Container exec die event",
"health": "ok",
"severity": "info",
"value": "0",
"updatedAt": "2021-09-24T20:42:30Z"
},
{
"name": "container:event:exec-start",
"description": "Container exec start event",
"health": "ok",
"severity": "info",
"value": "0",
"updatedAt": "2022-01-18T01:27:48Z"
},
{
"name": "container:event:kill",
"description": "Container kill event",
"health": "ok",
"severity": "info",
"value": "0",
"updatedAt": "2022-01-22T22:10:39Z"
},
{
"name": "container:event:restart",
"description": "Container restart event",
"health": "ok",
"severity": "info",
"value": "0",
"updatedAt": "2022-01-22T22:13:38Z"
},
{
"name": "container:event:restart-last-hour",
"description": "Container restart count in the last hour",
"health": "ok",
"severity": "info",
"value": "0",
"updatedAt": "2021-09-24T20:42:30Z"
},
{
"name": "container:event:start",
"description": "Container start event",
"health": "ok",
"severity": "info",
"value": "0",
"updatedAt": "2021-09-24T20:42:30Z"
},
{
"name": "container:event:stop",
"description": "Container stop event",
"health": "ok",
"severity": "info",
"value": "0",
"updatedAt": "2022-01-15T06:44:35Z"
},
{
"name": "container:running",
"description": "Container running",
"health": "ok",
"severity": "info",
"value": "true",
"updatedAt": "2022-01-24T05:31:38Z"
}
]
}
},
{
"key": "appliance/services/system_manager",
"state": {
"name": "system_manager",
"health": "ok",
"severity": "info"
},
"attributes": {
"attribute": [
{
"name": "container:event:attach",
"description": "Container attach event",
"health": "ok",
"severity": "info",
"value": "0",
"updatedAt": "2021-09-24T20:42:29Z"
},
{
"name": "container:event:die",
"description": "Container die event",
"health": "ok",
"severity": "info",
"value": "0",
"updatedAt": "2021-09-24T20:42:29Z"
},
{
"name": "container:event:exec-create",
"description": "Container exec create event",
"health": "ok",
"severity": "info",
"value": "0",
"updatedAt": "2022-01-18T01:29:06Z"
},
{
"name": "container:event:exec-detach",
"description": "Container exec detach event",
"health": "ok",
"severity": "info",
"value": "0",
"updatedAt": "2021-09-24T20:42:29Z"
},
{
"name": "container:event:exec-die",
"description": "Container exec die event",
"health": "ok",
"severity": "info",
"value": "0",
"updatedAt": "2021-09-24T20:42:29Z"
},
{
"name": "container:event:exec-start",
"description": "Container exec start event",
"health": "ok",
"severity": "info",
"value": "0",
"updatedAt": "2022-01-18T01:29:06Z"
},
{
"name": "container:event:kill",
"description": "Container kill event",
"health": "ok",
"severity": "info",
"value": "0",
"updatedAt": "2021-09-24T20:42:29Z"
},
{
"name": "container:event:restart",
"description": "Container restart event",
"health": "ok",
"severity": "info",
"value": "0",
"updatedAt": "2022-01-22T22:13:38Z"
},
{
"name": "container:event:restart-last-hour",
"description": "Container restart count in the last hour",
"health": "ok",
"severity": "info",
"value": "0",
"updatedAt": "2021-09-24T20:42:29Z"
},
{
"name": "container:event:start",
"description": "Container start event",
"health": "ok",
"severity": "info",
"value": "0",
"updatedAt": "2021-09-24T20:42:29Z"
},
{
"name": "container:event:stop",
"description": "Container stop event",
"health": "ok",
"severity": "info",
"value": "0",
"updatedAt": "2021-09-24T20:42:29Z"
},
{
"name": "container:running",
"description": "Container running",
"health": "ok",
"severity": "info",
"value": "true",
"updatedAt": "2022-01-24T05:31:38Z"
},
{
"name": "service:component:version",
"description": "Service component version",
"health": "ok",
"severity": "info",
"value": "",
"updatedAt": "2021-09-24T20:42:29Z"
},
{
"name": "service:file-watcher-error",
"description": "Service file watcher error",
"health": "ok",
"severity": "info",
"value": "false",
"updatedAt": "2021-09-24T20:42:29Z"
},
{
"name": "service:message-error",
"description": "Service health monitor error",
"health": "ok",
"severity": "info",
"value": "",
"updatedAt": "2022-01-22T22:13:38Z"
},
{
"name": "service:message-error-count",
"description": "Service health monitor error count",
"health": "ok",
"severity": "info",
"value": "0",
"updatedAt": "2021-09-24T20:42:29Z"
},
{
"name": "service:overall-health",
"description": "Service reported overall health",
"health": "ok",
"severity": "info",
"value": "Ok",
"updatedAt": "2022-01-22T22:13:38Z"
},
{
"name": "service:ready",
"description": "Service ready status",
"health": "ok",
"severity": "info",
"value": "true",
"updatedAt": "2022-01-22T22:13:38Z"
},
{
"name": "service:restart-count",
"description": "Service total restart count",
"health": "ok",
"severity": "info",
"value": "0",
"updatedAt": "2022-01-22T22:13:38Z"
},
{
"name": "service:restart-last-hour",
"description": "Service restart count in the last hour",
"health": "ok",
"severity": "info",
"value": "0",
"updatedAt": "2021-09-24T20:42:29Z"
},
{
"name": "service:startup-timestamp",
"description": "Service startup timestamp",
"health": "ok",
"severity": "info",
"value": "2022-01-22T22:13:14.598833746Z",
"updatedAt": "2022-01-22T22:13:38Z"
},
{
"name": "service:version",
"description": "Service version",
"health": "ok",
"severity": "info",
"value": "6.6.3",
"updatedAt": "2022-01-22T22:13:38Z"
}
]
}
},
{
"key": "appliance/services/system_network_manager",
"state": {
"name": "system_network_manager",
"health": "ok",
"severity": "info"
},
"attributes": {
"attribute": [
{
"name": "container:event:attach",
"description": "Container attach event",
"health": "ok",
"severity": "info",
"value": "0",
"updatedAt": "2021-09-24T20:42:30Z"
},
{
"name": "container:event:die",
"description": "Container die event",
"health": "ok",
"severity": "info",
"value": "0",
"updatedAt": "2022-01-22T22:10:39Z"
},
{
"name": "container:event:exec-create",
"description": "Container exec create event",
"health": "ok",
"severity": "info",
"value": "0",
"updatedAt": "2022-01-18T01:27:50Z"
},
{
"name": "container:event:exec-detach",
"description": "Container exec detach event",
"health": "ok",
"severity": "info",
"value": "0",
"updatedAt": "2021-09-24T20:42:30Z"
},
{
"name": "container:event:exec-die",
"description": "Container exec die event",
"health": "ok",
"severity": "info",
"value": "0",
"updatedAt": "2021-09-24T20:42:30Z"
},
{
"name": "container:event:exec-start",
"description": "Container exec start event",
"health": "ok",
"severity": "info",
"value": "0",
"updatedAt": "2022-01-18T01:27:50Z"
},
{
"name": "container:event:kill",
"description": "Container kill event",
"health": "ok",
"severity": "info",
"value": "0",
"updatedAt": "2022-01-22T22:10:38Z"
},
{
"name": "container:event:restart",
"description": "Container restart event",
"health": "ok",
"severity": "info",
"value": "0",
"updatedAt": "2022-01-22T22:13:38Z"
},
{
"name": "container:event:restart-last-hour",
"description": "Container restart count in the last hour",
"health": "ok",
"severity": "info",
"value": "0",
"updatedAt": "2021-09-24T20:42:30Z"
},
{
"name": "container:event:start",
"description": "Container start event",
"health": "ok",
"severity": "info",
"value": "0",
"updatedAt": "2021-09-24T20:42:30Z"
},
{
"name": "container:event:stop",
"description": "Container stop event",
"health": "ok",
"severity": "info",
"value": "0",
"updatedAt": "2022-01-15T06:01:01Z"
},
{
"name": "container:running",
"description": "Container running",
"health": "ok",
"severity": "info",
"value": "true",
"updatedAt": "2022-01-24T05:31:38Z"
}
]
}
},
{
"key": "appliance/services/system_platform-mgr",
"state": {
"name": "system_platform-mgr",
"health": "ok",
"severity": "info"
},
"attributes": {
"attribute": [
{
"name": "container:event:attach",
"description": "Container attach event",
"health": "ok",
"severity": "info",
"value": "0",
"updatedAt": "2021-09-24T20:42:30Z"
},
{
"name": "container:event:die",
"description": "Container die event",
"health": "ok",
"severity": "info",
"value": "0",
"updatedAt": "2022-01-22T22:10:39Z"
},
{
"name": "container:event:exec-create",
"description": "Container exec create event",
"health": "ok",
"severity": "info",
"value": "0",
"updatedAt": "2022-01-18T01:28:32Z"
},
{
"name": "container:event:exec-detach",
"description": "Container exec detach event",
"health": "ok",
"severity": "info",
"value": "0",
"updatedAt": "2021-09-24T20:42:30Z"
},
{
"name": "container:event:exec-die",
"description": "Container exec die event",
"health": "ok",
"severity": "info",
"value": "0",
"updatedAt": "2021-09-24T20:42:30Z"
},
{
"name": "container:event:exec-start",
"description": "Container exec start event",
"health": "ok",
"severity": "info",
"value": "0",
"updatedAt": "2022-01-18T01:28:32Z"
},
{
"name": "container:event:kill",
"description": "Container kill event",
"health": "ok",
"severity": "info",
"value": "0",
"updatedAt": "2022-01-22T22:10:38Z"
},
{
"name": "container:event:restart",
"description": "Container restart event",
"health": "ok",
"severity": "info",
"value": "0",
"updatedAt": "2022-01-22T22:13:38Z"
},
{
"name": "container:event:restart-last-hour",
"description": "Container restart count in the last hour",
"health": "ok",
"severity": "info",
"value": "0",
"updatedAt": "2021-09-24T20:42:30Z"
},
{
"name": "container:event:start",
"description": "Container start event",
"health": "ok",
"severity": "info",
"value": "0",
"updatedAt": "2021-09-24T20:42:30Z"
},
{
"name": "container:event:stop",
"description": "Container stop event",
"health": "ok",
"severity": "info",
"value": "0",
"updatedAt": "2022-01-22T22:10:39Z"
},
{
"name": "container:running",
"description": "Container running",
"health": "ok",
"severity": "info",
"value": "true",
"updatedAt": "2022-01-24T05:31:38Z"
}
]
}
},
{
"key": "appliance/services/system_platform-stats-bridge",
"state": {
"name": "system_platform-stats-bridge",
"health": "ok",
"severity": "info"
},
"attributes": {
"attribute": [
{
"name": "container:event:attach",
"description": "Container attach event",
"health": "ok",
"severity": "info",
"value": "0",
"updatedAt": "2021-09-24T20:42:30Z"
},
{
"name": "container:event:die",
"description": "Container die event",
"health": "ok",
"severity": "info",
"value": "0",
"updatedAt": "2022-01-15T06:01:01Z"
},
{
"name": "container:event:exec-create",
"description": "Container exec create event",
"health": "ok",
"severity": "info",
"value": "0",
"updatedAt": "2022-01-18T01:28:14Z"
},
{
"name": "container:event:exec-detach",
"description": "Container exec detach event",
"health": "ok",
"severity": "info",
"value": "0",
"updatedAt": "2021-09-24T20:42:30Z"
},
{
"name": "container:event:exec-die",
"description": "Container exec die event",
"health": "ok",
"severity": "info",
"value": "0",
"updatedAt": "2021-09-24T20:42:30Z"
},
{
"name": "container:event:exec-start",
"description": "Container exec start event",
"health": "ok",
"severity": "info",
"value": "0",
"updatedAt": "2022-01-18T01:28:14Z"
},
{
"name": "container:event:kill",
"description": "Container kill event",
"health": "ok",
"severity": "info",
"value": "0",
"updatedAt": "2022-01-22T22:10:39Z"
},
{
"name": "container:event:restart",
"description": "Container restart event",
"health": "ok",
"severity": "info",
"value": "0",
"updatedAt": "2022-01-22T22:13:38Z"
},
{
"name": "container:event:restart-last-hour",
"description": "Container restart count in the last hour",
"health": "ok",
"severity": "info",
"value": "0",
"updatedAt": "2021-09-24T20:42:30Z"
},
{
"name": "container:event:start",
"description": "Container start event",
"health": "ok",
"severity": "info",
"value": "0",
"updatedAt": "2021-09-24T20:42:30Z"
},
{
"name": "container:event:stop",
"description": "Container stop event",
"health": "ok",
"severity": "info",
"value": "0",
"updatedAt": "2022-01-15T06:01:01Z"
},
{
"name": "container:running",
"description": "Container running",
"health": "ok",
"severity": "info",
"value": "true",
"updatedAt": "2022-01-24T05:31:38Z"
}
]
}
},
{
"key": "appliance/services/system_rsyslogd",
"state": {
"name": "system_rsyslogd",
"health": "ok",
"severity": "info"
},
"attributes": {
"attribute": [
{
"name": "container:event:attach",
"description": "Container attach event",
"health": "ok",
"severity": "info",
"value": "0",
"updatedAt": "2021-09-24T20:42:30Z"
},
{
"name": "container:event:die",
"description": "Container die event",
"health": "ok",
"severity": "info",
"value": "0",
"updatedAt": "2021-09-24T20:42:30Z"
},
{
"name": "container:event:exec-create",
"description": "Container exec create event",
"health": "ok",
"severity": "info",
"value": "0",
"updatedAt": "2022-01-18T01:30:14Z"
},
{
"name": "container:event:exec-detach",
"description": "Container exec detach event",
"health": "ok",
"severity": "info",
"value": "0",
"updatedAt": "2021-09-24T20:42:30Z"
},
{
"name": "container:event:exec-die",
"description": "Container exec die event",
"health": "ok",
"severity": "info",
"value": "0",
"updatedAt": "2021-09-24T20:42:30Z"
},
{
"name": "container:event:exec-start",
"description": "Container exec start event",
"health": "ok",
"severity": "info",
"value": "0",
"updatedAt": "2022-01-18T01:30:14Z"
},
{
"name": "container:event:kill",
"description": "Container kill event",
"health": "ok",
"severity": "info",
"value": "0",
"updatedAt": "2021-09-24T20:42:30Z"
},
{
"name": "container:event:restart",
"description": "Container restart event",
"health": "ok",
"severity": "info",
"value": "0",
"updatedAt": "2022-01-22T22:13:38Z"
},
{
"name": "container:event:restart-last-hour",
"description": "Container restart count in the last hour",
"health": "ok",
"severity": "info",
"value": "0",
"updatedAt": "2021-09-24T20:42:30Z"
},
{
"name": "container:event:start",
"description": "Container start event",
"health": "ok",
"severity": "info",
"value": "0",
"updatedAt": "2021-09-24T20:42:30Z"
},
{
"name": "container:event:stop",
"description": "Container stop event",
"health": "ok",
"severity": "info",
"value": "0",
"updatedAt": "2021-09-24T20:42:30Z"
},
{
"name": "container:running",
"description": "Container running",
"health": "ok",
"severity": "info",
"value": "true",
"updatedAt": "2022-01-24T05:31:38Z"
}
]
}
},
{
"key": "appliance/services/system_stpd",
"state": {
"name": "system_stpd",
"health": "ok",
"severity": "info"
},
"attributes": {
"attribute": [
{
"name": "container:event:attach",
"description": "Container attach event",
"health": "ok",
"severity": "info",
"value": "0",
"updatedAt": "2021-09-24T20:42:30Z"
},
{
"name": "container:event:die",
"description": "Container die event",
"health": "ok",
"severity": "info",
"value": "0",
"updatedAt": "2022-01-15T06:01:01Z"
},
{
"name": "container:event:exec-create",
"description": "Container exec create event",
"health": "ok",
"severity": "info",
"value": "0",
"updatedAt": "2022-01-18T01:28:26Z"
},
{
"name": "container:event:exec-detach",
"description": "Container exec detach event",
"health": "ok",
"severity": "info",
"value": "0",
"updatedAt": "2021-09-24T20:42:30Z"
},
{
"name": "container:event:exec-die",
"description": "Container exec die event",
"health": "ok",
"severity": "info",
"value": "0",
"updatedAt": "2021-09-24T20:42:30Z"
},
{
"name": "container:event:exec-start",
"description": "Container exec start event",
"health": "ok",
"severity": "info",
"value": "0",
"updatedAt": "2022-01-18T01:28:26Z"
},
{
"name": "container:event:kill",
"description": "Container kill event",
"health": "ok",
"severity": "info",
"value": "0",
"updatedAt": "2022-01-22T22:10:38Z"
},
{
"name": "container:event:restart",
"description": "Container restart event",
"health": "ok",
"severity": "info",
"value": "0",
"updatedAt": "2022-01-22T22:13:38Z"
},
{
"name": "container:event:restart-last-hour",
"description": "Container restart count in the last hour",
"health": "ok",
"severity": "info",
"value": "0",
"updatedAt": "2021-09-24T20:42:30Z"
},
{
"name": "container:event:start",
"description": "Container start event",
"health": "ok",
"severity": "info",
"value": "0",
"updatedAt": "2021-09-24T20:42:30Z"
},
{
"name": "container:event:stop",
"description": "Container stop event",
"health": "ok",
"severity": "info",
"value": "0",
"updatedAt": "2022-01-15T06:01:01Z"
},
{
"name": "container:running",
"description": "Container running",
"health": "ok",
"severity": "info",
"value": "true",
"updatedAt": "2022-01-24T05:31:38Z"
}
]
}
},
{
"key": "appliance/services/system_sw_rbcast",
"state": {
"name": "system_sw_rbcast",
"health": "ok",
"severity": "info"
},
"attributes": {
"attribute": [
{
"name": "container:event:attach",
"description": "Container attach event",
"health": "ok",
"severity": "info",
"value": "0",
"updatedAt": "2021-09-24T20:42:30Z"
},
{
"name": "container:event:die",
"description": "Container die event",
"health": "ok",
"severity": "info",
"value": "0",
"updatedAt": "2022-01-22T22:10:39Z"
},
{
"name": "container:event:exec-create",
"description": "Container exec create event",
"health": "ok",
"severity": "info",
"value": "0",
"updatedAt": "2022-01-18T01:28:28Z"
},
{
"name": "container:event:exec-detach",
"description": "Container exec detach event",
"health": "ok",
"severity": "info",
"value": "0",
"updatedAt": "2021-09-24T20:42:30Z"
},
{
"name": "container:event:exec-die",
"description": "Container exec die event",
"health": "ok",
"severity": "info",
"value": "0",
"updatedAt": "2021-09-24T20:42:30Z"
},
{
"name": "container:event:exec-start",
"description": "Container exec start event",
"health": "ok",
"severity": "info",
"value": "0",
"updatedAt": "2022-01-18T01:28:28Z"
},
{
"name": "container:event:kill",
"description": "Container kill event",
"health": "ok",
"severity": "info",
"value": "0",
"updatedAt": "2022-01-22T22:10:38Z"
},
{
"name": "container:event:restart",
"description": "Container restart event",
"health": "ok",
"severity": "info",
"value": "0",
"updatedAt": "2022-01-22T22:13:38Z"
},
{
"name": "container:event:restart-last-hour",
"description": "Container restart count in the last hour",
"health": "ok",
"severity": "info",
"value": "0",
"updatedAt": "2021-09-24T20:42:30Z"
},
{
"name": "container:event:start",
"description": "Container start event",
"health": "ok",
"severity": "info",
"value": "0",
"updatedAt": "2021-09-24T20:42:30Z"
},
{
"name": "container:event:stop",
"description": "Container stop event",
"health": "ok",
"severity": "info",
"value": "0",
"updatedAt": "2022-01-15T06:01:01Z"
},
{
"name": "container:running",
"description": "Container running",
"health": "ok",
"severity": "info",
"value": "true",
"updatedAt": "2022-01-24T05:31:38Z"
}
]
}
},
{
"key": "appliance/services/system_tmstat_merged",
"state": {
"name": "system_tmstat_merged",
"health": "ok",
"severity": "info"
},
"attributes": {
"attribute": [
{
"name": "container:event:attach",
"description": "Container attach event",
"health": "ok",
"severity": "info",
"value": "0",
"updatedAt": "2021-09-24T20:42:30Z"
},
{
"name": "container:event:die",
"description": "Container die event",
"health": "ok",
"severity": "info",
"value": "0",
"updatedAt": "2022-01-15T06:44:35Z"
},
{
"name": "container:event:exec-create",
"description": "Container exec create event",
"health": "ok",
"severity": "info",
"value": "0",
"updatedAt": "2022-01-18T01:30:06Z"
},
{
"name": "container:event:exec-detach",
"description": "Container exec detach event",
"health": "ok",
"severity": "info",
"value": "0",
"updatedAt": "2021-09-24T20:42:30Z"
},
{
"name": "container:event:exec-die",
"description": "Container exec die event",
"health": "ok",
"severity": "info",
"value": "0",
"updatedAt": "2021-09-24T20:42:30Z"
},
{
"name": "container:event:exec-start",
"description": "Container exec start event",
"health": "ok",
"severity": "info",
"value": "0",
"updatedAt": "2022-01-18T01:30:06Z"
},
{
"name": "container:event:kill",
"description": "Container kill event",
"health": "ok",
"severity": "info",
"value": "0",
"updatedAt": "2022-01-22T22:10:39Z"
},
{
"name": "container:event:restart",
"description": "Container restart event",
"health": "ok",
"severity": "info",
"value": "0",
"updatedAt": "2022-01-22T22:13:38Z"
},
{
"name": "container:event:restart-last-hour",
"description": "Container restart count in the last hour",
"health": "ok",
"severity": "info",
"value": "0",
"updatedAt": "2021-09-24T20:42:30Z"
},
{
"name": "container:event:start",
"description": "Container start event",
"health": "ok",
"severity": "info",
"value": "0",
"updatedAt": "2021-09-24T20:42:30Z"
},
{
"name": "container:event:stop",
"description": "Container stop event",
"health": "ok",
"severity": "info",
"value": "0",
"updatedAt": "2021-09-24T20:42:30Z"
},
{
"name": "container:running",
"description": "Container running",
"health": "ok",
"severity": "info",
"value": "true",
"updatedAt": "2022-01-24T05:31:38Z"
}
]
}
},
{
"key": "appliance/services/system_tmstat_zmq",
"state": {
"name": "system_tmstat_zmq",
"health": "ok",
"severity": "info"
},
"attributes": {
"attribute": [
{
"name": "container:event:attach",
"description": "Container attach event",
"health": "ok",
"severity": "info",
"value": "0",
"updatedAt": "2021-09-24T20:42:29Z"
},
{
"name": "container:event:die",
"description": "Container die event",
"health": "ok",
"severity": "info",
"value": "0",
"updatedAt": "2022-01-15T06:01:01Z"
},
{
"name": "container:event:exec-create",
"description": "Container exec create event",
"health": "ok",
"severity": "info",
"value": "0",
"updatedAt": "2022-01-18T01:29:56Z"
},
{
"name": "container:event:exec-detach",
"description": "Container exec detach event",
"health": "ok",
"severity": "info",
"value": "0",
"updatedAt": "2021-09-24T20:42:29Z"
},
{
"name": "container:event:exec-die",
"description": "Container exec die event",
"health": "ok",
"severity": "info",
"value": "0",
"updatedAt": "2021-09-24T20:42:29Z"
},
{
"name": "container:event:exec-start",
"description": "Container exec start event",
"health": "ok",
"severity": "info",
"value": "0",
"updatedAt": "2022-01-18T01:29:56Z"
},
{
"name": "container:event:kill",
"description": "Container kill event",
"health": "ok",
"severity": "info",
"value": "0",
"updatedAt": "2022-01-22T22:10:39Z"
},
{
"name": "container:event:restart",
"description": "Container restart event",
"health": "ok",
"severity": "info",
"value": "0",
"updatedAt": "2022-01-22T22:13:38Z"
},
{
"name": "container:event:restart-last-hour",
"description": "Container restart count in the last hour",
"health": "ok",
"severity": "info",
"value": "0",
"updatedAt": "2021-09-24T20:42:29Z"
},
{
"name": "container:event:start",
"description": "Container start event",
"health": "ok",
"severity": "info",
"value": "0",
"updatedAt": "2021-09-24T20:42:29Z"
},
{
"name": "container:event:stop",
"description": "Container stop event",
"health": "ok",
"severity": "info",
"value": "0",
"updatedAt": "2022-01-15T06:01:01Z"
},
{
"name": "container:running",
"description": "Container running",
"health": "ok",
"severity": "info",
"value": "true",
"updatedAt": "2022-01-24T05:31:38Z"
},
{
"name": "service:component:version",
"description": "Service component version",
"health": "ok",
"severity": "info",
"value": "",
"updatedAt": "2021-09-24T20:42:29Z"
},
{
"name": "service:file-watcher-error",
"description": "Service file watcher error",
"health": "ok",
"severity": "info",
"value": "false",
"updatedAt": "2021-09-24T20:42:29Z"
},
{
"name": "service:message-error",
"description": "Service health monitor error",
"health": "ok",
"severity": "info",
"value": "",
"updatedAt": "2022-01-22T22:13:38Z"
},
{
"name": "service:message-error-count",
"description": "Service health monitor error count",
"health": "ok",
"severity": "info",
"value": "0",
"updatedAt": "2021-09-24T20:42:29Z"
},
{
"name": "service:overall-health",
"description": "Service reported overall health",
"health": "ok",
"severity": "info",
"value": "Ok",
"updatedAt": "2022-01-22T22:13:38Z"
},
{
"name": "service:ready",
"description": "Service ready status",
"health": "ok",
"severity": "info",
"value": "true",
"updatedAt": "2022-01-22T22:13:38Z"
},
{
"name": "service:restart-count",
"description": "Service total restart count",
"health": "ok",
"severity": "info",
"value": "0",
"updatedAt": "2022-01-22T22:13:38Z"
},
{
"name": "service:restart-last-hour",
"description": "Service restart count in the last hour",
"health": "ok",
"severity": "info",
"value": "0",
"updatedAt": "2021-09-24T20:42:29Z"
},
{
"name": "service:startup-timestamp",
"description": "Service startup timestamp",
"health": "ok",
"severity": "info",
"value": "2022-01-22T22:13:14.377584638Z",
"updatedAt": "2022-01-22T22:13:38Z"
},
{
"name": "service:version",
"description": "Service version",
"health": "ok",
"severity": "info",
"value": "1.17.3",
"updatedAt": "2022-01-22T22:13:38Z"
}
]
}
},
{
"key": "appliance/services/system_user_manager",
"state": {
"name": "system_user_manager",
"health": "ok",
"severity": "info"
},
"attributes": {
"attribute": [
{
"name": "container:event:attach",
"description": "Container attach event",
"health": "ok",
"severity": "info",
"value": "0",
"updatedAt": "2021-09-24T20:42:30Z"
},
{
"name": "container:event:die",
"description": "Container die event",
"health": "ok",
"severity": "info",
"value": "0",
"updatedAt": "2021-09-24T20:42:30Z"
},
{
"name": "container:event:exec-create",
"description": "Container exec create event",
"health": "ok",
"severity": "info",
"value": "0",
"updatedAt": "2022-01-18T01:27:56Z"
},
{
"name": "container:event:exec-detach",
"description": "Container exec detach event",
"health": "ok",
"severity": "info",
"value": "0",
"updatedAt": "2021-09-24T20:42:30Z"
},
{
"name": "container:event:exec-die",
"description": "Container exec die event",
"health": "ok",
"severity": "info",
"value": "0",
"updatedAt": "2021-09-24T20:42:30Z"
},
{
"name": "container:event:exec-start",
"description": "Container exec start event",
"health": "ok",
"severity": "info",
"value": "0",
"updatedAt": "2022-01-18T01:27:56Z"
},
{
"name": "container:event:kill",
"description": "Container kill event",
"health": "ok",
"severity": "info",
"value": "0",
"updatedAt": "2021-09-24T20:42:30Z"
},
{
"name": "container:event:restart",
"description": "Container restart event",
"health": "ok",
"severity": "info",
"value": "0",
"updatedAt": "2022-01-22T22:13:38Z"
},
{
"name": "container:event:restart-last-hour",
"description": "Container restart count in the last hour",
"health": "ok",
"severity": "info",
"value": "0",
"updatedAt": "2021-09-24T20:42:30Z"
},
{
"name": "container:event:start",
"description": "Container start event",
"health": "ok",
"severity": "info",
"value": "0",
"updatedAt": "2021-09-24T20:42:30Z"
},
{
"name": "container:event:stop",
"description": "Container stop event",
"health": "ok",
"severity": "info",
"value": "0",
"updatedAt": "2021-09-24T20:42:30Z"
},
{
"name": "container:running",
"description": "Container running",
"health": "ok",
"severity": "info",
"value": "true",
"updatedAt": "2022-01-24T05:31:38Z"
},
{
"name": "service:component:version",
"description": "Service component version",
"health": "ok",
"severity": "info",
"value": "",
"updatedAt": "2021-09-24T20:42:30Z"
},
{
"name": "service:file-watcher-error",
"description": "Service file watcher error",
"health": "ok",
"severity": "info",
"value": "false",
"updatedAt": "2021-09-24T20:42:30Z"
},
{
"name": "service:message-error",
"description": "Service health monitor error",
"health": "ok",
"severity": "info",
"value": "",
"updatedAt": "2022-01-22T22:13:38Z"
},
{
"name": "service:message-error-count",
"description": "Service health monitor error count",
"health": "ok",
"severity": "info",
"value": "0",
"updatedAt": "2021-09-24T20:42:30Z"
},
{
"name": "service:overall-health",
"description": "Service reported overall health",
"health": "ok",
"severity": "info",
"value": "Ok",
"updatedAt": "2022-01-22T22:13:39Z"
},
{
"name": "service:ready",
"description": "Service ready status",
"health": "ok",
"severity": "info",
"value": "true",
"updatedAt": "2022-01-22T22:13:38Z"
},
{
"name": "service:restart-count",
"description": "Service total restart count",
"health": "ok",
"severity": "info",
"value": "0",
"updatedAt": "2022-01-22T22:13:38Z"
},
{
"name": "service:restart-last-hour",
"description": "Service restart count in the last hour",
"health": "ok",
"severity": "info",
"value": "0",
"updatedAt": "2021-11-30T03:04:20Z"
},
{
"name": "service:startup-timestamp",
"description": "Service startup timestamp",
"health": "ok",
"severity": "info",
"value": "2022-01-22T22:13:26.86219364Z",
"updatedAt": "2022-01-22T22:13:39Z"
},
{
"name": "service:version",
"description": "Service version",
"health": "ok",
"severity": "info",
"value": "1.1.21~prerelease_van_hyd_dev.2021_10_29_05_14_21.Sde68096e",
"updatedAt": "2022-01-22T22:13:38Z"
}
]
}
},
{
"key": "appliance/services/system_velocity_rsyslogd",
"state": {
"name": "system_velocity_rsyslogd",
"health": "ok",
"severity": "info"
},
"attributes": {
"attribute": [
{
"name": "container:event:attach",
"description": "Container attach event",
"health": "ok",
"severity": "info",
"value": "0",
"updatedAt": "2021-09-24T20:42:30Z"
},
{
"name": "container:event:die",
"description": "Container die event",
"health": "ok",
"severity": "info",
"value": "0",
"updatedAt": "2022-01-15T06:01:01Z"
},
{
"name": "container:event:exec-create",
"description": "Container exec create event",
"health": "ok",
"severity": "info",
"value": "0",
"updatedAt": "2022-01-18T01:28:00Z"
},
{
"name": "container:event:exec-detach",
"description": "Container exec detach event",
"health": "ok",
"severity": "info",
"value": "0",
"updatedAt": "2021-09-24T20:42:30Z"
},
{
"name": "container:event:exec-die",
"description": "Container exec die event",
"health": "ok",
"severity": "info",
"value": "0",
"updatedAt": "2021-09-24T20:42:30Z"
},
{
"name": "container:event:exec-start",
"description": "Container exec start event",
"health": "ok",
"severity": "info",
"value": "0",
"updatedAt": "2022-01-18T01:28:00Z"
},
{
"name": "container:event:kill",
"description": "Container kill event",
"health": "ok",
"severity": "info",
"value": "0",
"updatedAt": "2022-01-22T22:10:39Z"
},
{
"name": "container:event:restart",
"description": "Container restart event",
"health": "ok",
"severity": "info",
"value": "0",
"updatedAt": "2022-01-22T22:13:38Z"
},
{
"name": "container:event:restart-last-hour",
"description": "Container restart count in the last hour",
"health": "ok",
"severity": "info",
"value": "0",
"updatedAt": "2021-09-24T20:42:30Z"
},
{
"name": "container:event:start",
"description": "Container start event",
"health": "ok",
"severity": "info",
"value": "0",
"updatedAt": "2021-09-24T20:42:30Z"
},
{
"name": "container:event:stop",
"description": "Container stop event",
"health": "ok",
"severity": "info",
"value": "0",
"updatedAt": "2022-01-15T06:01:01Z"
},
{
"name": "container:running",
"description": "Container running",
"health": "ok",
"severity": "info",
"value": "true",
"updatedAt": "2022-01-24T05:31:38Z"
}
]
}
},
{
"key": "appliance/services/tcpdumpd_manager",
"state": {
"name": "tcpdumpd_manager",
"health": "ok",
"severity": "info"
},
"attributes": {
"attribute": [
{
"name": "container:event:attach",
"description": "Container attach event",
"health": "ok",
"severity": "info",
"value": "0",
"updatedAt": "2021-10-18T20:53:44Z"
},
{
"name": "container:event:die",
"description": "Container die event",
"health": "ok",
"severity": "info",
"value": "0",
"updatedAt": "2021-10-18T20:53:44Z"
},
{
"name": "container:event:exec-create",
"description": "Container exec create event",
"health": "ok",
"severity": "info",
"value": "0",
"updatedAt": "2022-01-18T01:28:36Z"
},
{
"name": "container:event:exec-detach",
"description": "Container exec detach event",
"health": "ok",
"severity": "info",
"value": "0",
"updatedAt": "2021-10-18T20:53:44Z"
},
{
"name": "container:event:exec-die",
"description": "Container exec die event",
"health": "ok",
"severity": "info",
"value": "0",
"updatedAt": "2021-10-18T20:53:44Z"
},
{
"name": "container:event:exec-start",
"description": "Container exec start event",
"health": "ok",
"severity": "info",
"value": "0",
"updatedAt": "2022-01-18T01:28:36Z"
},
{
"name": "container:event:kill",
"description": "Container kill event",
"health": "ok",
"severity": "info",
"value": "0",
"updatedAt": "2022-01-22T22:10:38Z"
},
{
"name": "container:event:restart",
"description": "Container restart event",
"health": "ok",
"severity": "info",
"value": "0",
"updatedAt": "2022-01-22T22:13:38Z"
},
{
"name": "container:event:restart-last-hour",
"description": "Container restart count in the last hour",
"health": "ok",
"severity": "info",
"value": "0",
"updatedAt": "2021-10-18T20:53:44Z"
},
{
"name": "container:event:start",
"description": "Container start event",
"health": "ok",
"severity": "info",
"value": "0",
"updatedAt": "2021-10-18T20:53:44Z"
},
{
"name": "container:event:stop",
"description": "Container stop event",
"health": "ok",
"severity": "info",
"value": "0",
"updatedAt": "2021-10-18T20:53:44Z"
},
{
"name": "container:running",
"description": "Container running",
"health": "ok",
"severity": "info",
"value": "true",
"updatedAt": "2022-01-24T05:31:38Z"
}
]
}
},
{
"key": "appliance/services/upgrade-service",
"state": {
"name": "upgrade-service",
"health": "ok",
"severity": "info"
},
"attributes": {
"attribute": [
{
"name": "container:event:attach",
"description": "Container attach event",
"health": "ok",
"severity": "info",
"value": "0",
"updatedAt": "2021-09-24T20:42:30Z"
},
{
"name": "container:event:die",
"description": "Container die event",
"health": "ok",
"severity": "info",
"value": "0",
"updatedAt": "2022-01-15T06:01:01Z"
},
{
"name": "container:event:exec-create",
"description": "Container exec create event",
"health": "ok",
"severity": "info",
"value": "0",
"updatedAt": "2022-01-18T01:29:10Z"
},
{
"name": "container:event:exec-detach",
"description": "Container exec detach event",
"health": "ok",
"severity": "info",
"value": "0",
"updatedAt": "2021-09-24T20:42:30Z"
},
{
"name": "container:event:exec-die",
"description": "Container exec die event",
"health": "ok",
"severity": "info",
"value": "0",
"updatedAt": "2021-09-24T20:42:30Z"
},
{
"name": "container:event:exec-start",
"description": "Container exec start event",
"health": "ok",
"severity": "info",
"value": "0",
"updatedAt": "2022-01-18T01:29:10Z"
},
{
"name": "container:event:kill",
"description": "Container kill event",
"health": "ok",
"severity": "info",
"value": "0",
"updatedAt": "2022-01-22T22:10:38Z"
},
{
"name": "container:event:restart",
"description": "Container restart event",
"health": "ok",
"severity": "info",
"value": "0",
"updatedAt": "2022-01-22T22:13:38Z"
},
{
"name": "container:event:restart-last-hour",
"description": "Container restart count in the last hour",
"health": "ok",
"severity": "info",
"value": "0",
"updatedAt": "2021-09-24T20:42:30Z"
},
{
"name": "container:event:start",
"description": "Container start event",
"health": "ok",
"severity": "info",
"value": "0",
"updatedAt": "2021-09-24T20:42:30Z"
},
{
"name": "container:event:stop",
"description": "Container stop event",
"health": "ok",
"severity": "info",
"value": "0",
"updatedAt": "2022-01-15T06:01:01Z"
},
{
"name": "container:running",
"description": "Container running",
"health": "ok",
"severity": "info",
"value": "true",
"updatedAt": "2022-01-24T05:31:38Z"
}
]
}
},
{
"key": "appliance/services/utils-agent",
"state": {
"name": "utils-agent",
"health": "ok",
"severity": "info"
},
"attributes": {
"attribute": [
{
"name": "container:event:attach",
"description": "Container attach event",
"health": "ok",
"severity": "info",
"value": "0",
"updatedAt": "2021-09-24T20:42:30Z"
},
{
"name": "container:event:die",
"description": "Container die event",
"health": "ok",
"severity": "info",
"value": "0",
"updatedAt": "2021-09-24T20:42:30Z"
},
{
"name": "container:event:exec-create",
"description": "Container exec create event",
"health": "ok",
"severity": "info",
"value": "0",
"updatedAt": "2022-01-18T01:29:58Z"
},
{
"name": "container:event:exec-detach",
"description": "Container exec detach event",
"health": "ok",
"severity": "info",
"value": "0",
"updatedAt": "2021-09-24T20:42:30Z"
},
{
"name": "container:event:exec-die",
"description": "Container exec die event",
"health": "ok",
"severity": "info",
"value": "0",
"updatedAt": "2021-09-24T20:42:30Z"
},
{
"name": "container:event:exec-start",
"description": "Container exec start event",
"health": "ok",
"severity": "info",
"value": "0",
"updatedAt": "2022-01-18T01:29:58Z"
},
{
"name": "container:event:kill",
"description": "Container kill event",
"health": "ok",
"severity": "info",
"value": "0",
"updatedAt": "2022-01-22T22:10:38Z"
},
{
"name": "container:event:restart",
"description": "Container restart event",
"health": "ok",
"severity": "info",
"value": "0",
"updatedAt": "2022-01-22T22:13:38Z"
},
{
"name": "container:event:restart-last-hour",
"description": "Container restart count in the last hour",
"health": "ok",
"severity": "info",
"value": "0",
"updatedAt": "2021-09-24T20:42:30Z"
},
{
"name": "container:event:start",
"description": "Container start event",
"health": "ok",
"severity": "info",
"value": "0",
"updatedAt": "2021-09-24T20:42:30Z"
},
{
"name": "container:event:stop",
"description": "Container stop event",
"health": "ok",
"severity": "info",
"value": "0",
"updatedAt": "2021-09-24T20:42:30Z"
},
{
"name": "container:running",
"description": "Container running",
"health": "ok",
"severity": "info",
"value": "true",
"updatedAt": "2022-01-24T05:31:38Z"
}
]
}
},
{
"key": "appliance/services/vanquish-webUI",
"state": {
"name": "vanquish-webUI",
"health": "ok",
"severity": "info"
},
"attributes": {
"attribute": [
{
"name": "container:event:attach",
"description": "Container attach event",
"health": "ok",
"severity": "info",
"value": "0",
"updatedAt": "2021-09-24T20:42:30Z"
},
{
"name": "container:event:die",
"description": "Container die event",
"health": "ok",
"severity": "info",
"value": "0",
"updatedAt": "2021-09-24T20:42:30Z"
},
{
"name": "container:event:exec-create",
"description": "Container exec create event",
"health": "ok",
"severity": "info",
"value": "0",
"updatedAt": "2022-01-18T01:30:28Z"
},
{
"name": "container:event:exec-detach",
"description": "Container exec detach event",
"health": "ok",
"severity": "info",
"value": "0",
"updatedAt": "2021-09-24T20:42:30Z"
},
{
"name": "container:event:exec-die",
"description": "Container exec die event",
"health": "ok",
"severity": "info",
"value": "0",
"updatedAt": "2021-09-24T20:42:30Z"
},
{
"name": "container:event:exec-start",
"description": "Container exec start event",
"health": "ok",
"severity": "info",
"value": "0",
"updatedAt": "2022-01-18T01:30:28Z"
},
{
"name": "container:event:kill",
"description": "Container kill event",
"health": "ok",
"severity": "info",
"value": "0",
"updatedAt": "2022-01-22T22:10:39Z"
},
{
"name": "container:event:restart",
"description": "Container restart event",
"health": "ok",
"severity": "info",
"value": "0",
"updatedAt": "2022-01-22T22:13:38Z"
},
{
"name": "container:event:restart-last-hour",
"description": "Container restart count in the last hour",
"health": "ok",
"severity": "info",
"value": "0",
"updatedAt": "2021-09-24T20:42:30Z"
},
{
"name": "container:event:start",
"description": "Container start event",
"health": "ok",
"severity": "info",
"value": "0",
"updatedAt": "2021-09-24T20:42:30Z"
},
{
"name": "container:event:stop",
"description": "Container stop event",
"health": "ok",
"severity": "info",
"value": "0",
"updatedAt": "2021-09-24T20:42:30Z"
},
{
"name": "container:running",
"description": "Container running",
"health": "ok",
"severity": "info",
"value": "true",
"updatedAt": "2022-01-24T05:31:38Z"
}
]
}
}
],
"firmware": [
{
"key": "appliance/firmware/bios",
"state": {
"name": "BIOS",
"health": "ok",
"severity": "info"
},
"attributes": {
"attribute": [
{
"name": "bios:missing-boot-device",
"description": "Missing Boot Device",
"health": "ok",
"severity": "info",
"value": "0",
"updatedAt": "2022-01-22T22:13:38Z"
},
{
"name": "bios:tpm-provisioning-failed",
"description": "TPM Provisioning Failed",
"health": "ok",
"severity": "info",
"value": "0",
"updatedAt": "2022-01-22T22:13:38Z"
},
{
"name": "bios:tpm-randomization-failed",
"description": "TPM Randomization Failed",
"health": "ok",
"severity": "info",
"value": "0",
"updatedAt": "2022-01-22T22:13:38Z"
},
{
"name": "firmware:action-after-update",
"description": "Action required after firmware update",
"health": "ok",
"severity": "info",
"value": "hostPowerCycle",
"updatedAt": "2022-01-22T22:13:37Z"
},
{
"name": "firmware:update-required",
"description": "Firmware update required",
"health": "ok",
"severity": "info",
"value": "false",
"updatedAt": "2022-01-22T22:13:37Z"
},
{
"name": "firmware:update-status",
"description": "Firmware update status",
"health": "ok",
"severity": "info",
"value": "",
"updatedAt": "2022-01-22T22:13:25Z"
},
{
"name": "firmware:version",
"description": "Firmware version",
"health": "ok",
"severity": "info",
"value": "1.02.108.1",
"updatedAt": "2022-01-22T22:13:37Z"
}
]
}
},
{
"key": "appliance/firmware/bios/me",
"state": {
"name": "BIOS ME",
"health": "ok",
"severity": "info"
},
"attributes": {
"attribute": [
{
"name": "firmware:action-after-update",
"description": "Action required after firmware update",
"health": "ok",
"severity": "info",
"value": "hostPowerCycle",
"updatedAt": "2022-01-22T22:13:37Z"
},
{
"name": "firmware:update-required",
"description": "Firmware update required",
"health": "ok",
"severity": "info",
"value": "false",
"updatedAt": "2022-01-22T22:13:37Z"
},
{
"name": "firmware:update-status",
"description": "Firmware update status",
"health": "ok",
"severity": "info",
"value": "",
"updatedAt": "2022-01-22T22:13:25Z"
},
{
"name": "firmware:version",
"description": "Firmware version",
"health": "ok",
"severity": "info",
"value": "4.4.4.58",
"updatedAt": "2022-01-22T22:13:37Z"
}
]
}
},
{
"key": "appliance/firmware/cpld",
"state": {
"name": "CPLD",
"health": "ok",
"severity": "info"
},
"attributes": {
"attribute": [
{
"name": "cpld:register:magic-byte-check",
"description": "CPLD register magic byte",
"health": "ok",
"severity": "info",
"value": "",
"updatedAt": "2021-09-24T20:42:13Z"
},
{
"name": "firmware:action-after-update",
"description": "Action required after firmware update",
"health": "ok",
"severity": "info",
"value": "cpldReload",
"updatedAt": "2022-01-22T22:13:37Z"
},
{
"name": "firmware:update-required",
"description": "Firmware update required",
"health": "ok",
"severity": "info",
"value": "false",
"updatedAt": "2022-01-22T22:13:37Z"
},
{
"name": "firmware:update-status",
"description": "Firmware update status",
"health": "ok",
"severity": "info",
"value": "",
"updatedAt": "2022-01-22T22:13:25Z"
},
{
"name": "firmware:version",
"description": "Firmware version",
"health": "ok",
"severity": "info",
"value": "02.0A.00",
"updatedAt": "2022-01-22T22:13:37Z"
}
]
}
},
{
"key": "appliance/firmware/drives",
"state": {
"name": "Drives",
"health": "ok",
"severity": "info"
}
},
{
"key": "appliance/firmware/drives/m.2-slot1",
"state": {
"name": "Drive NVME in Slot1",
"health": "ok",
"severity": "info"
},
"attributes": {
"attribute": [
{
"name": "firmware:action-after-update",
"description": "Action required after firmware update",
"health": "ok",
"severity": "info",
"value": "none",
"updatedAt": "2022-01-22T22:13:37Z"
},
{
"name": "firmware:update-required",
"description": "Firmware update required",
"health": "ok",
"severity": "info",
"value": "false",
"updatedAt": "2022-01-22T22:13:37Z"
},
{
"name": "firmware:update-status",
"description": "Firmware update status",
"health": "ok",
"severity": "info",
"value": "",
"updatedAt": "2022-01-22T22:13:25Z"
},
{
"name": "firmware:version",
"description": "Firmware version",
"health": "ok",
"severity": "info",
"value": "EDA7602Q",
"updatedAt": "2022-01-22T22:13:37Z"
}
]
}
},
{
"key": "appliance/firmware/fpga/asw",
"state": {
"name": "FPGA asw",
"health": "ok",
"severity": "info"
},
"attributes": {
"attribute": [
{
"name": "firmware:update-status",
"description": "Firmware update status",
"health": "ok",
"severity": "info",
"value": "complete",
"updatedAt": "2022-01-22T22:14:02Z"
},
{
"name": "firmware:version",
"description": "Firmware version",
"health": "ok",
"severity": "info",
"value": "71.2.7.00",
"updatedAt": "2022-01-22T22:14:02Z"
}
]
}
},
{
"key": "appliance/firmware/fpga/atse0",
"state": {
"name": "FPGA atse0",
"health": "ok",
"severity": "info"
},
"attributes": {
"attribute": [
{
"name": "firmware:update-status",
"description": "Firmware update status",
"health": "ok",
"severity": "info",
"value": "complete",
"updatedAt": "2022-01-22T22:13:46Z"
},
{
"name": "firmware:version",
"description": "Firmware version",
"health": "ok",
"severity": "info",
"value": "72.2.5.00",
"updatedAt": "2022-01-22T22:13:46Z"
}
]
}
},
{
"key": "appliance/firmware/lcd",
"state": {
"name": "LCD Application",
"health": "ok",
"severity": "info"
}
},
{
"key": "appliance/firmware/lcd/app",
"state": {
"name": "LCD app",
"health": "ok",
"severity": "info"
},
"attributes": {
"attribute": [
{
"name": "firmware:action-after-update",
"description": "Action required after firmware update",
"health": "ok",
"severity": "info",
"value": "none",
"updatedAt": "2021-11-30T03:19:16Z"
},
{
"name": "firmware:update-required",
"description": "Firmware update required",
"health": "ok",
"severity": "info",
"value": "true",
"updatedAt": "2021-11-30T03:19:15Z"
},
{
"name": "firmware:update-status",
"description": "Firmware update status",
"health": "ok",
"severity": "info",
"value": "",
"updatedAt": "2022-01-22T22:13:25Z"
},
{
"name": "firmware:version",
"description": "Firmware version",
"health": "ok",
"severity": "info",
"value": "",
"updatedAt": "2021-11-30T03:19:16Z"
}
]
}
},
{
"key": "appliance/firmware/lcd/bootloader",
"state": {
"name": "LCD bootloader",
"health": "ok",
"severity": "info"
},
"attributes": {
"attribute": [
{
"name": "firmware:action-after-update",
"description": "Action required after firmware update",
"health": "ok",
"severity": "info",
"value": "none",
"updatedAt": "2021-11-30T03:04:15Z"
},
{
"name": "firmware:update-required",
"description": "Firmware update required",
"health": "ok",
"severity": "info",
"value": "false",
"updatedAt": "2021-11-30T03:04:15Z"
},
{
"name": "firmware:update-status",
"description": "Firmware update status",
"health": "ok",
"severity": "info",
"value": "",
"updatedAt": "2022-01-22T22:13:25Z"
},
{
"name": "firmware:version",
"description": "Firmware version",
"health": "ok",
"severity": "info",
"value": "1.01.027.00.1",
"updatedAt": "2021-11-30T03:04:15Z"
}
]
}
},
{
"key": "appliance/firmware/lop/bootloader",
"state": {
"name": "LOP Bootloader",
"health": "ok",
"severity": "info"
},
"attributes": {
"attribute": [
{
"name": "firmware:action-after-update",
"description": "Action required after firmware update",
"health": "ok",
"severity": "info",
"value": "none",
"updatedAt": "2022-01-22T22:13:37Z"
},
{
"name": "firmware:update-required",
"description": "Firmware update required",
"health": "ok",
"severity": "info",
"value": "false",
"updatedAt": "2022-01-22T22:13:37Z"
},
{
"name": "firmware:update-status",
"description": "Firmware update status",
"health": "ok",
"severity": "info",
"value": "",
"updatedAt": "2022-01-22T22:13:25Z"
},
{
"name": "firmware:version",
"description": "Firmware version",
"health": "ok",
"severity": "info",
"value": "1.02.062.0.1",
"updatedAt": "2022-01-22T22:13:37Z"
}
]
}
},
{
"key": "appliance/firmware/lop/lop-app",
"state": {
"name": "LOP Application",
"health": "ok",
"severity": "info"
},
"attributes": {
"attribute": [
{
"name": "firmware:action-after-update",
"description": "Action required after firmware update",
"health": "ok",
"severity": "info",
"value": "none",
"updatedAt": "2022-01-22T22:13:37Z"
},
{
"name": "firmware:update-required",
"description": "Firmware update required",
"health": "ok",
"severity": "info",
"value": "false",
"updatedAt": "2022-01-22T22:13:37Z"
},
{
"name": "firmware:update-status",
"description": "Firmware update status",
"health": "ok",
"severity": "info",
"value": "",
"updatedAt": "2022-01-22T22:13:25Z"
},
{
"name": "firmware:version",
"description": "Firmware version",
"health": "ok",
"severity": "info",
"value": "1.00.214.0.1",
"updatedAt": "2022-01-22T22:13:37Z"
},
{
"name": "lop-app:firmware-diag:arm-exception",
"description": "ARM exception",
"health": "ok",
"severity": "info",
"value": "0",
"updatedAt": "2022-01-22T22:13:38Z"
},
{
"name": "lop-app:firmware-diag:heap-low",
"description": "Heap running low",
"health": "ok",
"severity": "info",
"value": "0",
"updatedAt": "2022-01-22T22:13:38Z"
},
{
"name": "lop-app:firmware-diag:task-stack-warning",
"description": "Task stack usage warning",
"health": "ok",
"severity": "info",
"value": "0",
"updatedAt": "2022-01-22T22:13:38Z"
},
{
"name": "lop-app:firmware-diag:wd-timer-warning",
"description": "Watchdog timer warning",
"health": "ok",
"severity": "info",
"value": "0",
"updatedAt": "2022-01-22T22:13:38Z"
}
]
}
},
{
"key": "appliance/firmware/tpm/sirr",
"state": {
"name": "TPM SIRR",
"health": "ok",
"severity": "info"
},
"attributes": {
"attribute": [
{
"name": "firmware:action-after-update",
"description": "Action required after firmware update",
"health": "ok",
"severity": "info",
"value": "none",
"updatedAt": "2022-01-22T22:13:37Z"
},
{
"name": "firmware:update-required",
"description": "Firmware update required",
"health": "ok",
"severity": "info",
"value": "false",
"updatedAt": "2022-01-22T22:13:37Z"
},
{
"name": "firmware:update-status",
"description": "Firmware update status",
"health": "ok",
"severity": "info",
"value": "",
"updatedAt": "2022-01-22T22:13:25Z"
},
{
"name": "firmware:version",
"description": "Firmware version",
"health": "ok",
"severity": "info",
"value": "1.1.29",
"updatedAt": "2022-01-22T22:13:37Z"
}
]
}
}
]
},
{
"name": "drive-slot-1",
"hardware": [
{
"key": "appliance/hardware/drives/m.2-slot1",
"state": {
"name": "Drive NVME in Slot1",
"health": "ok",
"severity": "info"
},
"attributes": {
"attribute": [
{
"name": "drives:nvme:name",
"description": "Drive NVME logical name",
"health": "ok",
"severity": "info",
"value": "nvme0",
"updatedAt": "2022-01-22T22:13:43Z"
},
{
"name": "drives:smart:nvme:attr:available-spare",
"description": "Available Spare",
"health": "ok",
"severity": "info",
"value": "100",
"updatedAt": "2022-01-24T05:00:06Z"
},
{
"name": "drives:smart:nvme:attr:critical-warning:available-spare",
"description": "SMART Attribute Critical Warning - Available Spare",
"health": "ok",
"severity": "info",
"value": "false",
"updatedAt": "2022-01-24T05:00:06Z"
},
{
"name": "drives:smart:nvme:attr:critical-warning:media-or-internal-errors",
"description": "SMART Attribute Critical Warning - Media Errors",
"health": "ok",
"severity": "info",
"value": "false",
"updatedAt": "2022-01-24T05:00:06Z"
},
{
"name": "drives:smart:nvme:attr:critical-warning:read-only-mode",
"description": "SMART Attribute Critical Warning - Read-Only Mode",
"health": "ok",
"severity": "info",
"value": "false",
"updatedAt": "2022-01-24T05:00:06Z"
},
{
"name": "drives:smart:nvme:attr:critical-warning:temperature",
"description": "SMART Attribute Critical Warning - Temperature",
"health": "ok",
"severity": "info",
"value": "false",
"updatedAt": "2022-01-24T05:00:06Z"
},
{
"name": "drives:smart:nvme:attr:critical-warning:volatile-memory-backup",
"description": "SMART Attribute Critical Warning - Volatile Memory",
"health": "ok",
"severity": "info",
"value": "false",
"updatedAt": "2022-01-24T05:00:06Z"
},
{
"name": "drives:smart:nvme:attr:media-errors",
"description": "SMART Attribute Media Errors",
"health": "ok",
"severity": "info",
"value": "0",
"updatedAt": "2022-01-24T05:00:06Z"
},
{
"name": "drives:smart:nvme:attr:percentage-used",
"description": "Percentage Used (%)",
"health": "ok",
"severity": "info",
"value": "0",
"updatedAt": "2022-01-24T05:00:06Z"
},
{
"name": "drives:smart:nvme:attr:temperature",
"description": "Temperature (C)",
"health": "ok",
"severity": "info",
"value": "47",
"updatedAt": "2022-01-24T05:00:06Z"
},
{
"name": "module:present",
"description": "Module present status",
"health": "ok",
"severity": "info",
"value": "true",
"updatedAt": "2022-01-22T22:13:38Z"
},
{
"name": "v6h:power-domain:device:ssd1",
"description": "Drive NVME power fault",
"health": "ok",
"severity": "info",
"value": "0",
"updatedAt": "2022-01-22T22:13:38Z"
}
]
}
}
],
"firmware": [
{
"key": "appliance/firmware/drives/m.2-slot1",
"state": {
"name": "Drive NVME in Slot1",
"health": "ok",
"severity": "info"
},
"attributes": {
"attribute": [
{
"name": "firmware:action-after-update",
"description": "Action required after firmware update",
"health": "ok",
"severity": "info",
"value": "none",
"updatedAt": "2022-01-22T22:13:37Z"
},
{
"name": "firmware:update-required",
"description": "Firmware update required",
"health": "ok",
"severity": "info",
"value": "false",
"updatedAt": "2022-01-22T22:13:37Z"
},
{
"name": "firmware:update-status",
"description": "Firmware update status",
"health": "ok",
"severity": "info",
"value": "",
"updatedAt": "2022-01-22T22:13:25Z"
},
{
"name": "firmware:version",
"description": "Firmware version",
"health": "ok",
"severity": "info",
"value": "EDA7602Q",
"updatedAt": "2022-01-22T22:13:37Z"
}
]
}
}
]
},
{
"name": "fantray",
"hardware": [
{
"key": "appliance/hardware/fantray",
"state": {
"name": "Fan Tray",
"health": "ok",
"severity": "info"
},
"attributes": {
"attribute": [
{
"name": "module:present",
"description": "Module present status",
"health": "ok",
"severity": "info",
"value": "true",
"updatedAt": "2022-01-22T22:13:38Z"
},
{
"name": "v6h:power-domain:device:fans",
"description": "FANS power fault",
"health": "ok",
"severity": "info",
"value": "0",
"updatedAt": "2022-01-22T22:13:38Z"
},
{
"name": "v6h:sensor:speed:fan1",
"description": "Fan 1 (RPM)",
"health": "ok",
"severity": "info",
"value": "16295",
"updatedAt": "2022-01-22T22:13:38Z"
},
{
"name": "v6h:sensor:speed:fan2",
"description": "Fan 2 (RPM)",
"health": "ok",
"severity": "info",
"value": "16260",
"updatedAt": "2022-01-22T22:13:38Z"
},
{
"name": "v6h:sensor:speed:fan3",
"description": "Fan 3 (RPM)",
"health": "ok",
"severity": "info",
"value": "16224",
"updatedAt": "2022-01-22T22:13:38Z"
},
{
"name": "v6h:sensor:speed:fan4",
"description": "Fan 4 (RPM)",
"health": "ok",
"severity": "info",
"value": "16242",
"updatedAt": "2022-01-22T22:13:38Z"
},
{
"name": "v6h:sensor:speed:fan5",
"description": "Fan 5 (RPM)",
"health": "ok",
"severity": "info",
"value": "16224",
"updatedAt": "2022-01-22T22:13:38Z"
},
{
"name": "v6h:sensor:speed:fan6",
"description": "Fan 6 (RPM)",
"health": "ok",
"severity": "info",
"value": "16402",
"updatedAt": "2022-01-22T22:13:38Z"
},
{
"name": "v6h:sensor:speed:fan7",
"description": "Fan 7 (RPM)",
"health": "ok",
"severity": "info",
"value": "16322",
"updatedAt": "2022-01-22T22:13:38Z"
},
{
"name": "v6h:sensor:speed:fan8",
"description": "Fan 8 (RPM)",
"health": "ok",
"severity": "info",
"value": "16330",
"updatedAt": "2022-01-22T22:13:38Z"
}
]
}
}
]
},
{
"name": "lcd",
"hardware": [
{
"key": "appliance/hardware/lcd",
"state": {
"name": "LCD",
"health": "ok",
"severity": "info"
},
"attributes": {
"attribute": [
{
"name": "lcd:health",
"description": "LCD Health Monitor",
"health": "ok",
"severity": "info",
"value": "1",
"updatedAt": "2022-01-24T05:32:16Z"
},
{
"name": "lcd:sensor:11vcore",
"description": "1.1V Core (V)",
"health": "ok",
"severity": "info",
"value": "1.096436",
"updatedAt": "2022-01-24T05:00:06Z"
},
{
"name": "lcd:sensor:11vmpu",
"description": "1.1V MPU (V)",
"health": "ok",
"severity": "info",
"value": "1.095996",
"updatedAt": "2022-01-24T05:00:06Z"
},
{
"name": "lcd:sensor:135vddr3",
"description": "1.35V DDR3 (V)",
"health": "ok",
"severity": "info",
"value": "1.352197",
"updatedAt": "2022-01-24T05:00:06Z"
},
{
"name": "lcd:sensor:18v0",
"description": "1.8V 1 (V)",
"health": "ok",
"severity": "info",
"value": "1.794727",
"updatedAt": "2022-01-24T05:00:06Z"
},
{
"name": "lcd:sensor:33v",
"description": "3.3V (V)",
"health": "ok",
"severity": "info",
"value": "3.314355",
"updatedAt": "2022-01-24T05:00:06Z"
},
{
"name": "lcd:sensor:33vlcd",
"description": "3.3V LCD (V)",
"health": "ok",
"severity": "info",
"value": "3.295898",
"updatedAt": "2022-01-24T05:00:06Z"
},
{
"name": "lcd:sensor:5v",
"description": "5V (V)",
"health": "ok",
"severity": "info",
"value": "4.960986",
"updatedAt": "2022-01-24T05:00:06Z"
},
{
"name": "lcd:sensor:temperature",
"description": "LCD Temperature (C)",
"health": "ok",
"severity": "info",
"value": "33.689933",
"updatedAt": "2022-01-24T05:00:06Z"
},
{
"name": "module:communication-error",
"description": "Module communication error",
"health": "ok",
"severity": "info",
"value": "false",
"updatedAt": "2022-01-24T05:32:16Z"
},
{
"name": "module:present",
"description": "Module present status",
"health": "ok",
"severity": "info",
"value": "true",
"updatedAt": "2022-01-22T22:13:38Z"
}
]
}
}
],
"services": [
{
"key": "appliance/services/lcd-webserver",
"state": {
"name": "lcd-webserver",
"health": "ok",
"severity": "info"
},
"attributes": {
"attribute": [
{
"name": "container:event:attach",
"description": "Container attach event",
"health": "ok",
"severity": "info",
"value": "0",
"updatedAt": "2021-09-24T20:42:30Z"
},
{
"name": "container:event:die",
"description": "Container die event",
"health": "ok",
"severity": "info",
"value": "0",
"updatedAt": "2021-12-08T19:43:32Z"
},
{
"name": "container:event:exec-create",
"description": "Container exec create event",
"health": "ok",
"severity": "info",
"value": "0",
"updatedAt": "2022-01-18T01:29:46Z"
},
{
"name": "container:event:exec-detach",
"description": "Container exec detach event",
"health": "ok",
"severity": "info",
"value": "0",
"updatedAt": "2021-09-24T20:42:30Z"
},
{
"name": "container:event:exec-die",
"description": "Container exec die event",
"health": "ok",
"severity": "info",
"value": "0",
"updatedAt": "2021-09-24T20:42:30Z"
},
{
"name": "container:event:exec-start",
"description": "Container exec start event",
"health": "ok",
"severity": "info",
"value": "0",
"updatedAt": "2022-01-18T01:29:46Z"
},
{
"name": "container:event:kill",
"description": "Container kill event",
"health": "ok",
"severity": "info",
"value": "0",
"updatedAt": "2022-01-22T22:10:38Z"
},
{
"name": "container:event:restart",
"description": "Container restart event",
"health": "ok",
"severity": "info",
"value": "0",
"updatedAt": "2022-01-22T22:13:38Z"
},
{
"name": "container:event:restart-last-hour",
"description": "Container restart count in the last hour",
"health": "ok",
"severity": "info",
"value": "0",
"updatedAt": "2021-09-24T20:42:30Z"
},
{
"name": "container:event:start",
"description": "Container start event",
"health": "ok",
"severity": "info",
"value": "0",
"updatedAt": "2021-09-24T20:42:30Z"
},
{
"name": "container:event:stop",
"description": "Container stop event",
"health": "ok",
"severity": "info",
"value": "0",
"updatedAt": "2021-11-30T03:09:43Z"
},
{
"name": "container:running",
"description": "Container running",
"health": "ok",
"severity": "info",
"value": "true",
"updatedAt": "2022-01-24T05:31:38Z"
}
]
}
}
],
"firmware": [
{
"key": "appliance/firmware/lcd",
"state": {
"name": "LCD Application",
"health": "ok",
"severity": "info"
}
},
{
"key": "appliance/firmware/lcd/app",
"state": {
"name": "LCD app",
"health": "ok",
"severity": "info"
},
"attributes": {
"attribute": [
{
"name": "firmware:action-after-update",
"description": "Action required after firmware update",
"health": "ok",
"severity": "info",
"value": "none",
"updatedAt": "2021-11-30T03:19:16Z"
},
{
"name": "firmware:update-required",
"description": "Firmware update required",
"health": "ok",
"severity": "info",
"value": "true",
"updatedAt": "2021-11-30T03:19:15Z"
},
{
"name": "firmware:update-status",
"description": "Firmware update status",
"health": "ok",
"severity": "info",
"value": "",
"updatedAt": "2022-01-22T22:13:25Z"
},
{
"name": "firmware:version",
"description": "Firmware version",
"health": "ok",
"severity": "info",
"value": "",
"updatedAt": "2021-11-30T03:19:16Z"
}
]
}
},
{
"key": "appliance/firmware/lcd/bootloader",
"state": {
"name": "LCD bootloader",
"health": "ok",
"severity": "info"
},
"attributes": {
"attribute": [
{
"name": "firmware:action-after-update",
"description": "Action required after firmware update",
"health": "ok",
"severity": "info",
"value": "none",
"updatedAt": "2021-11-30T03:04:15Z"
},
{
"name": "firmware:update-required",
"description": "Firmware update required",
"health": "ok",
"severity": "info",
"value": "false",
"updatedAt": "2021-11-30T03:04:15Z"
},
{
"name": "firmware:update-status",
"description": "Firmware update status",
"health": "ok",
"severity": "info",
"value": "",
"updatedAt": "2022-01-22T22:13:25Z"
},
{
"name": "firmware:version",
"description": "Firmware version",
"health": "ok",
"severity": "info",
"value": "1.01.027.00.1",
"updatedAt": "2021-11-30T03:04:15Z"
}
]
}
}
]
},
{
"name": "psu-1",
"hardware": [
{
"key": "appliance/hardware/psu/psu1",
"state": {
"name": "psu-1",
"health": "ok",
"severity": "info"
},
"attributes": {
"attribute": [
{
"name": "module:communication-error",
"description": "Module communication error",
"health": "ok",
"severity": "info",
"value": "false",
"updatedAt": "2022-01-22T22:13:40Z"
},
{
"name": "psu:sensor:current-in",
"description": "PSU Current In (A)",
"health": "ok",
"severity": "info",
"value": "1.75",
"updatedAt": "2022-01-24T05:00:06Z"
},
{
"name": "psu:sensor:current-out",
"description": "PSU Current Out (A)",
"health": "ok",
"severity": "info",
"value": "27.812",
"updatedAt": "2022-01-24T05:00:06Z"
},
{
"name": "psu:sensor:fan1-speed",
"description": "PSU Fan 1 Speed (RPM)",
"health": "ok",
"severity": "info",
"value": "9600",
"updatedAt": "2022-01-24T05:00:06Z"
},
{
"name": "psu:sensor:power-in",
"description": "PSU Power In (W)",
"health": "ok",
"severity": "info",
"value": "340",
"updatedAt": "2022-01-24T05:00:06Z"
},
{
"name": "psu:sensor:power-out",
"description": "PSU Power Out (W)",
"health": "ok",
"severity": "info",
"value": "333",
"updatedAt": "2022-01-24T05:00:06Z"
},
{
"name": "psu:sensor:temperature1",
"description": "PSU Temperature 1 (C)",
"health": "ok",
"severity": "info",
"value": "38",
"updatedAt": "2022-01-24T05:00:06Z"
},
{
"name": "psu:sensor:temperature2",
"description": "PSU Temperature 2 (C)",
"health": "ok",
"severity": "info",
"value": "49",
"updatedAt": "2022-01-24T05:00:06Z"
},
{
"name": "psu:sensor:temperature3",
"description": "PSU Temperature 3 (C)",
"health": "ok",
"severity": "info",
"value": "54",
"updatedAt": "2022-01-24T05:00:06Z"
},
{
"name": "psu:sensor:voltage-in",
"description": "PSU Voltage In (V)",
"health": "ok",
"severity": "info",
"value": "204",
"updatedAt": "2022-01-24T05:00:06Z"
},
{
"name": "psu:sensor:voltage-out",
"description": "PSU Voltage Out (V)",
"health": "ok",
"severity": "info",
"value": "12.062",
"updatedAt": "2022-01-24T05:00:06Z"
},
{
"name": "psu:state:input-over-current-fault",
"description": "PSU Input Over Current Fault",
"health": "ok",
"severity": "info",
"value": "0",
"updatedAt": "2022-01-22T22:14:09Z"
},
{
"name": "psu:state:input-over-current-warning",
"description": "PSU Input Over Current Warning",
"health": "ok",
"severity": "info",
"value": "0",
"updatedAt": "2022-01-22T22:14:09Z"
},
{
"name": "psu:state:input-over-power-warning",
"description": "PSU Input Over Power Warning",
"health": "ok",
"severity": "info",
"value": "0",
"updatedAt": "2022-01-22T22:14:09Z"
},
{
"name": "psu:state:input-over-voltage-fault",
"description": "PSU Input Over Voltage Fault",
"health": "ok",
"severity": "info",
"value": "0",
"updatedAt": "2022-01-22T22:14:09Z"
},
{
"name": "psu:state:input-over-voltage-warning",
"description": "PSU Input Over Voltage Warning",
"health": "ok",
"severity": "info",
"value": "0",
"updatedAt": "2022-01-22T22:14:09Z"
},
{
"name": "psu:state:input-under-voltage-fault",
"description": "PSU Input Under Voltage Fault",
"health": "ok",
"severity": "info",
"value": "0",
"updatedAt": "2022-01-22T22:14:09Z"
},
{
"name": "psu:state:input-under-voltage-warning",
"description": "PSU Input Under Voltage Warning",
"health": "ok",
"severity": "info",
"value": "0",
"updatedAt": "2022-01-22T22:14:09Z"
},
{
"name": "psu:state:input-unit-off-for-low-input-voltage",
"description": "PSU Input Unit Off For Low Input Voltage",
"health": "ok",
"severity": "info",
"value": "0",
"updatedAt": "2022-01-22T22:14:09Z"
},
{
"name": "psu:status:input-ok",
"description": "PSU Status Input OK",
"health": "ok",
"severity": "info",
"value": "1",
"updatedAt": "2022-01-22T22:14:09Z"
},
{
"name": "psu:status:output-ok",
"description": "PSU Status Output OK",
"health": "ok",
"severity": "info",
"value": "1",
"updatedAt": "2022-01-22T22:14:09Z"
},
{
"name": "psu:status:present",
"description": "PSU Status Present",
"health": "ok",
"severity": "info",
"value": "true",
"updatedAt": "2022-01-22T22:14:09Z"
},
{
"name": "psu:status:smb-alert",
"description": "PSU Status SMB Alert",
"health": "ok",
"severity": "info",
"value": "",
"updatedAt": "2022-01-22T22:13:38Z"
},
{
"name": "psu:status:unsupported",
"description": "PSU Status Unsupported",
"health": "ok",
"severity": "info",
"value": "0",
"updatedAt": "2022-01-22T22:14:09Z"
}
]
}
}
]
}
]
}
}
}