Automation, Orchestration & DevOps > Class 13: ADC Performance Monitoring and Autoscaling Lab Source | Edit on
Lab 2 - Configuring Alerts with Elastic Watcher
In this lab, you will work with the Elastic ELK stack previously deployed in Lab 1. The ELK stack provides centralized storage, analysis and visualization of organizational data. As part of your application deployment, BIG-IPs are preconfigured to use F5 Telemetry Streaming to send telemetry data to the ELK stack. As a student, your job will be to use configure your ELK stack to monitor the log data and send alert triggers to the ADPM system when scaling of either the BIG-IP frontend or backend workloads are warranted.
Exercise 1 - Create Index Pattern
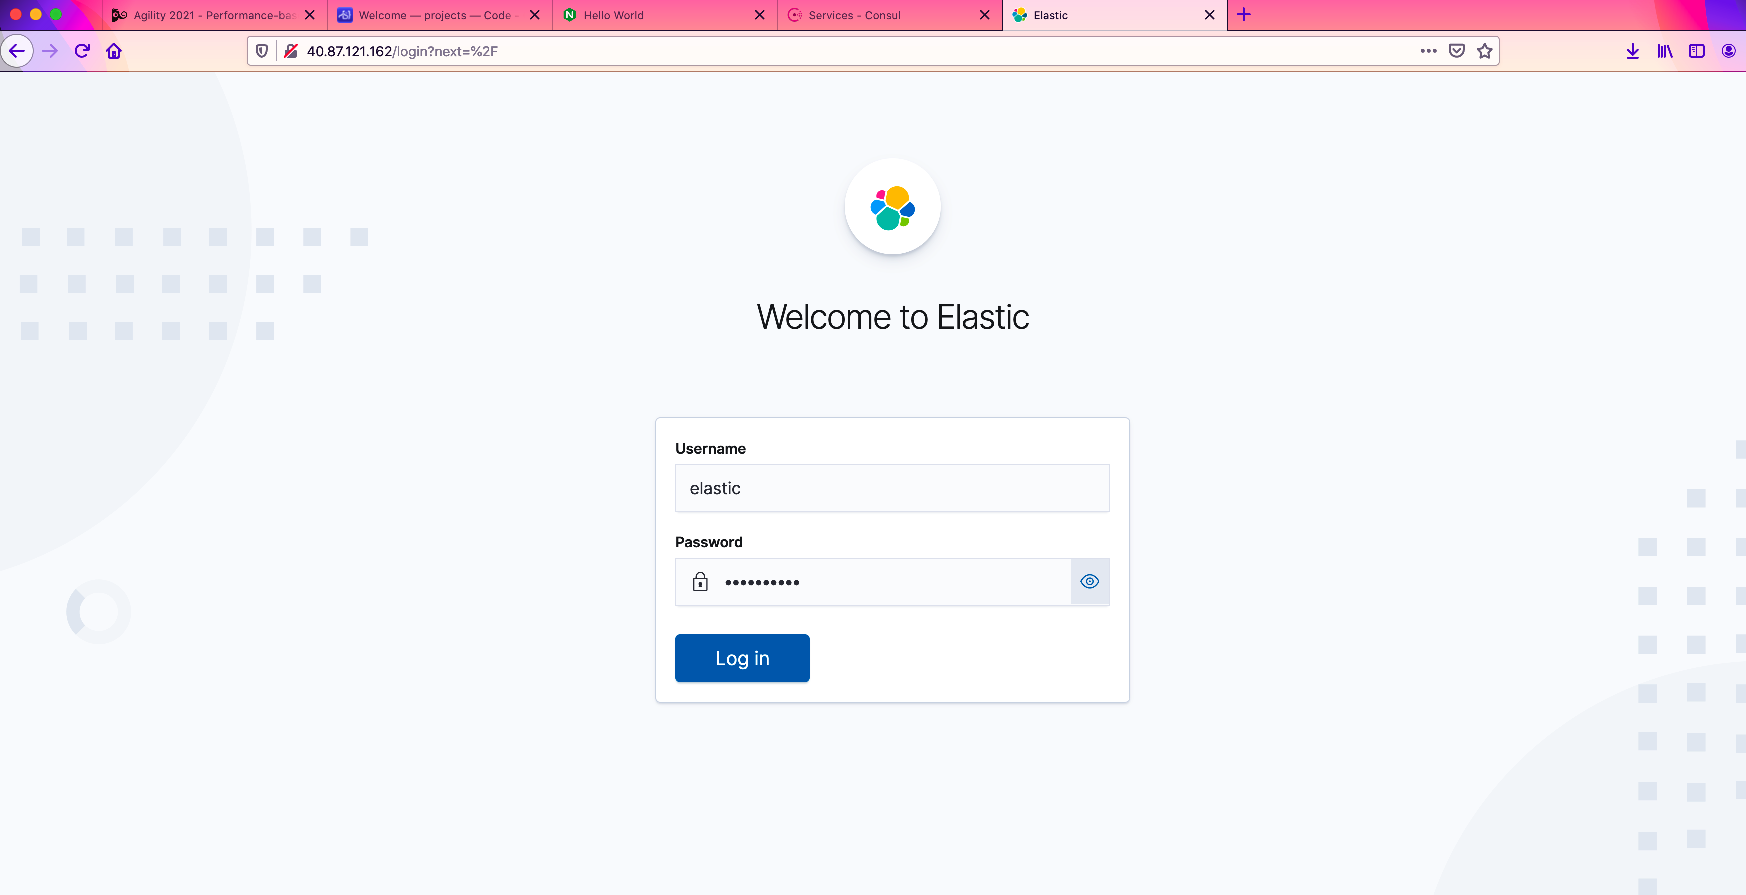
From your VS Code browser page, either copy or double-click on the link entitled f_elk_public_address. You are presented with the logon page shown below. Use the relevant credentials provided in the startup section to log into Kibana, (the ELK stack visualization service and the 'K' in ELK). In the unlikely event you receive a 502 browser error when trying to access the Kibana front end, notify your instructor for assistance.
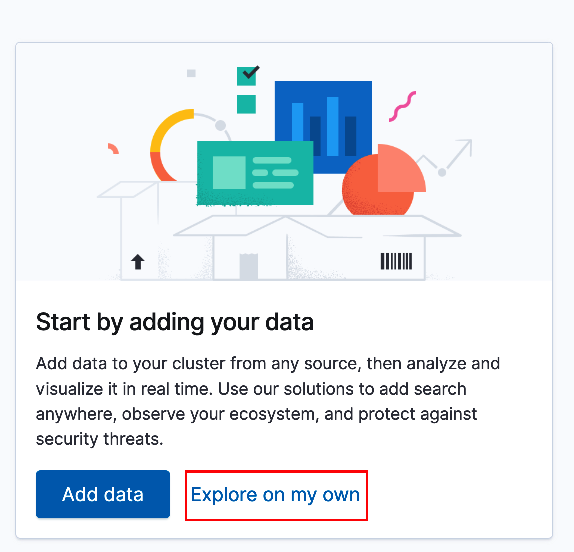
Upon your initial login, you will be provided an option to add data or explore the environment on your own, (see below). Since we have already configured data ingestion via F5 Telemetry Streaming select 'Explore on my own'.
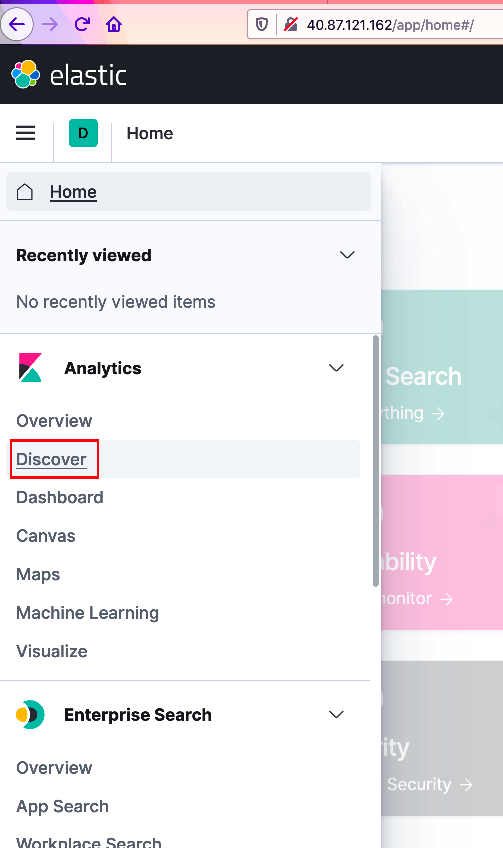
Next, you will need to create an index pattern. The index pattern will provide a starting base in which to query ingested BIG-IP telemetry. From the upper-left corner select the menu icon and navigate down the sidebar menu to the 'Analytics' section and select 'Discover', (see below).
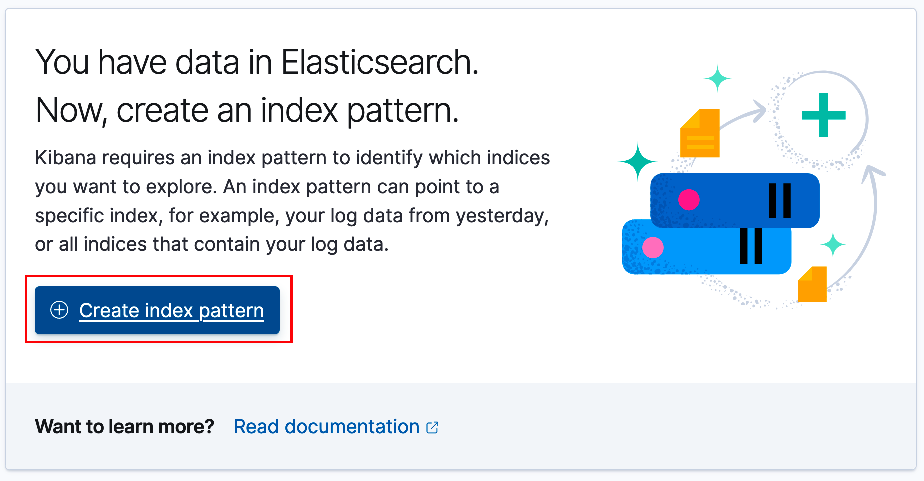
From the center panel, select 'Create index pattern', (see below).
On the Create Index Pattern screen enter
f5-*for the index pattern name. As the example below illustrates, you should see several indexes listed below. As telemetry data is streamed from the BIG-IP(s) to the ELK stack, (via Logstash - the 'L' in ELK) it is assigned an index with a pattern of f5-%{+YYYY.MM.dd.hh.mm}. Click 'Next Step' to continue.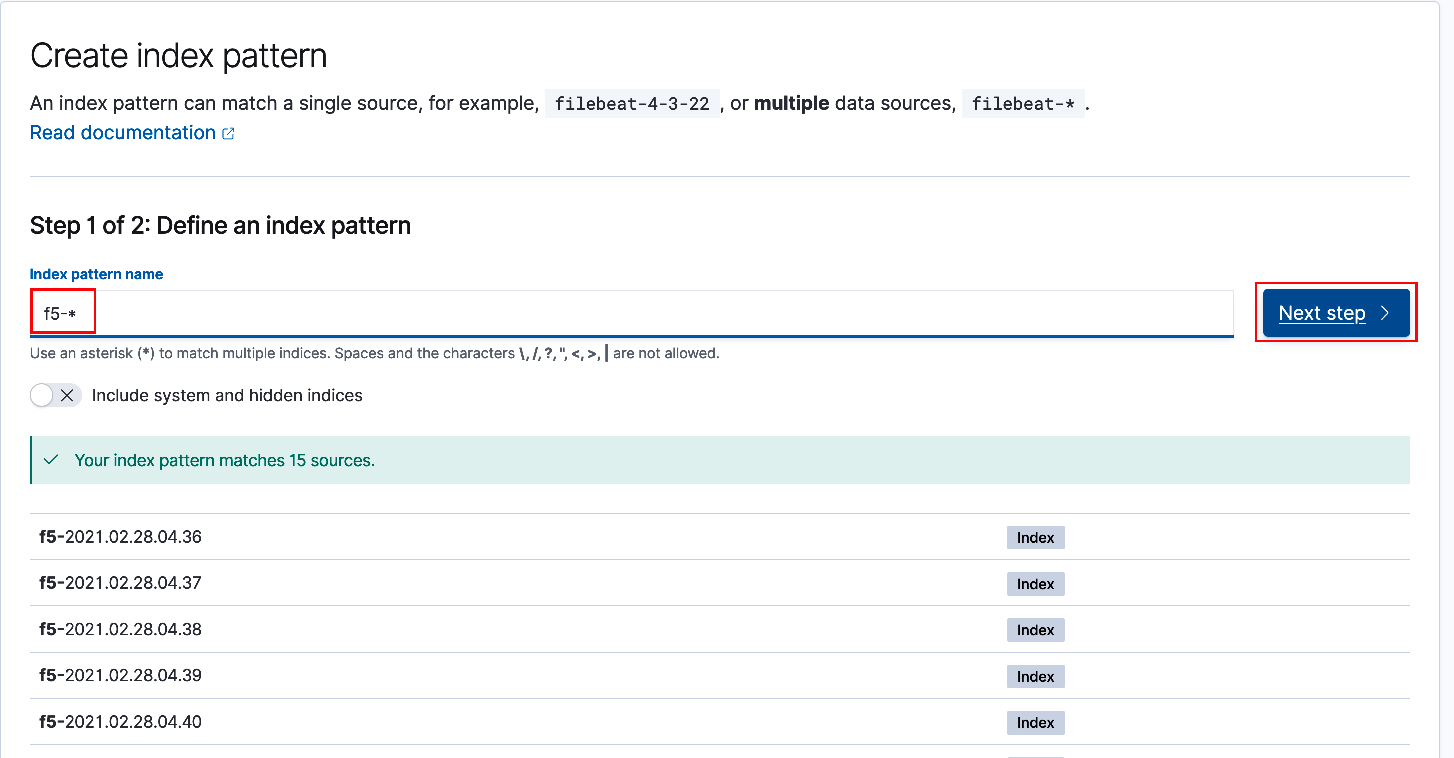
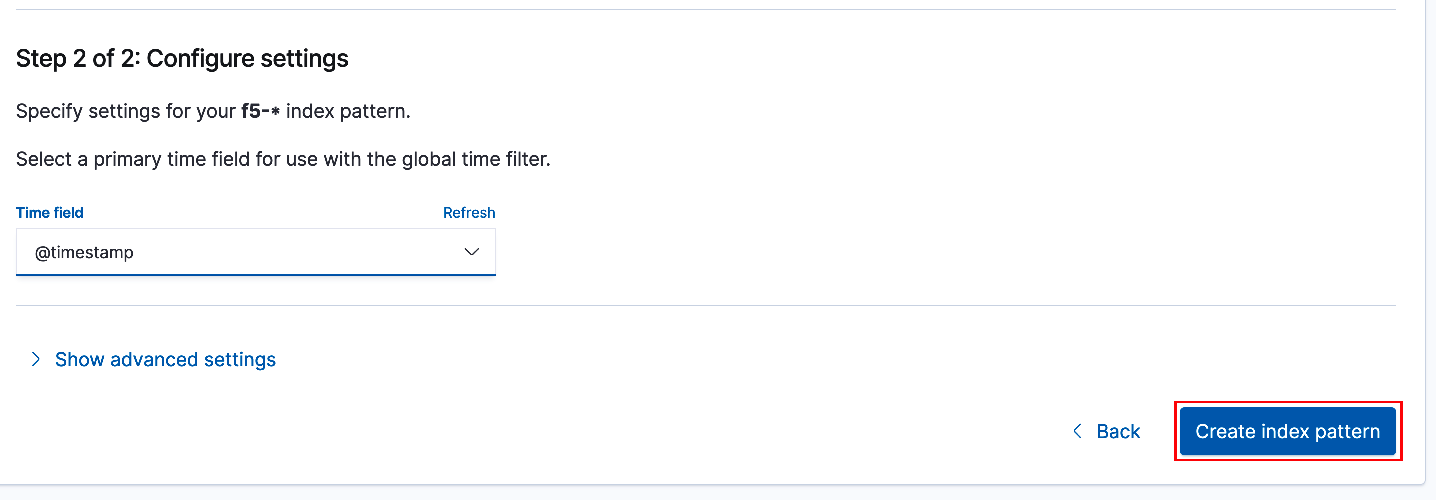
Select @timestamp from the drop-down list for the 'Time Field'. Select 'Create index pattern' to complete the process.
Exercise 2 - Enable Elastic Trial License
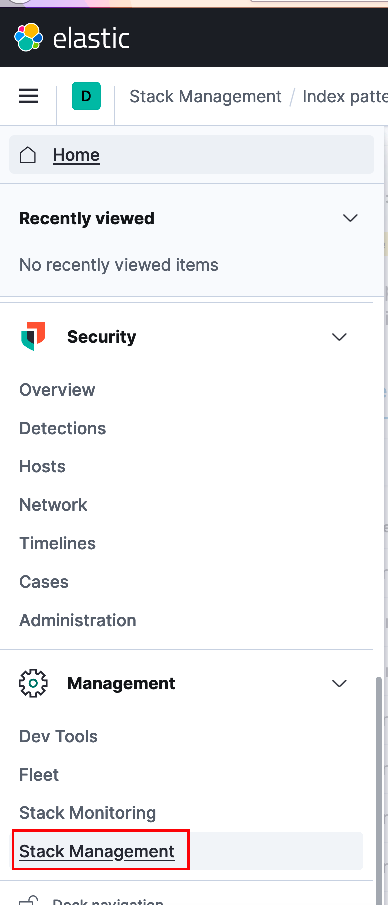
Your ELK stack will initially deploy with a free basic license. However, to make use of alerts and webhook notifications, (either via Kibana or Watcher) you must first upgrade the ELK stack license. To do this, you will enable a 30-day trial license. From the upper-left corner select the menu icon and navigate down the sidebar menu to the bottom and select 'Stack Management' to open the Stack Management side-bar submenu.
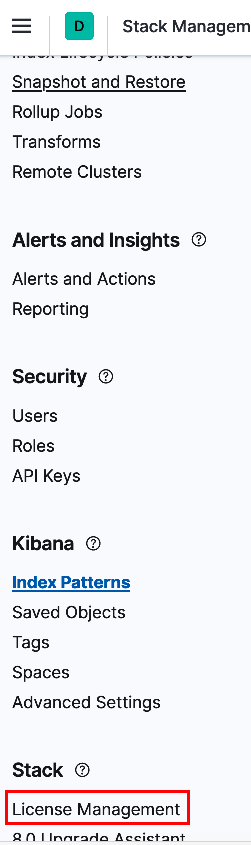
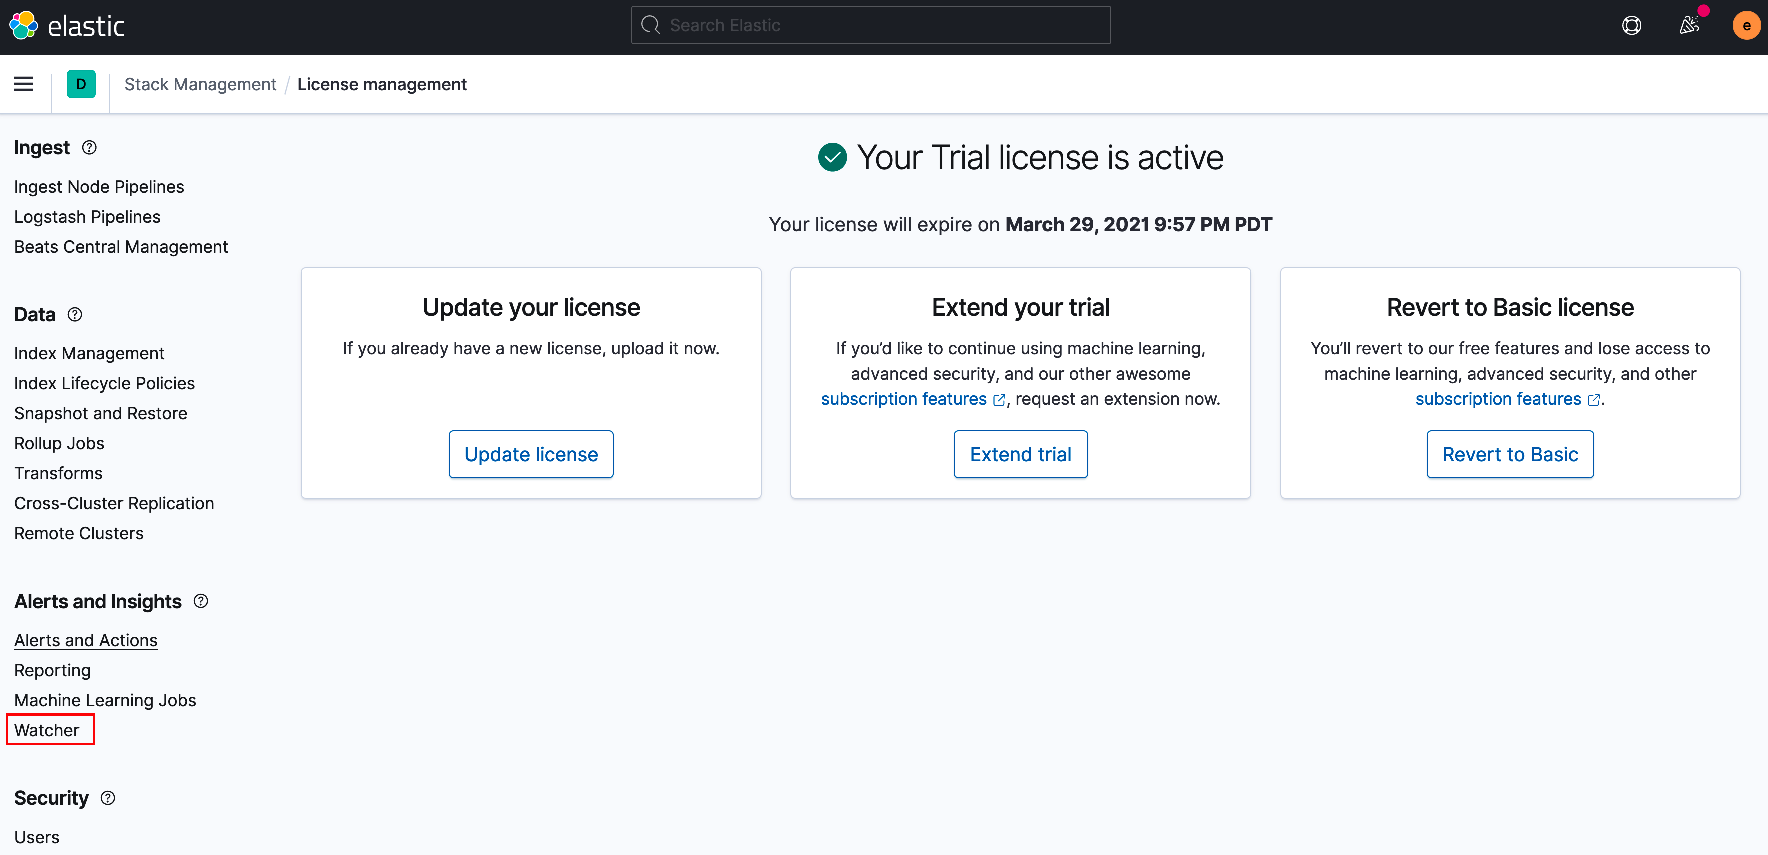
From the Stack Management menu scroll to the bottom and select 'License Management'
You will be presented with an option to either update your license or start a 30-day trial. Select 'Start trial' to activate the license. Select the default on the pop-up agreement.
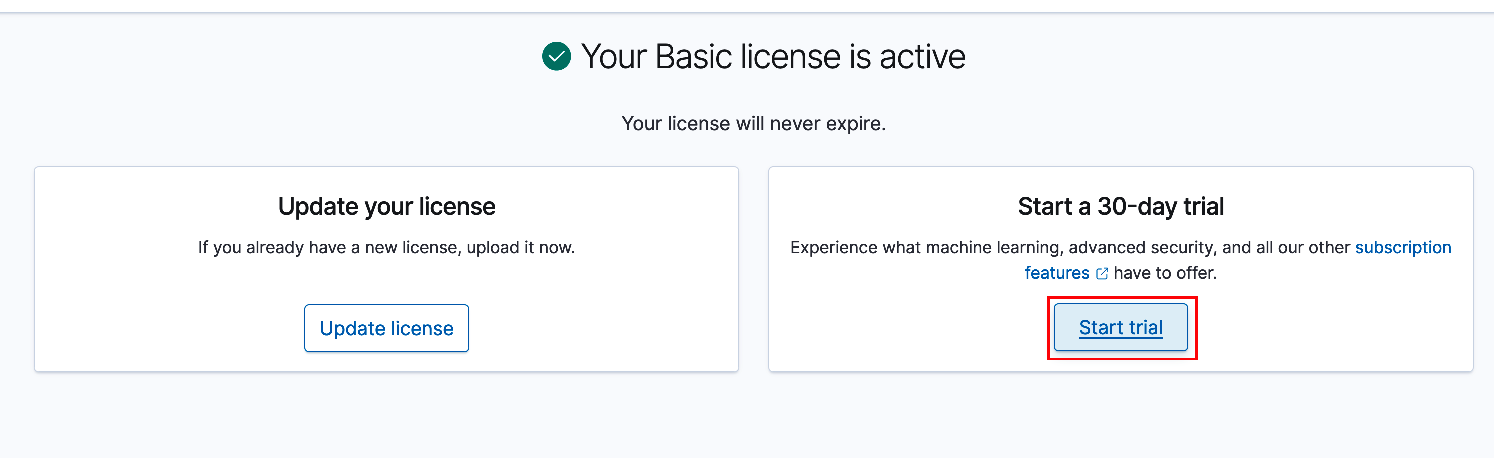
You should be presented with a notification screen as shown below signifying license activation and expiration date.
Exercise 3 - Create Watcher Alerts
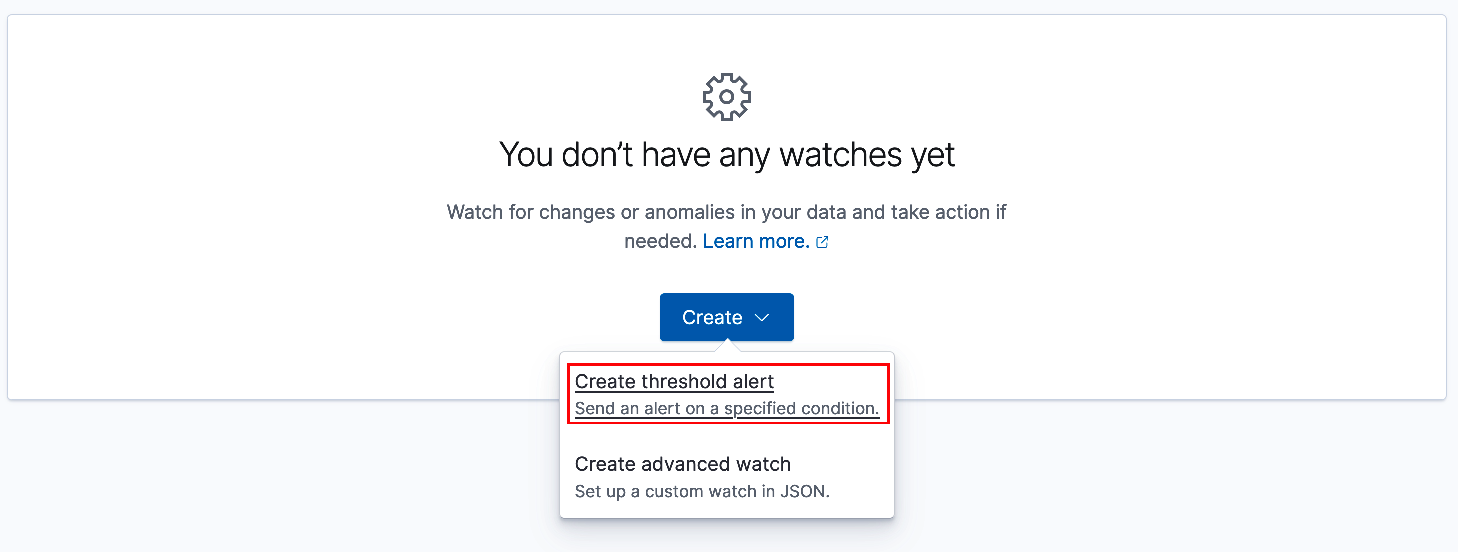
You will be using Elastic Watcher to monitor telemetry data and provide alert notifications. While still in the Stack Management submenu navigate to and select 'Watcher', (see above). From the center panel select 'Create' and then 'Create threshold alert'.
For the lab, you will be creating a total of four (4) alerts. These alerts will monitor and respond to increases/decreases in BIG-IP CPU utilization and current application connections. In the event a member BIG-IP's CPU utilization exceeds or falls below the specified thresholds during the specified interval, an alert will fire triggering a webhook call to the ADPM alertForwarder service. The alertForwarder will subsequently post a BIG-IP scaling request to the central processor, (utilizing the repo's GitHub Actions).
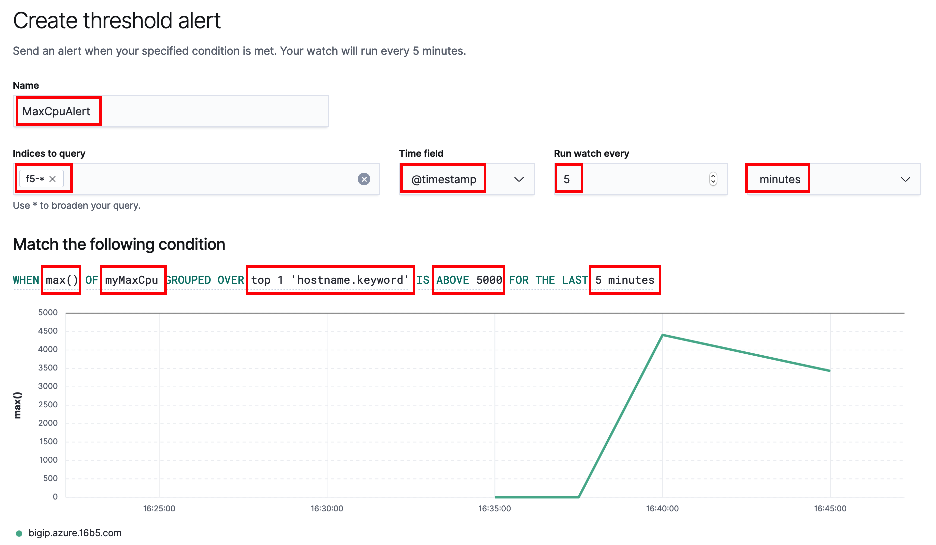
Likewise, if current connections fall outside of the specified thresholds a similar alert will be fired. However, rather than scaling BIG-IP instances, this will trigger a scaling (up/down) of the backend application workloads, (lab ex: NGINX). Use the screenshot example below to create the first alert, (MaxCpuAlert).
Provide a name, select the previously created index pattern of
f5-*, timestamp and timing parameters as shown below. Under conditions section select Max(), myMaxCpu, top 1, hostname.keyword, 5000 and 5 minutes as shown below.Note: You should see a green line of the displayed chart that represents the selected field's, (myMaxCpu) value trend. This will aid you in setting threshold values appropriately to ensure scaling events are triggered. With that said, the lab environment has been configured with hard limits of (3) BIG-IP instances and (3) workload instances to ensure availability of resources for all students. Additionally, the ADPM processor is designed to throttle requests and prevent superfluous "over-scaling". Requests that are triggered but not fullfilled, (along with successful requests) are logged on your environment's Consul server.
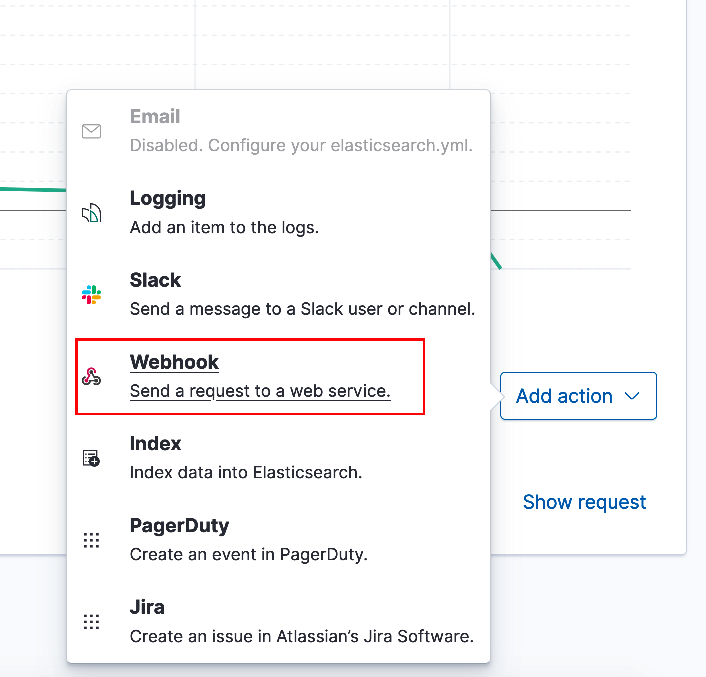
In the Actions section select 'Add action'. From the menu pop-up select 'Webhook', (see below).
Use the below example to complete the webhook section. When you are done select 'Create alert'. Specifiy
alertforwarder.f5demo.netfor the Host. For the webhook body enter{"source": "elk", "scaleAction":"scaleOutBigip", "message": "{{ctx.payload}}"}. The alertForwarder service is expecting the JSON formatted payload and will parse according to source. The alertForwarder call the central processer, (via webhook) to trigger scaling.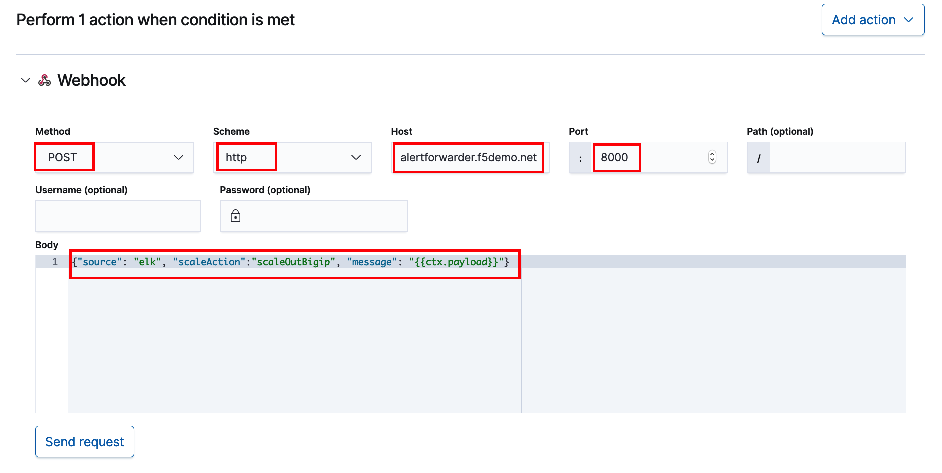
Use the table and example images below to create three additional alerts. Entries not noted in the table below are identical across alerts.
Name WHEN OF GROUPED OVER IS LAST Webhook body MinCpuAlert max() myCurCons top 1 of hostname.keyword BELOW 1000 5 minutes {"source": "elk", "scaleAction":"scaleInBigip", "message": "{{ctx.payload}}"}MinConnsAlert max() myCurCons top 1 of hostname.keyword BELOW 50 5 minutes {"source": "elk", "scaleAction":"scaleInWorkload", "message": "{{ctx.payload}}"}MaxConnsAlert max() myCurCons top 1 of hostname.keyword ABOVE 500 5 minutes {"source": "elk", "scaleAction":"scaleOutWorkload", "message": "{{ctx.payload}}"}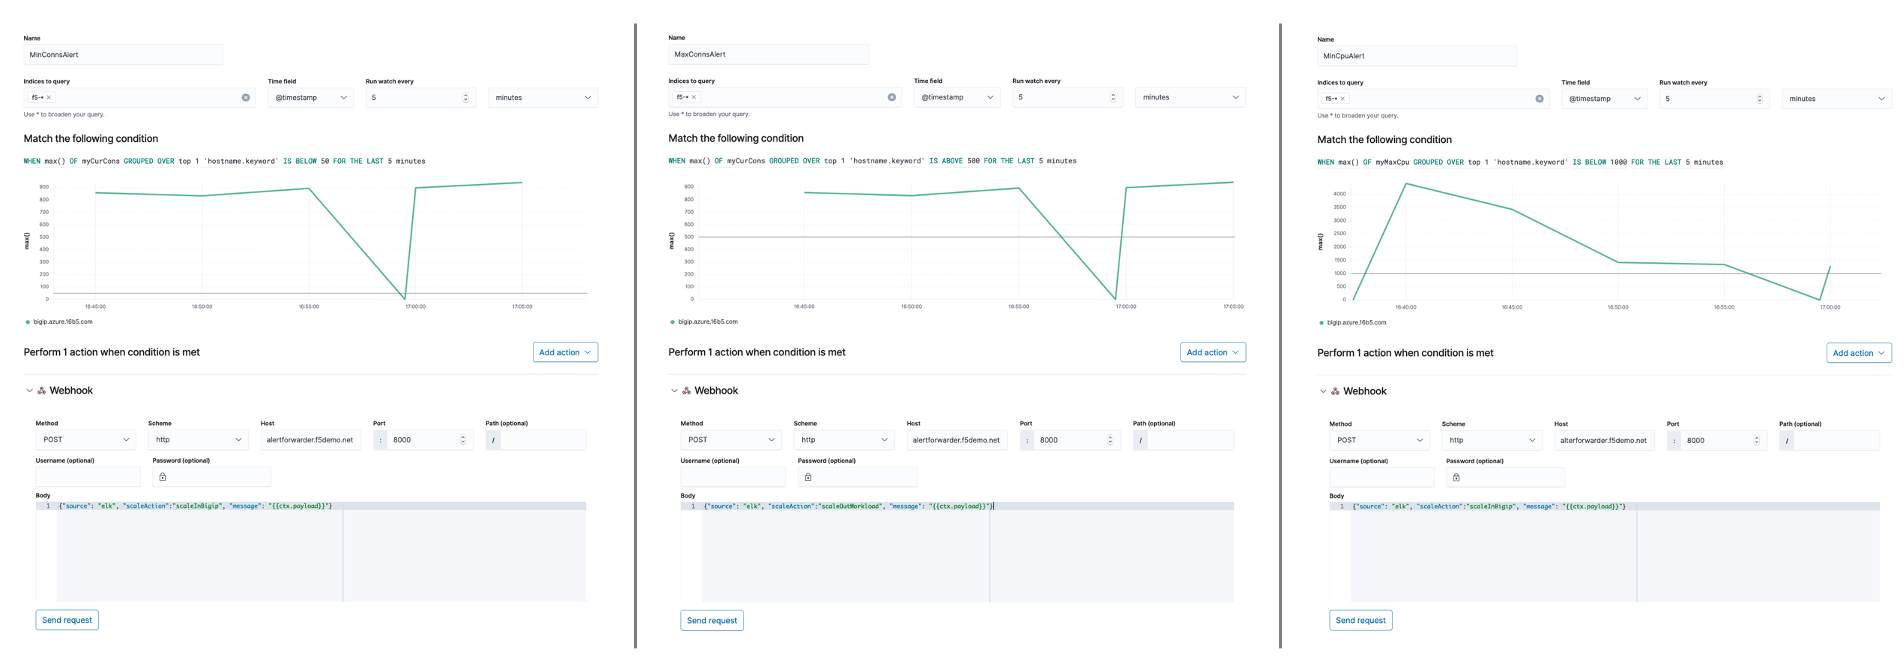
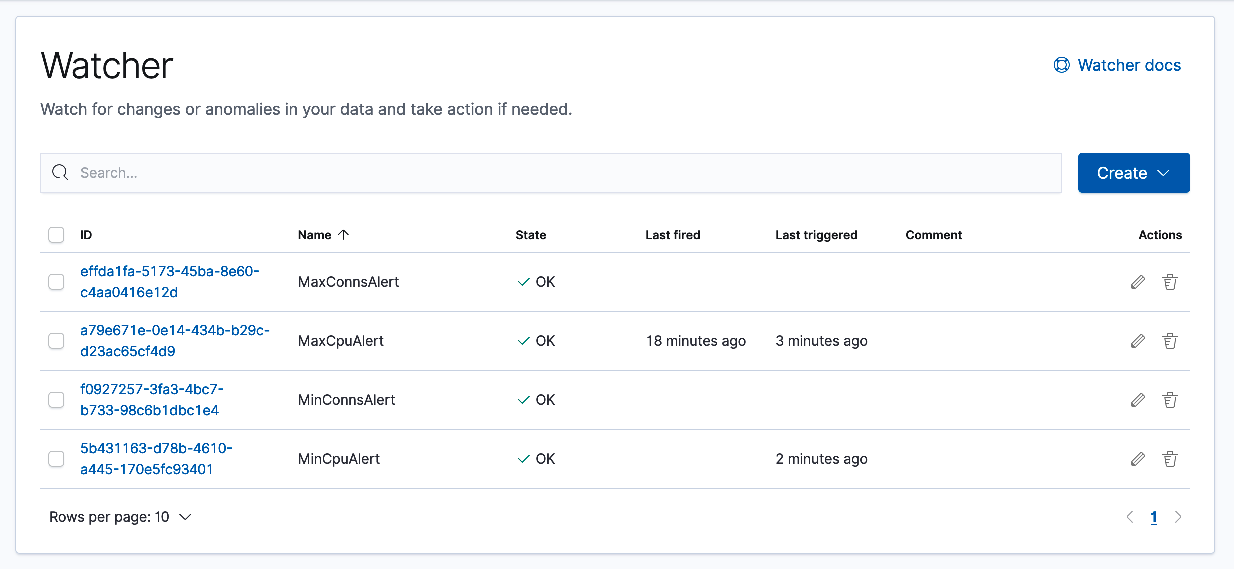
Below is an example of a completed Watcher screen. TS logs are streamed in 60-second intervals. Depending upon how you set your thresholds, you may already have alerts firing. The Watcher screen provides one way to monitor alert events. In the next section you will generate some traffic and monitor scaling events using your Consul server.
Lab Summary
- By successfully completing the previous exercises you will have:
- Configured Elastic (ELK) stack for telemetry ingestion
- Created four (4) alerts - (two alerts configured to monitor and trigger BIG-IP instance scaling, two alerts configured to monitor and trigger backend application pool scaling)
In the next lab, (Lab #3) you will generate application traffic and monitor for scaling events.