Automation, Orchestration & DevOps > Class 13: ADC Performance Monitoring and Autoscaling Lab Source | Edit on
Lab 3 - Generating Traffic and Monitoring Scaling Events
In this lab, you will use a traffic generator, (Locust) to generate traffic. Afterwards, you use your Consul server to view scaling logs entries and monitor service discovery.
Exercise 1 - Generate Traffic
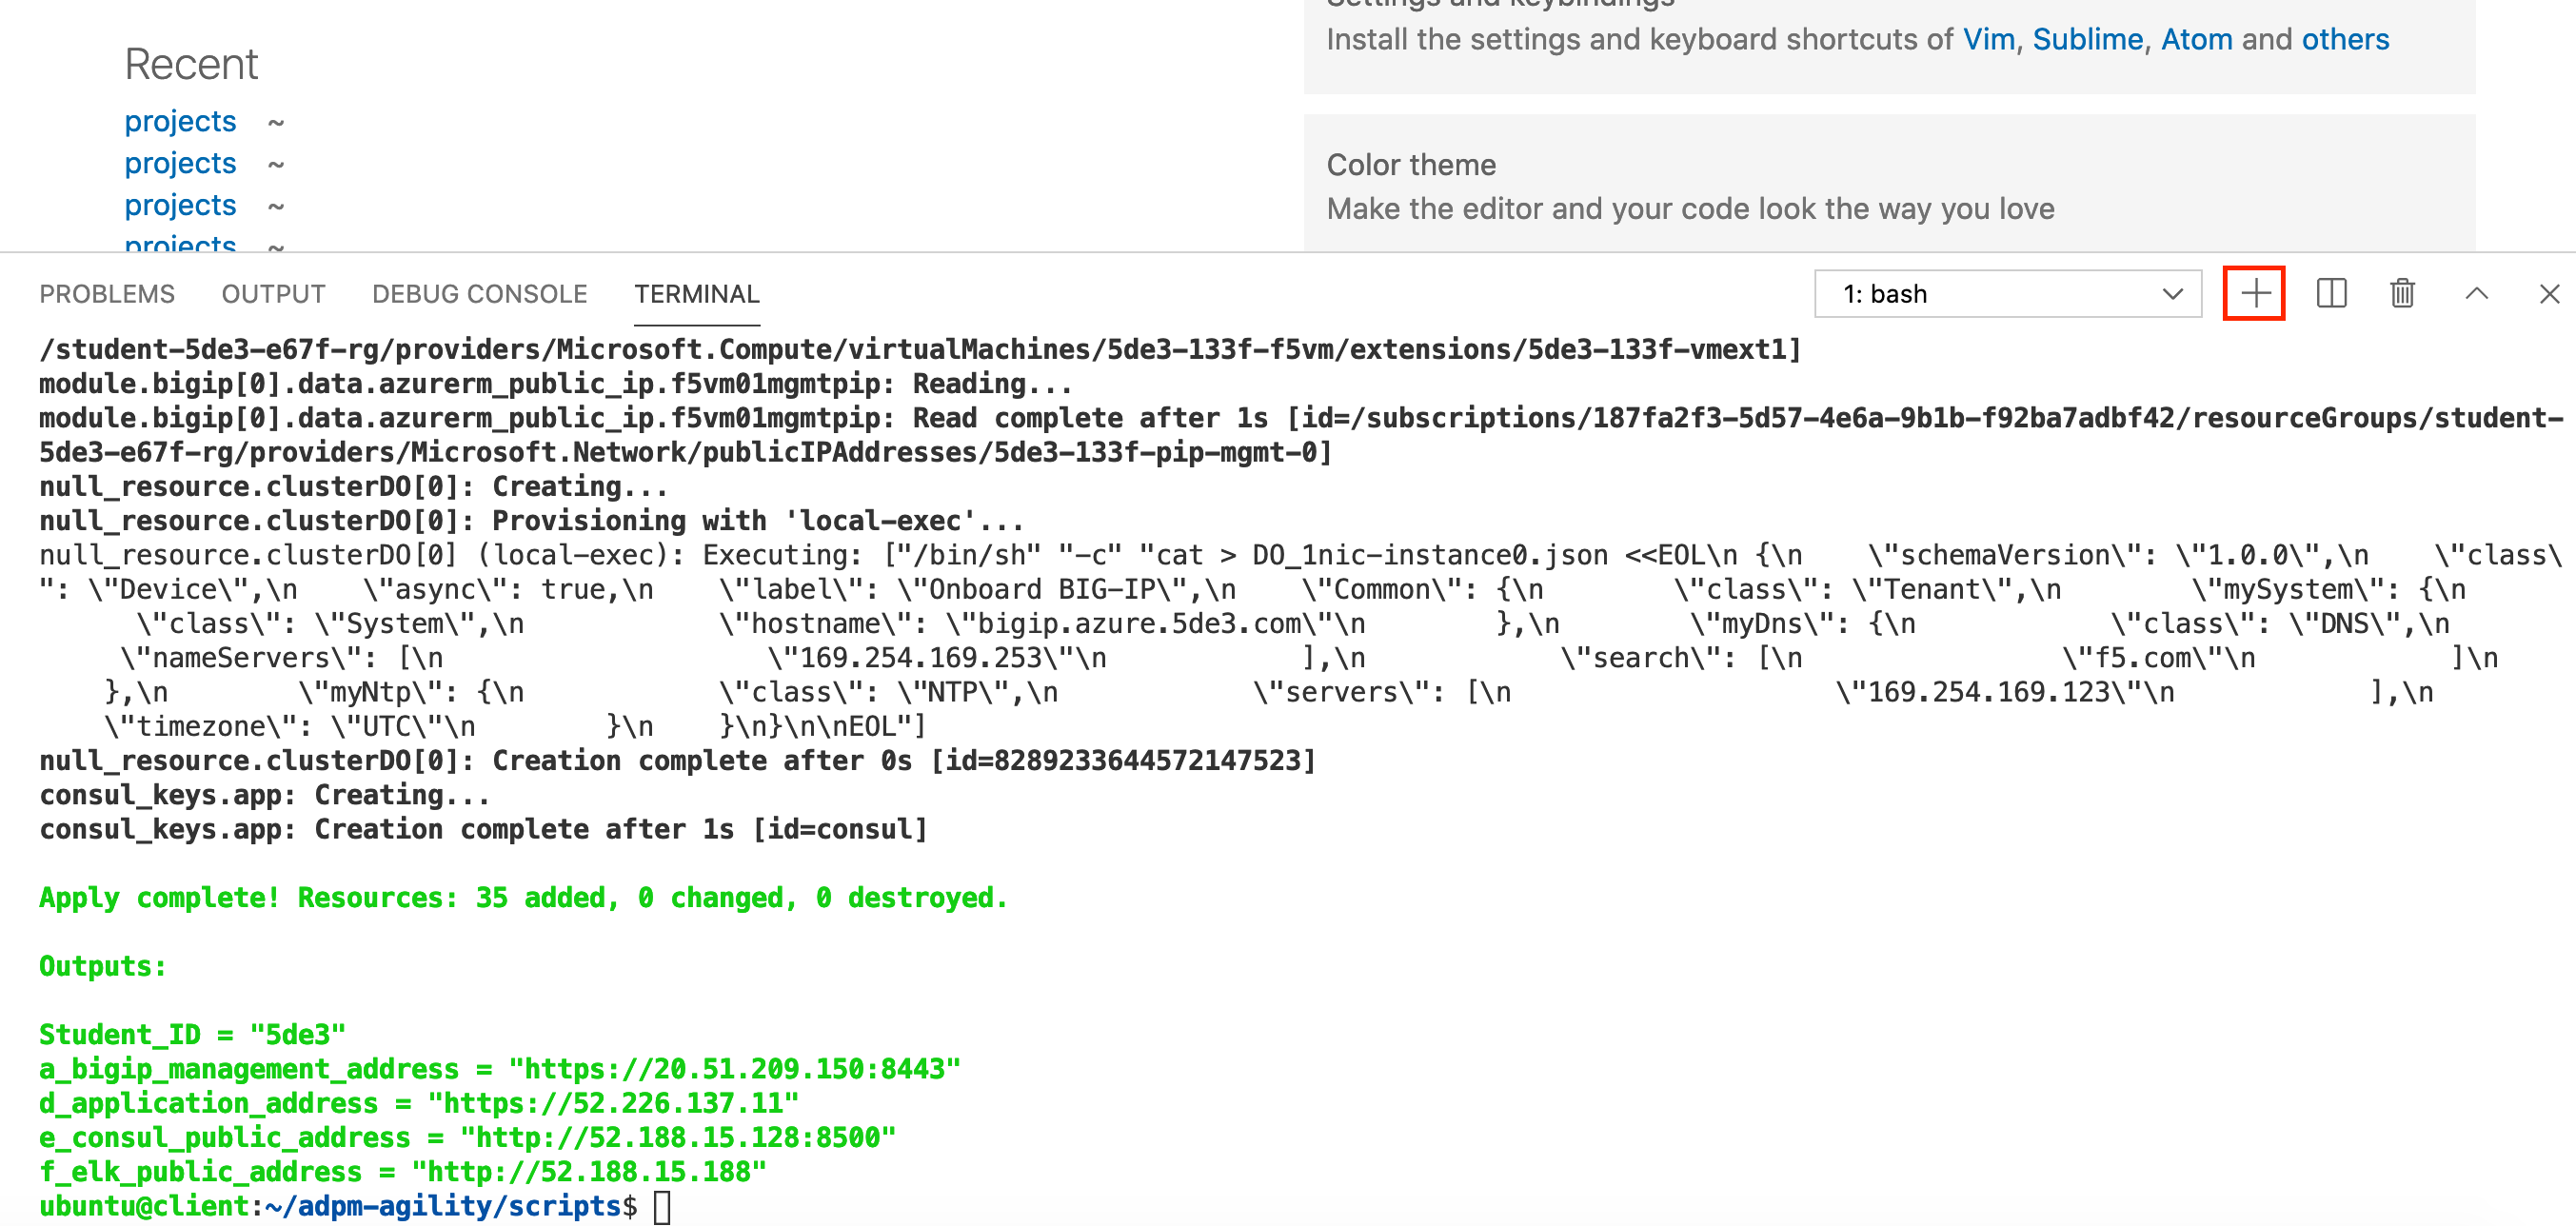
Before using Locust you must first start the locust application. From the VS Code browser tab open a new terminal window, (see below).
Using the new terminal window, navigate to the locust directory and clone the repo using the below commands.
cd /home/ubuntu/projects/locust && locust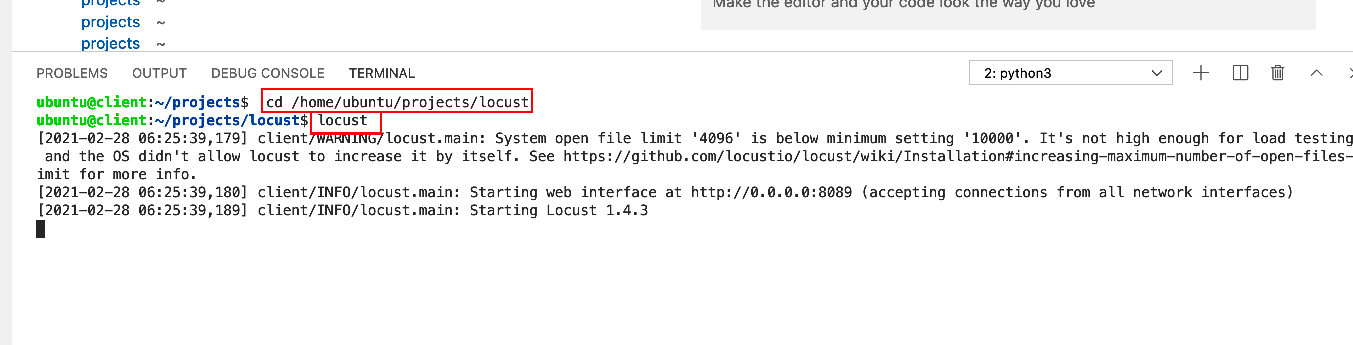
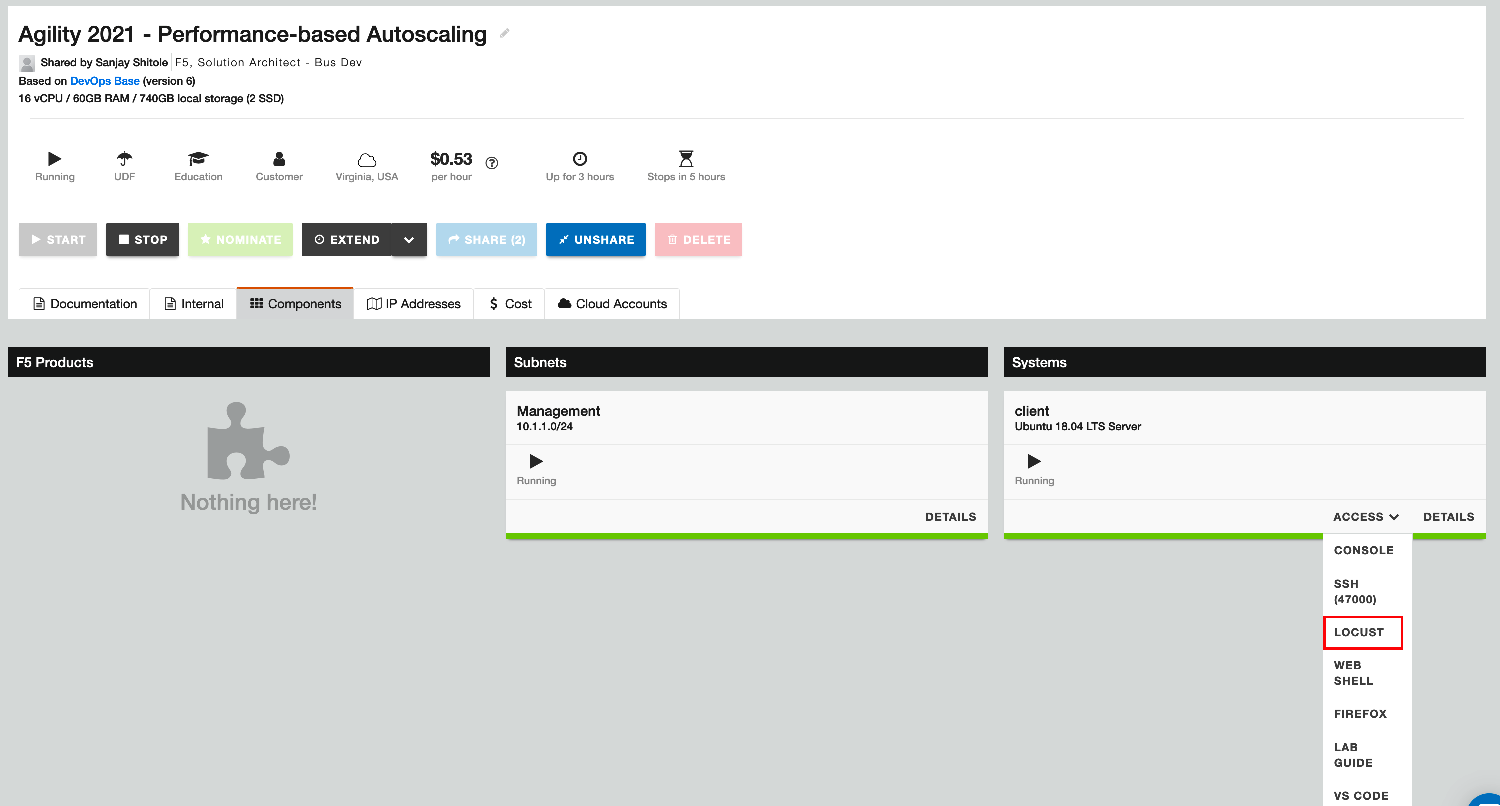
Now with Locust running, return to your UDF deployment tab and navigate to the client component. Select 'Locust' from the Access drop-down menu. A new browser tab, (Locust UI) will open.
On the Locust UI, enter amounts for Number of total users to simulate and Spawn rat. Enter the application address in host field; (if necessary refer back to the first terminal window).
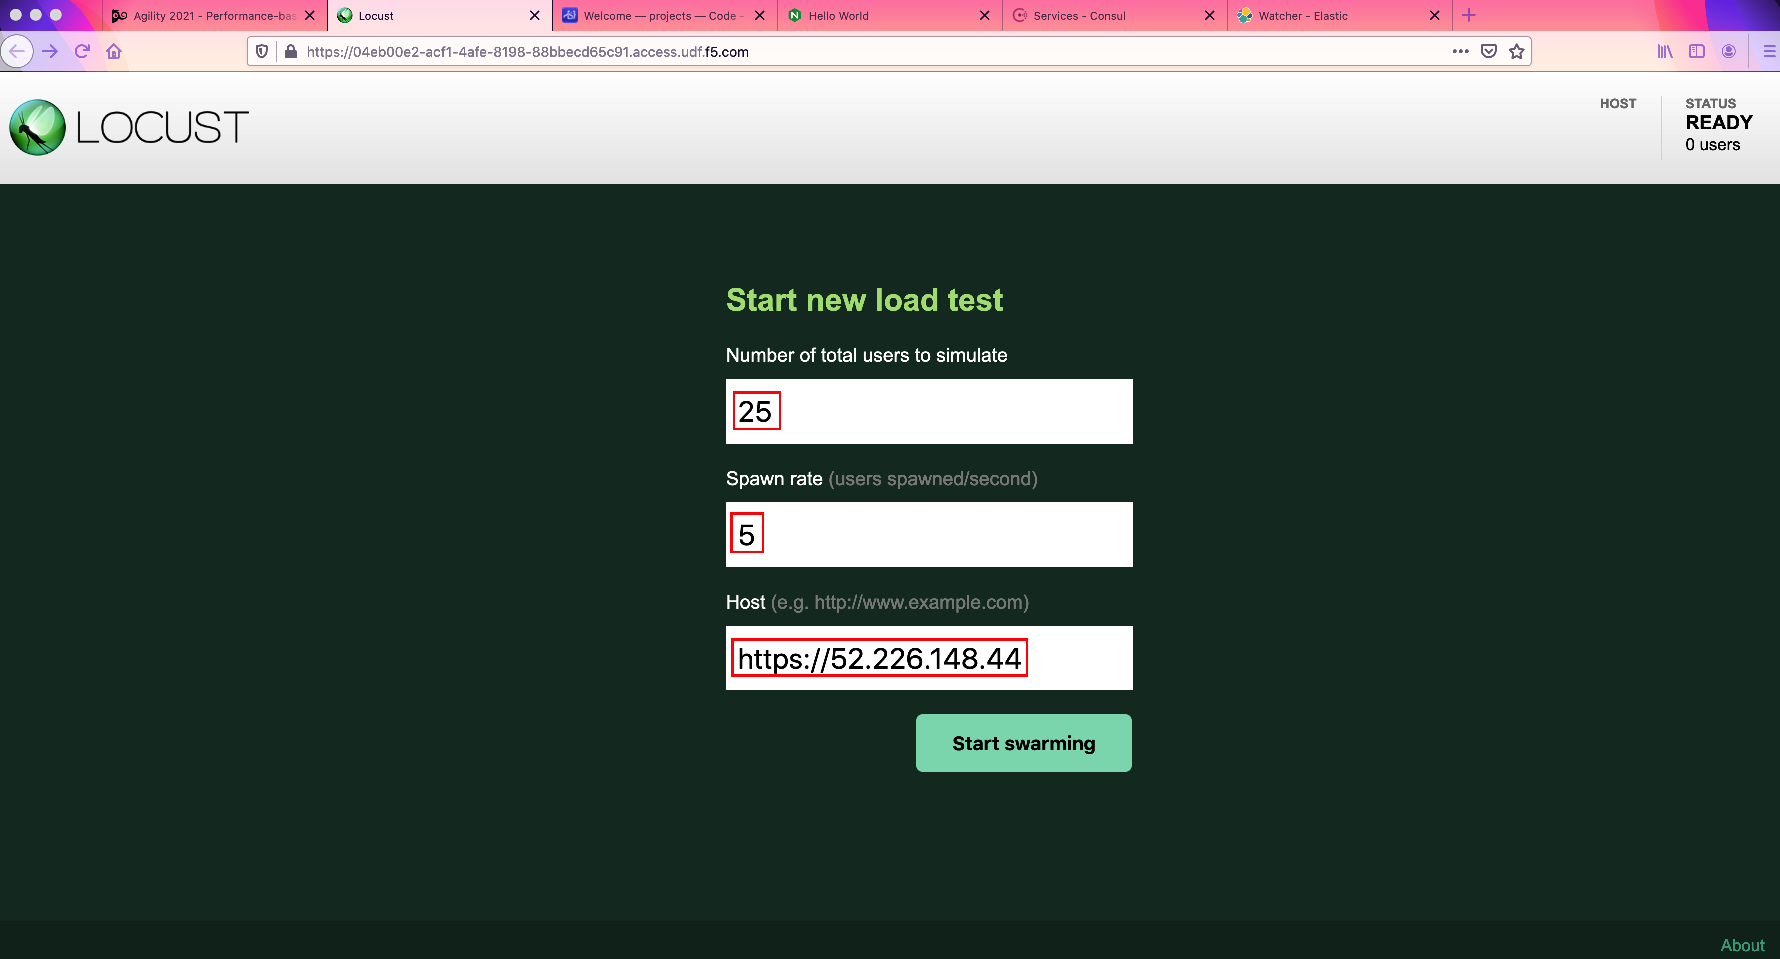
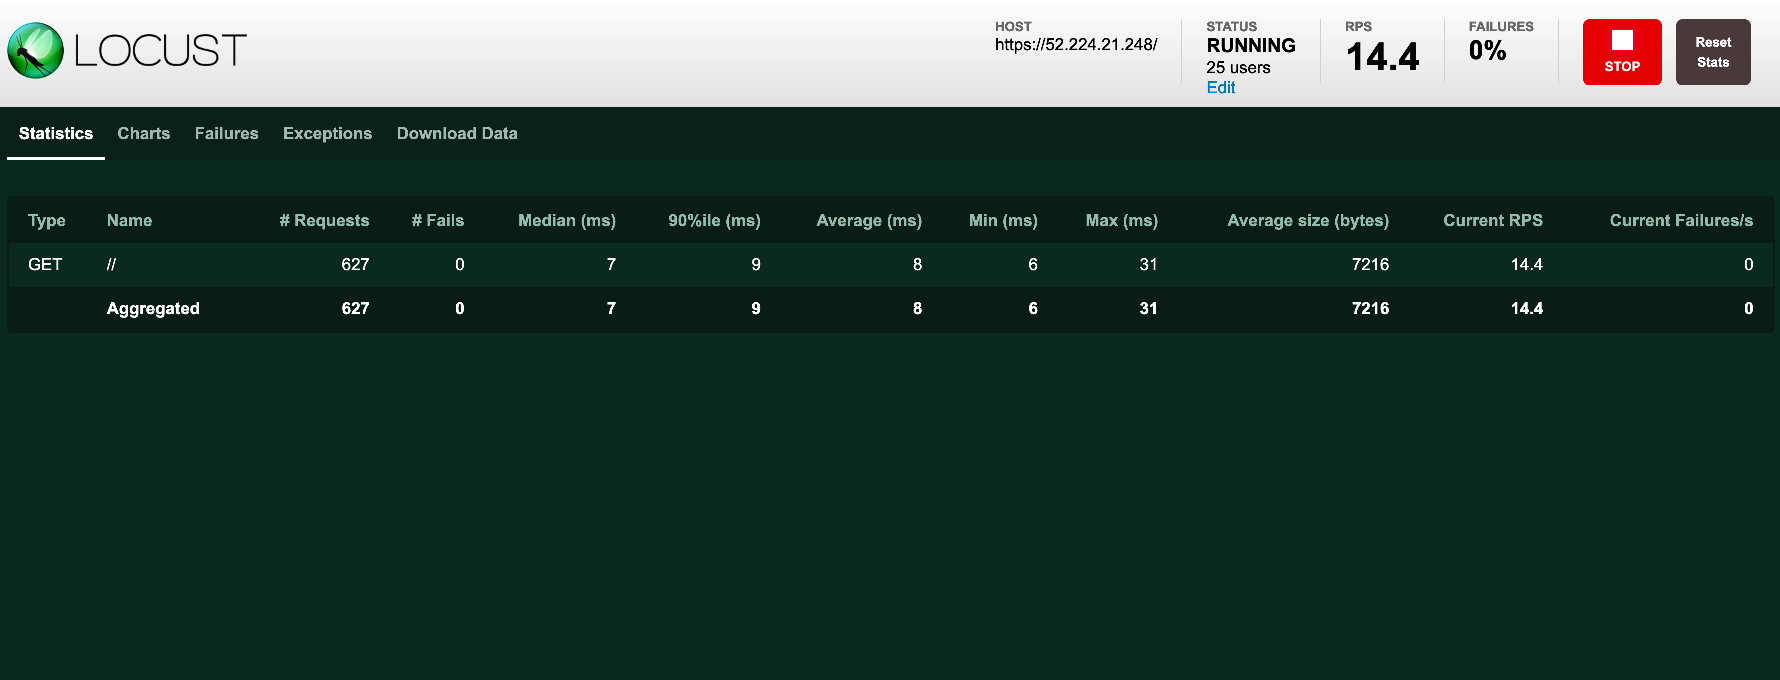
Select 'Start swarming' to begin traffic generation. You can monitor traffic generation from the statistics tab, (see below).
Exercise 2 - Monitor Scaling Operations
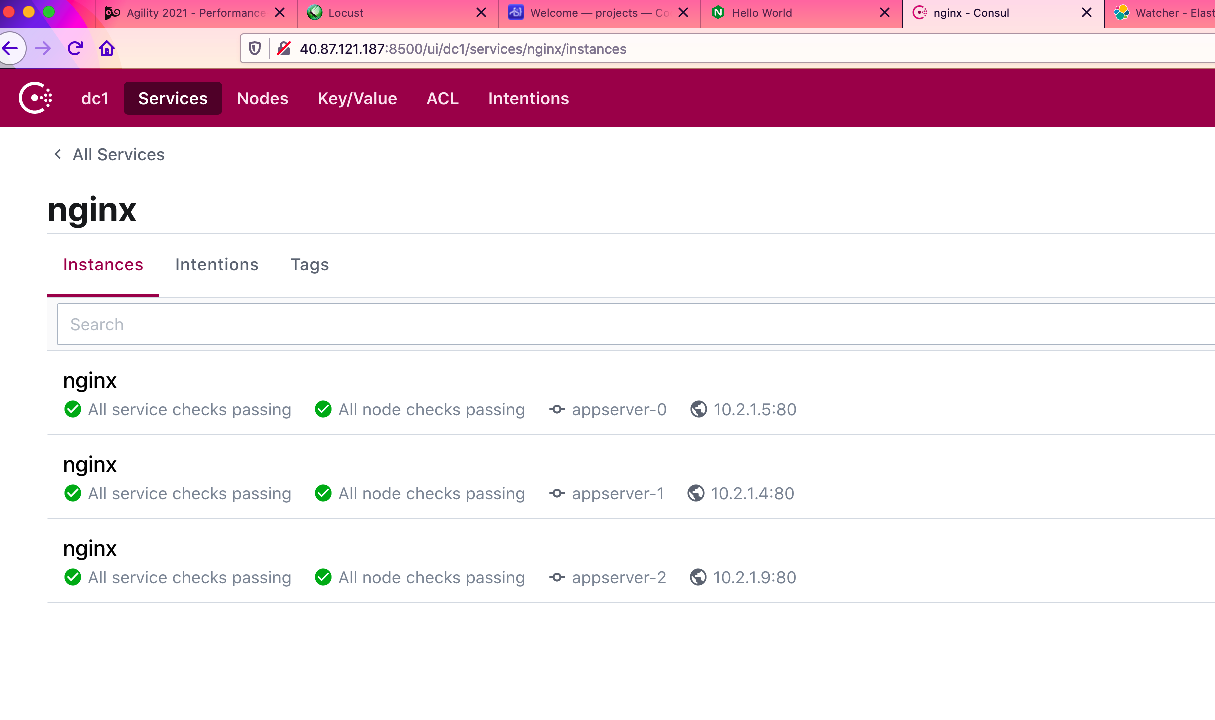
With traffic now flowing through to/from the application, you can now monitor for scaling events. Return to your Conul server and navigate to 'Services' tab and select the 'nginx' service. Depending upon how you set workload alert thresholds in the previous lab, you will see instances being added/removed from the service.
As the example shows below, the backend workloads have been scaled up to the maximum of three from the starting quantity of two, (2). For additional testing, you can return to the Kibana UI and modify alert thresholds and/or manually trigger alerts.
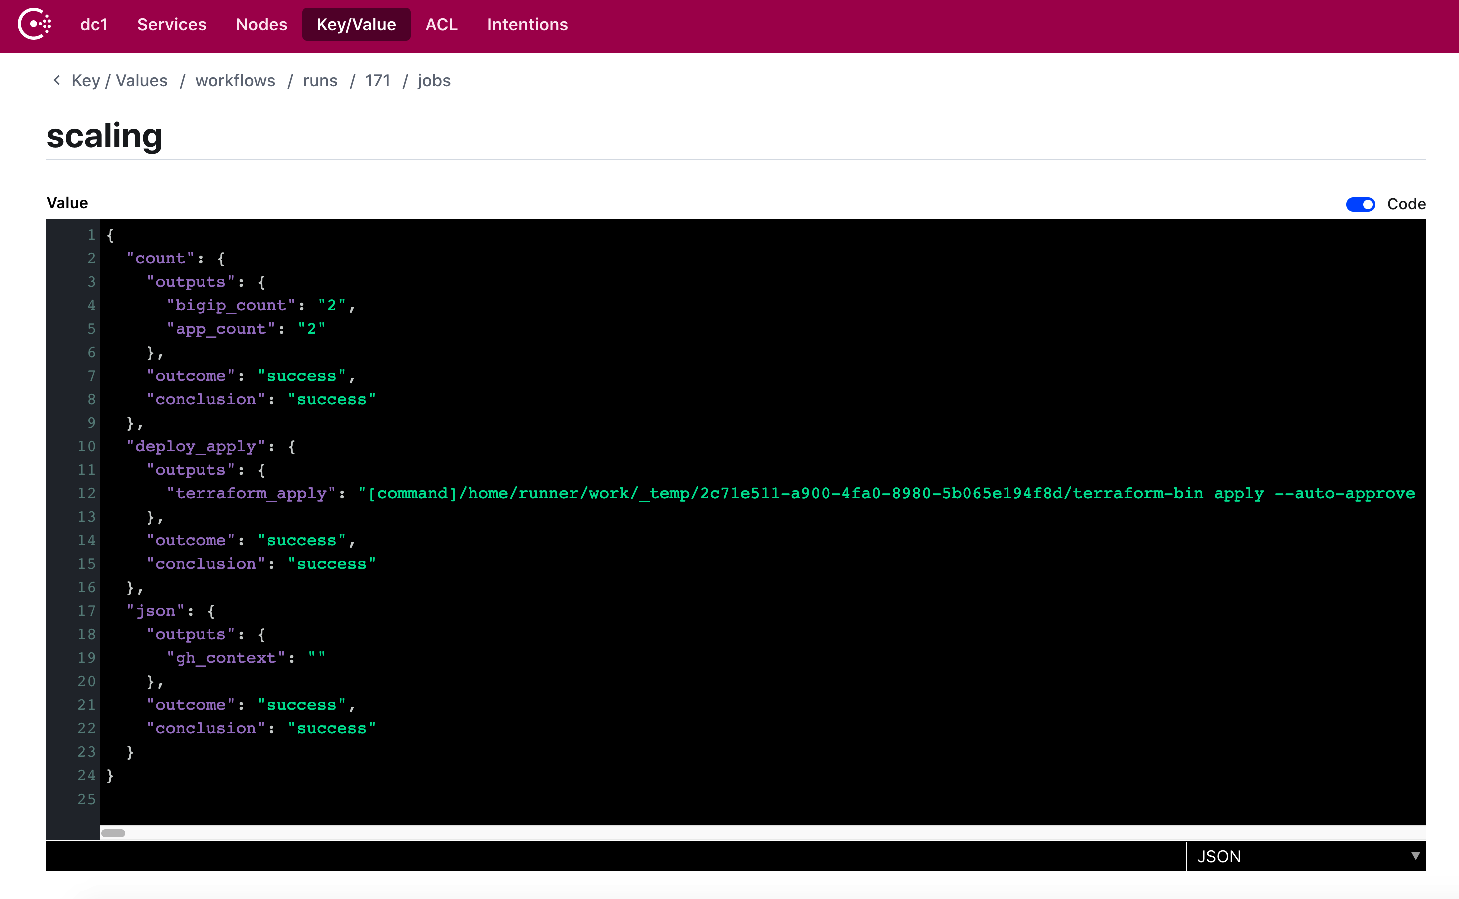
To monitor BIG-IP scaling operations, (along with workload scaling) from the Consul server navigate to the 'Key/Value' tab and transverse the tree to -
workflows/scaling_events/.As scaling events are run on the central ADPM processor, log entries are pushed to the local Consul Server. As the example shows below, scaling events are reported in JSON format. Navigate the listed jobs to review your scaling events. Additionally, the class instructors can review your deployments via the Azure portal.
Lab Summary
- By successfully completing the previous exercises you will have:
- Used Locust.io to generate application traffic load
- Used the BIG-IP and Hashicorp Consul server to monitor backend workload scaling
- Used Hashicorp Consul server to monitor scaling events, (BIG-IP and backend workloads)
This concludes the ADPM Performance-based Autoscaling lab.