NGINX Modern Apps > Class 5 - NGINX App Protect WAF & DoS Source | Edit on
Module 10 - Live Activity Monitoring with NGINX App Protect DoS Dashboard
Overview
NGINX App Protect DoS provides various monitoring tools for your application:
- The interactive DoS Dashboard page - a real-time live activity monitoring interface that shows status and information of your Protected Objects.
- NGINX App Protect DoS REST API - an interface that can obtain extended metrics information of your Protected Objects.
Example configuration
The DoS Dashboard has been enabled for this lab by specifying the /dashboard-dos.html location. By default the DoS Dashboard is located in the root directory (for example, /usr/share/nginx/html) specified by the root directive.
1 2 3 4 5 6 7 8 9 | server {
listen 80;
location /api {
app_protect_dos_api;
}
location = /dashboard-dos.html {
root /usr/share/nginx/html;
}
}
|
Accessing the Dashboard
Go to NAP DOS 1 VM, navigate to Access and select NAPDOS - Dashboard, then click Dos Protected Objects.
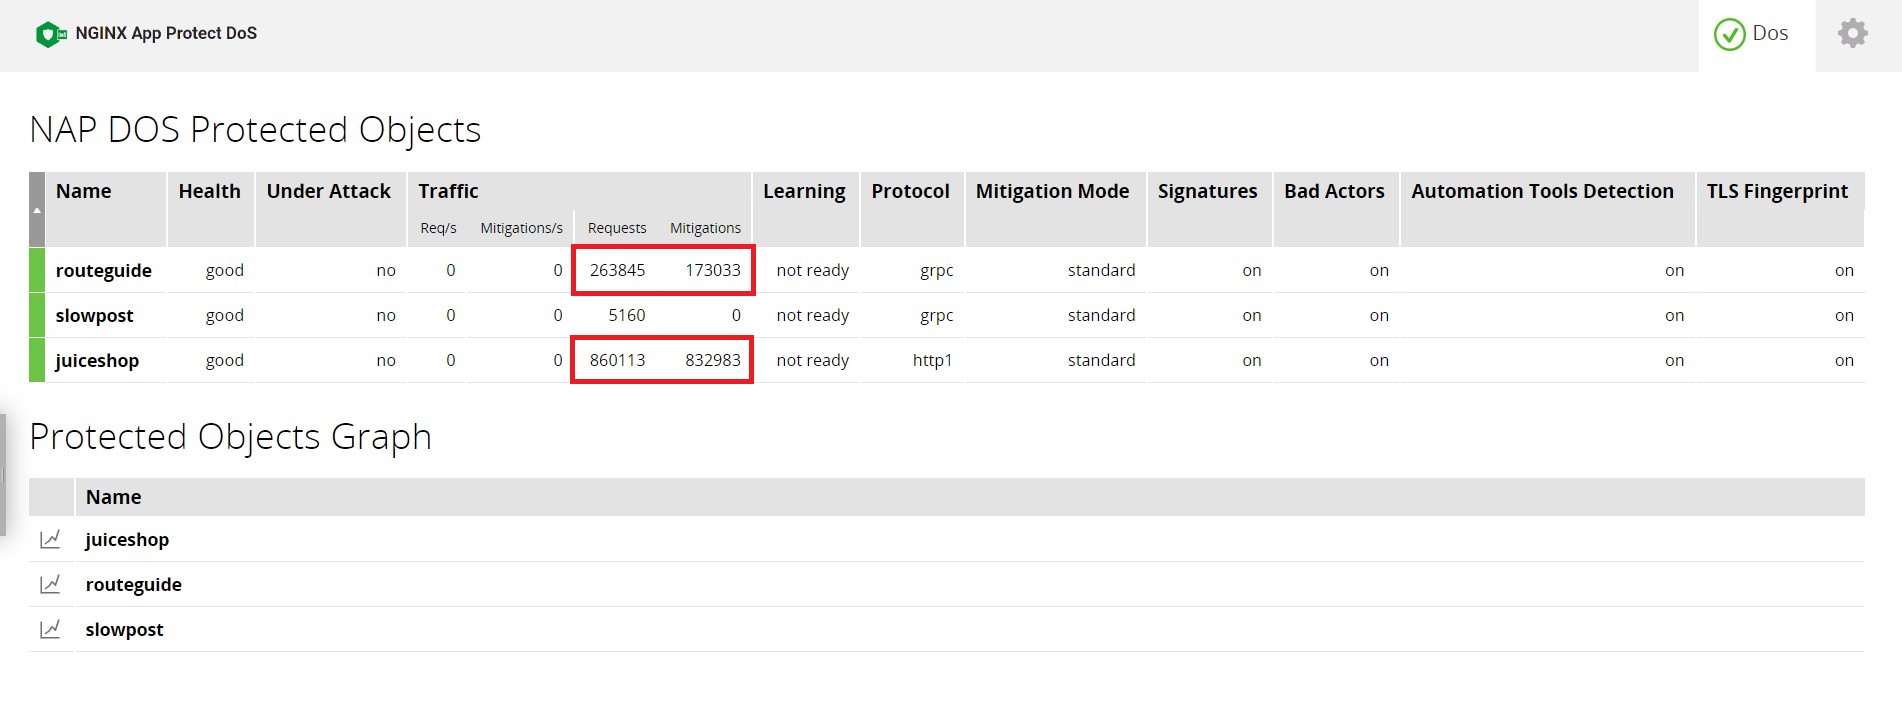
Tab Overview
The DoS tab provides statistics and configuration per each Protected Object.
Status indicators (colors - green / orange / red), one in the tab name, the other is in the table of protected objects, per protected object.
The logic for the colors is as follows:
- green - no attack, s/h < 0.9
- yellow - under attack, s/h < 1 or no attack ,s/h > 0.9 and < 1
- red - under attack S/H >= 1