NGINX Modern Apps > Class 5 - NGINX App Protect WAF & DoS Source | Edit on
Module 9 - Protecting HTTP and gRPC Services from Application Layer DoS Attacks
Launch HTTP Flood Attack
We will be initiating a HTTP Flood Attack on the Juice Shop web site using Apache Benchmark.
- Open WebShell to the Attack Traffic Generator VM (UDF > Components > Systems > Attack Traffic Generator > Access > Web Shell). Position this tab side-by-side with the Legitimate Traffic Generator WebShell tab that is already open so you can see both WebShells at the same time.
- Launch L7 DoS attacks in the Attack Traffic Generator WebShell.
/scripts/http1flood.sh
- Re-open and re-launch the good traffic generator in the Legitimate Traffic Generator WebShell.
/good.shThe good traffic script will report that the service is available:
JUICESHOP HTTP Code:200
Finished trip with 10 points

JUICESHOP HTTP Code:200
Finished trip with 10 points

JUICESHOP HTTP Code:200
Finished trip with 10 points
Note
Upon initial launch of the http1flood.sh script, on the legitimate traffic terminal buffer you may see the following indicator of service disruption in the output of the legit traffic output prior to NAP-DoS mitigation. If you do not see this, it’s likely that mitigation occurred very quickly, and it has already scrolled off of the terminal output.
Finished trip with 10 points

Finished trip with 10 points

Finished trip with 10 points

JUICESHOP HTTP Code:000
JUICESHOP HTTP Code:000
JUICESHOP HTTP Code:000
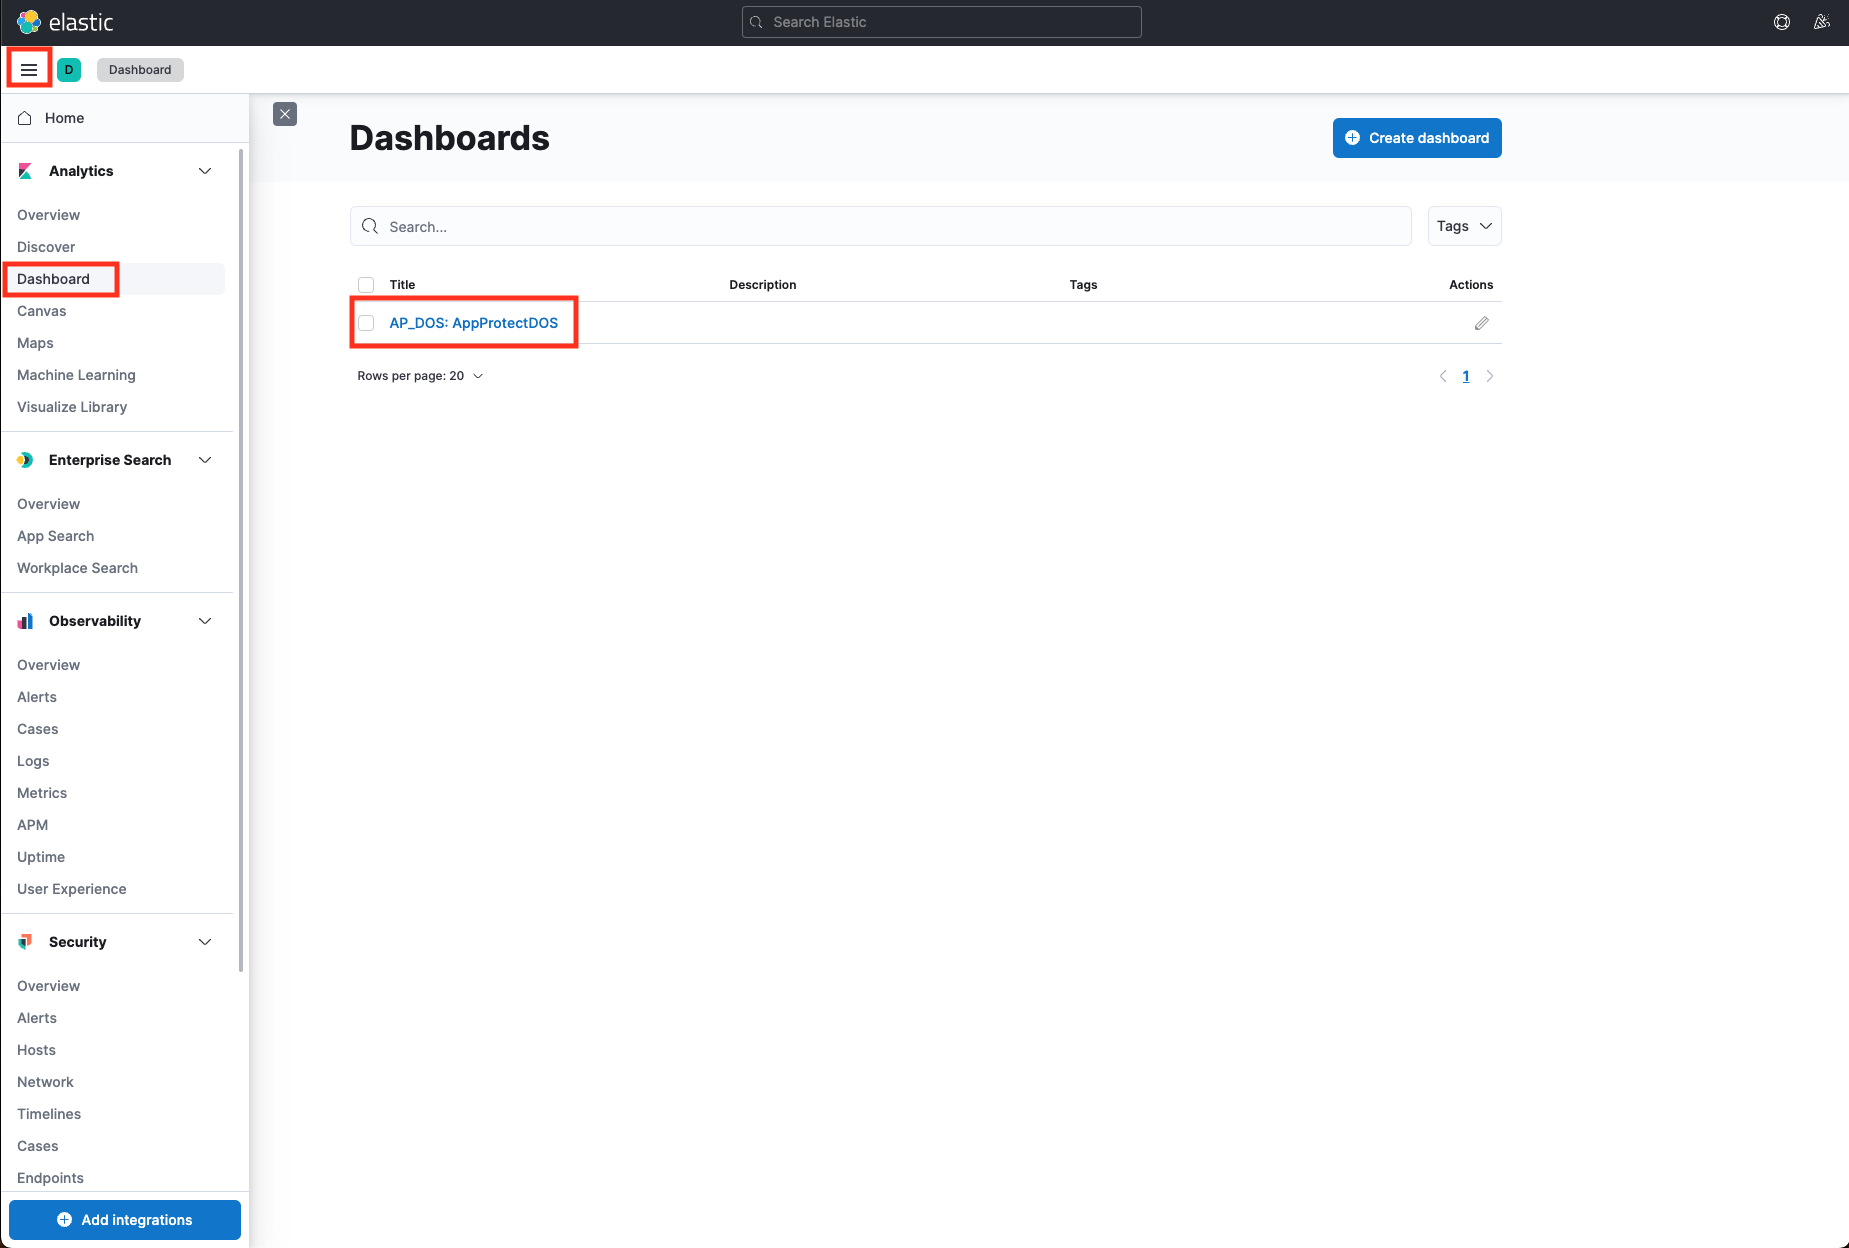
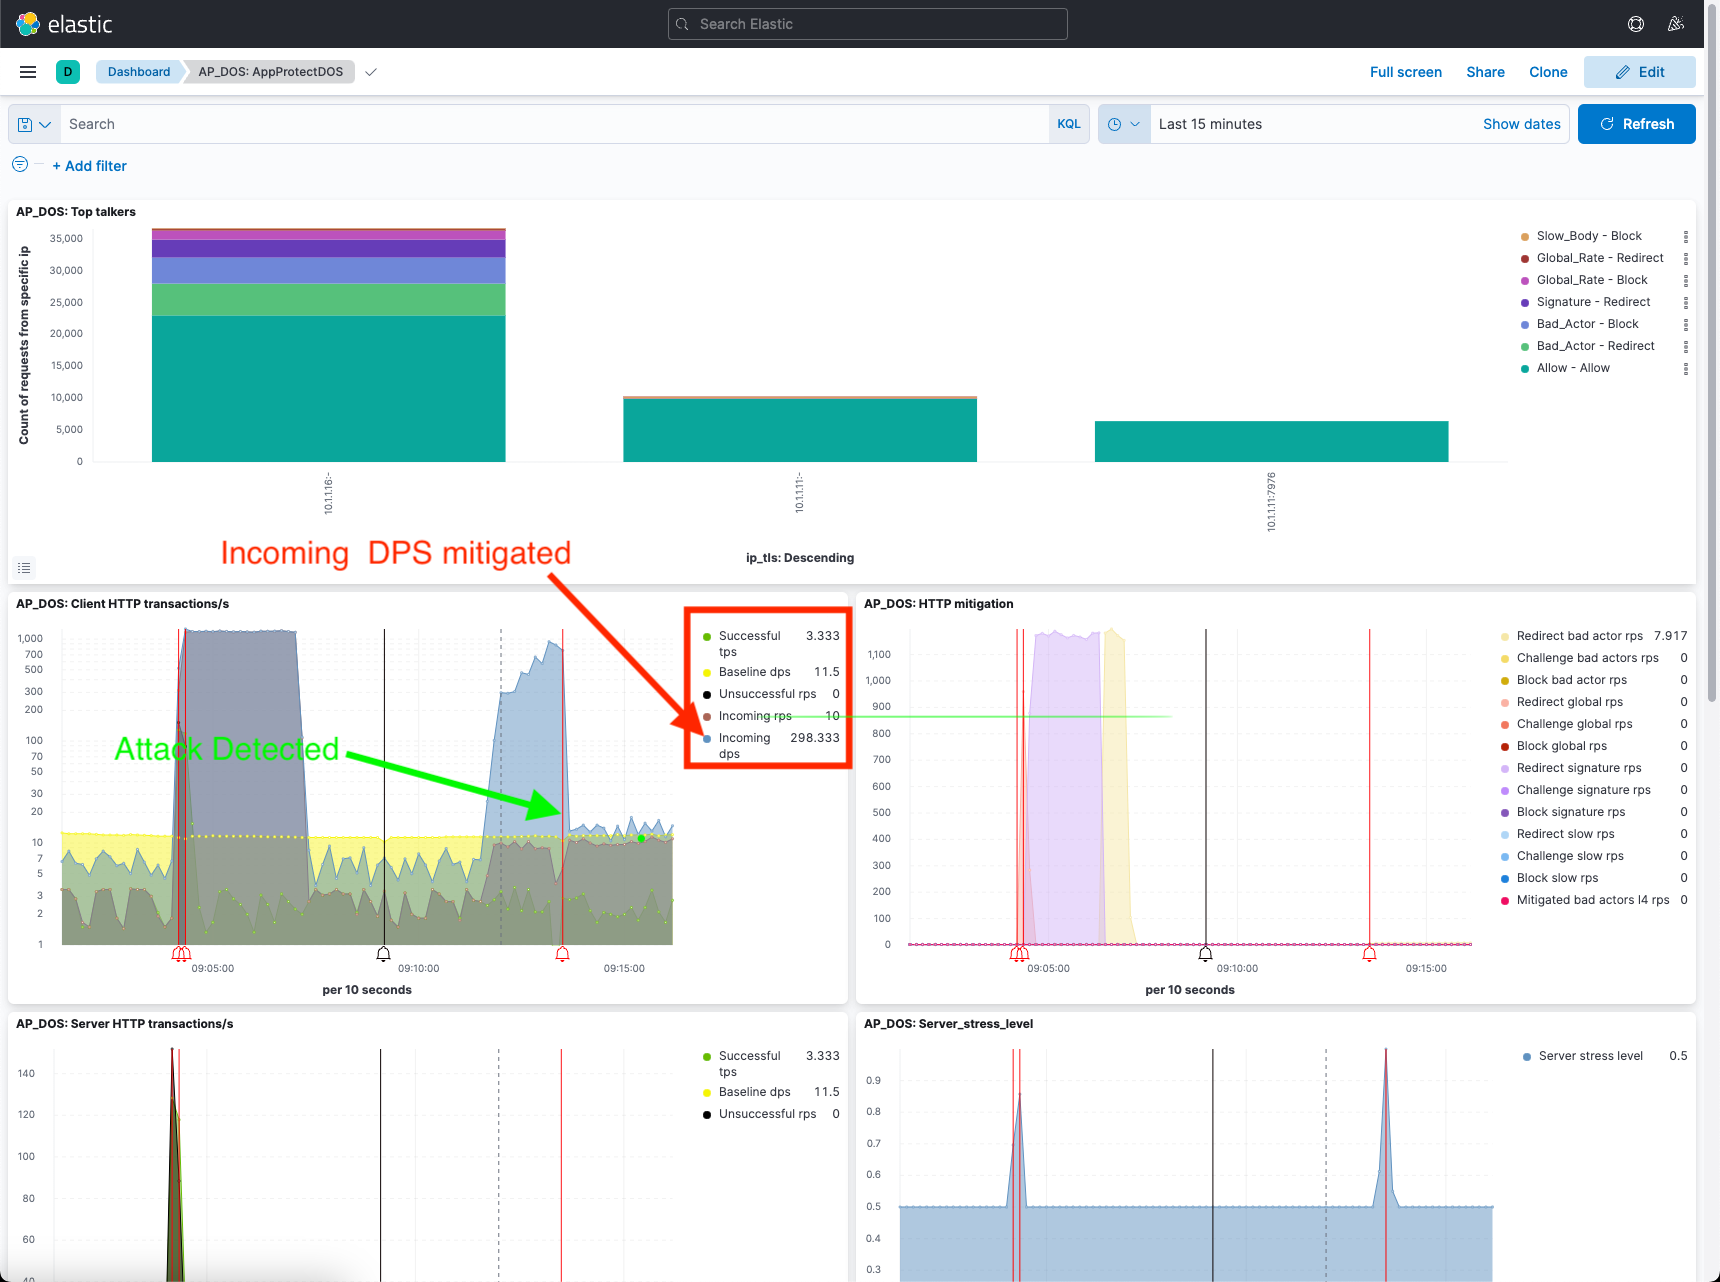
- Re-open the Kibana tab.
- Click on the three lines in the far right corner, select Dashboard, then click AP_DOS_AppProtect.
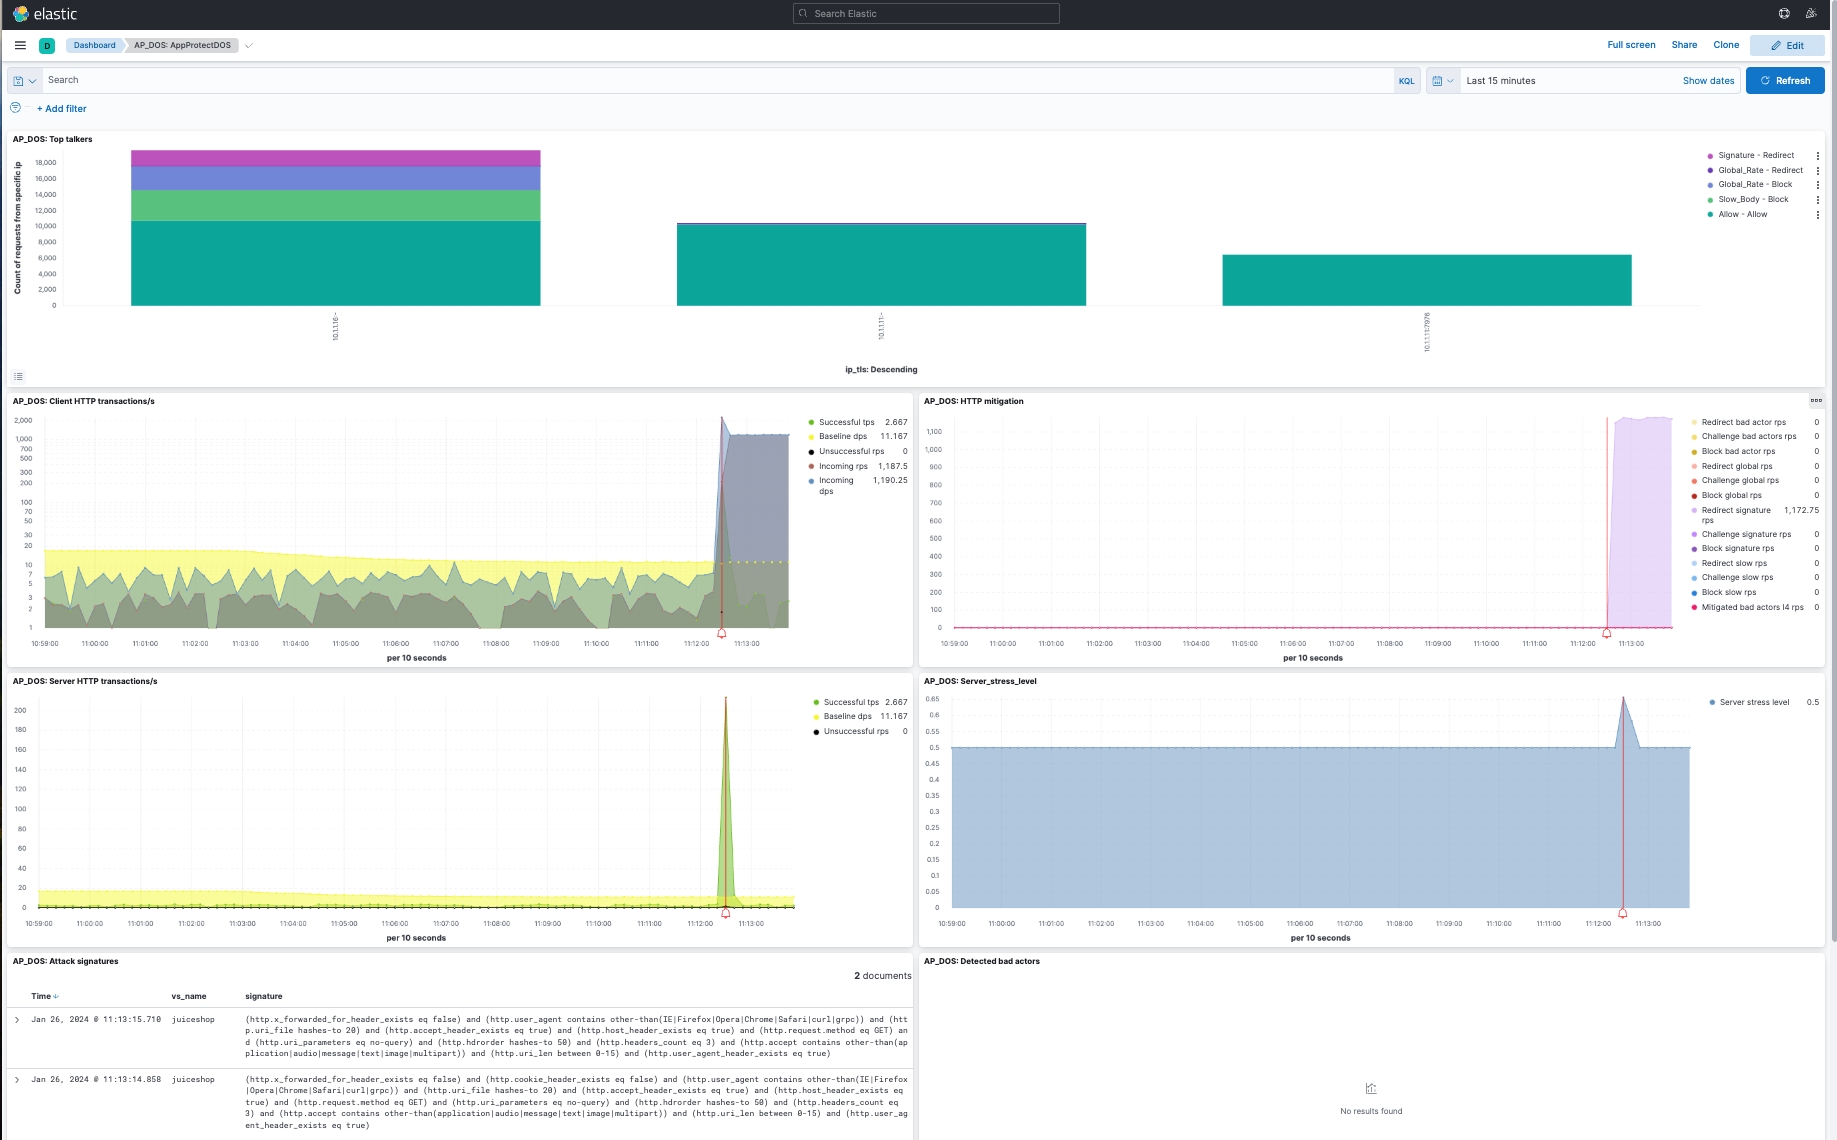
- As evidence of successful mitigation, the good traffic script will continue to report that the service is available as seen below. However, you can see the attack detected in the AP_DOS:HTTP mitigation chart as seen above (the vertical red line on the chart).
Output:
JUICESHOP HTTP Code:200
Finished trip with 10 points

JUICESHOP HTTP Code:200
Finished trip with 10 points

JUICESHOP HTTP Code:200
Finished trip with 10 points
- Press Ctrl+C on the Attack Traffic Generator VM to stop the attack script. Leave the good script running.
Note
Click the refresh button several times after stopping the attack script and wait for the vertical black line in the ELK Dashboard before running the next attack script. The vertical black line indicates that the attack has stopped.
Perform Slow HTTP Attack with slowhttptest tool
Slow HTTP attacks rely on the fact that the HTTP protocol, by design, requires requests to be completely received by the server before they are processed.
If an HTTP request is not complete, or if the transfer rate is very low, the server keeps its resources busy waiting for the rest of the data.
If the server keeps too many resources busy, this creates a denial of service.
We will demonstrate a Slow POST attack using slowhttptest tool.
Slow POST attack: Slowing down the HTTP message body, making the server wait until all content arrives according to the Content-Length header; or until the final CRLF arrives.
- Open WebShell into “Attack Traffic Generator (10.1.1.16)” VM (UDF > Components > Systems > Attack Traffic Generator > Access > WebShell)
- Launch Slow POST Attack
cd /scripts
./slow_post_http1.sh
Wait a few mins until the script establishes 4-5k connections.
As evidence of successful mitigation, the good traffic script will continue to report that the service is available.
Output:
JUICESHOP HTTP Code:200
Finished trip with 10 points

JUICESHOP HTTP Code:200
Finished trip with 10 points

JUICESHOP HTTP Code:200
Finished trip with 10 points
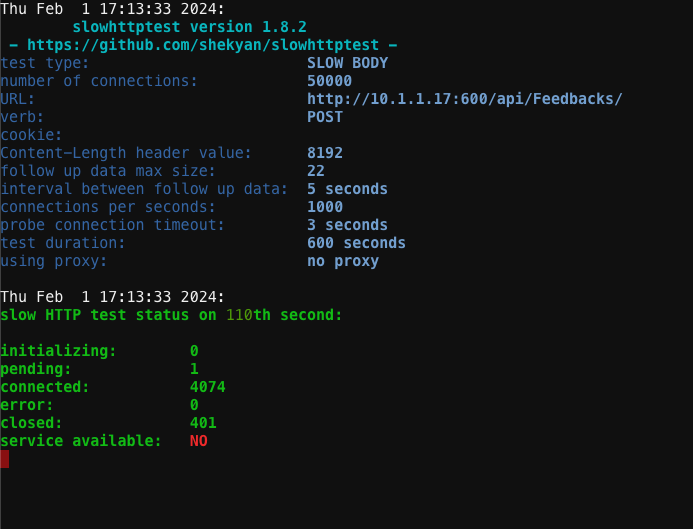
Slowhttptest will report that NGINX App Protect DoS is closing the connections similar to below:
- Open the Kibana tab to verify that NGINX App Protect DoS is mitigating the attack. Click on the three lines in the far right corner, select Dashboard, then click AP_DOS_AppProtect.
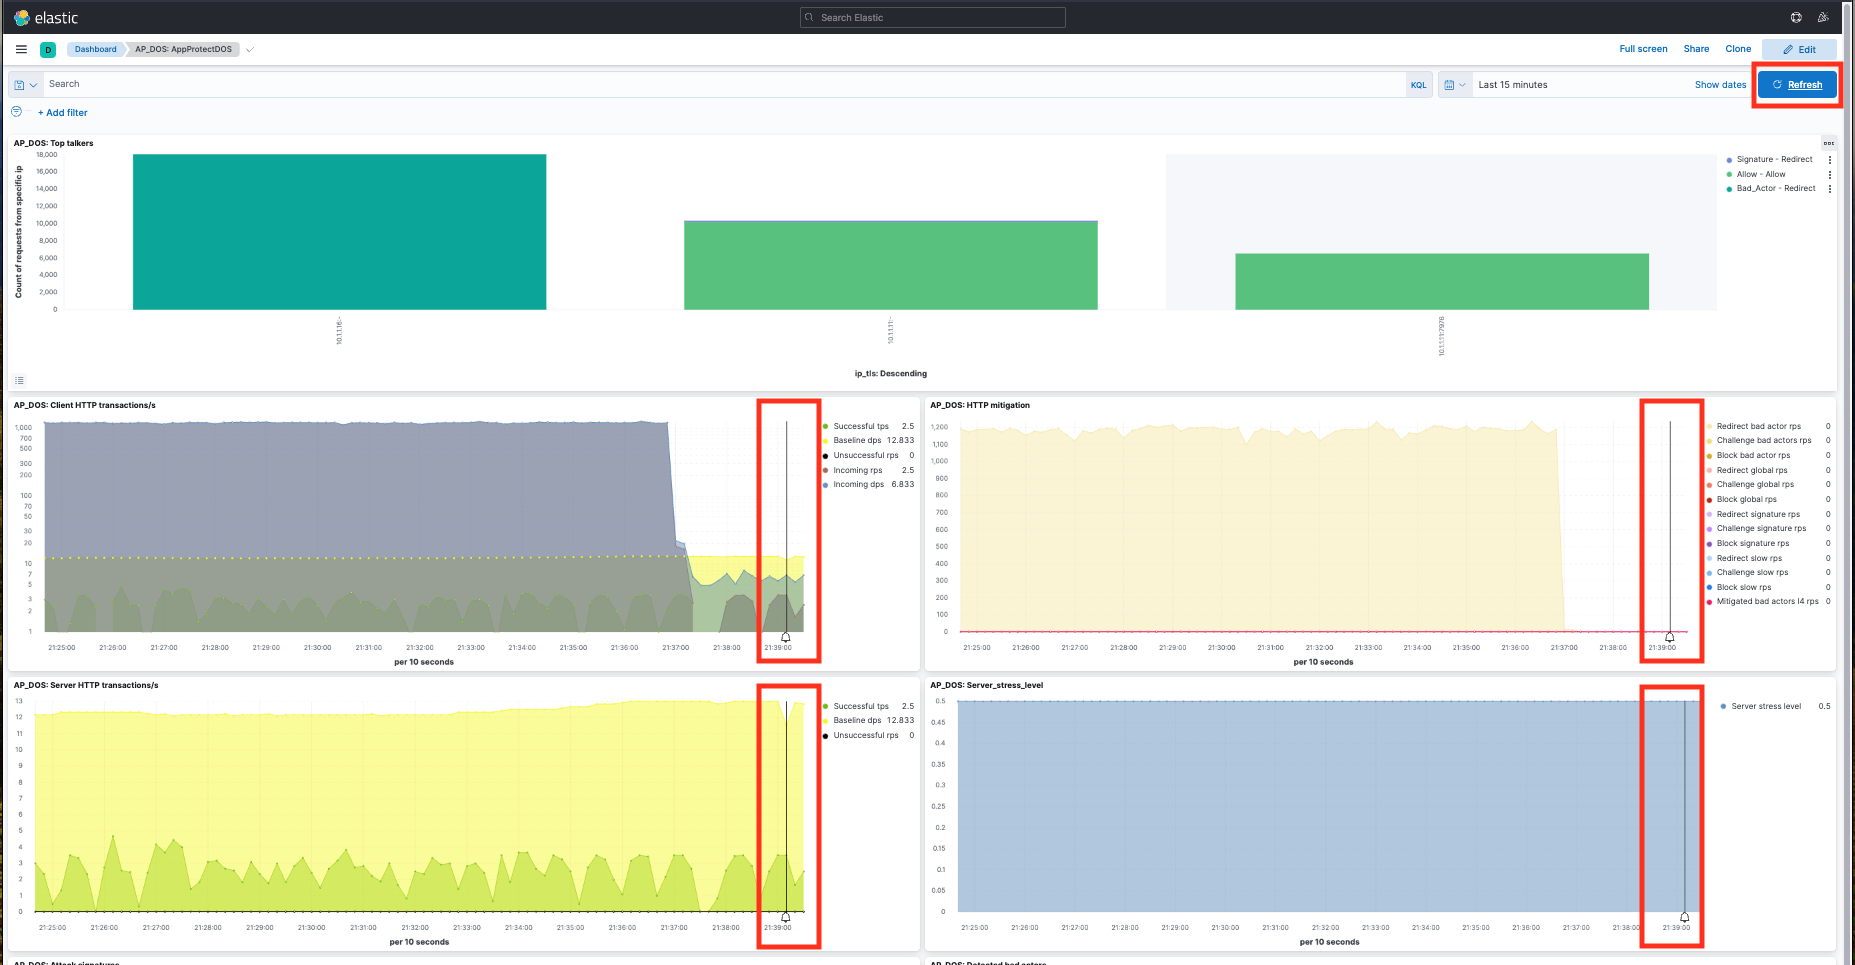
- Click the refresh button at the top left of the page. Review the output of the AP_DOS: Client HTTP transactions/s pane.
- Stop the attack. Use Ctrl+C.
Note
Wait for the vertical black line in the AP_DOS: Client HTTP transactions/s graph in the ELK Dashboard before running the next attack script.
Launch HTTP/2 Flood attack on gRPC service
We will be initiating a HTTP/2 Flood Attack on the “RouteGuide GRPC service” using h2load.
- SSH (WebShell) into “Attack Traffic Generator (10.1.1.16)” VM.
- Launch HTTP/2 Flood Attack.
cd /scripts/
./http2flood.sh
As evidence of successful mitigation, the good traffic script will continue to report that the service is available.
Output:
JUICESHOP HTTP Code:200
Finished trip with 10 points

JUICESHOP HTTP Code:200
Finished trip with 10 points

JUICESHOP HTTP Code:200
Finished trip with 10 points
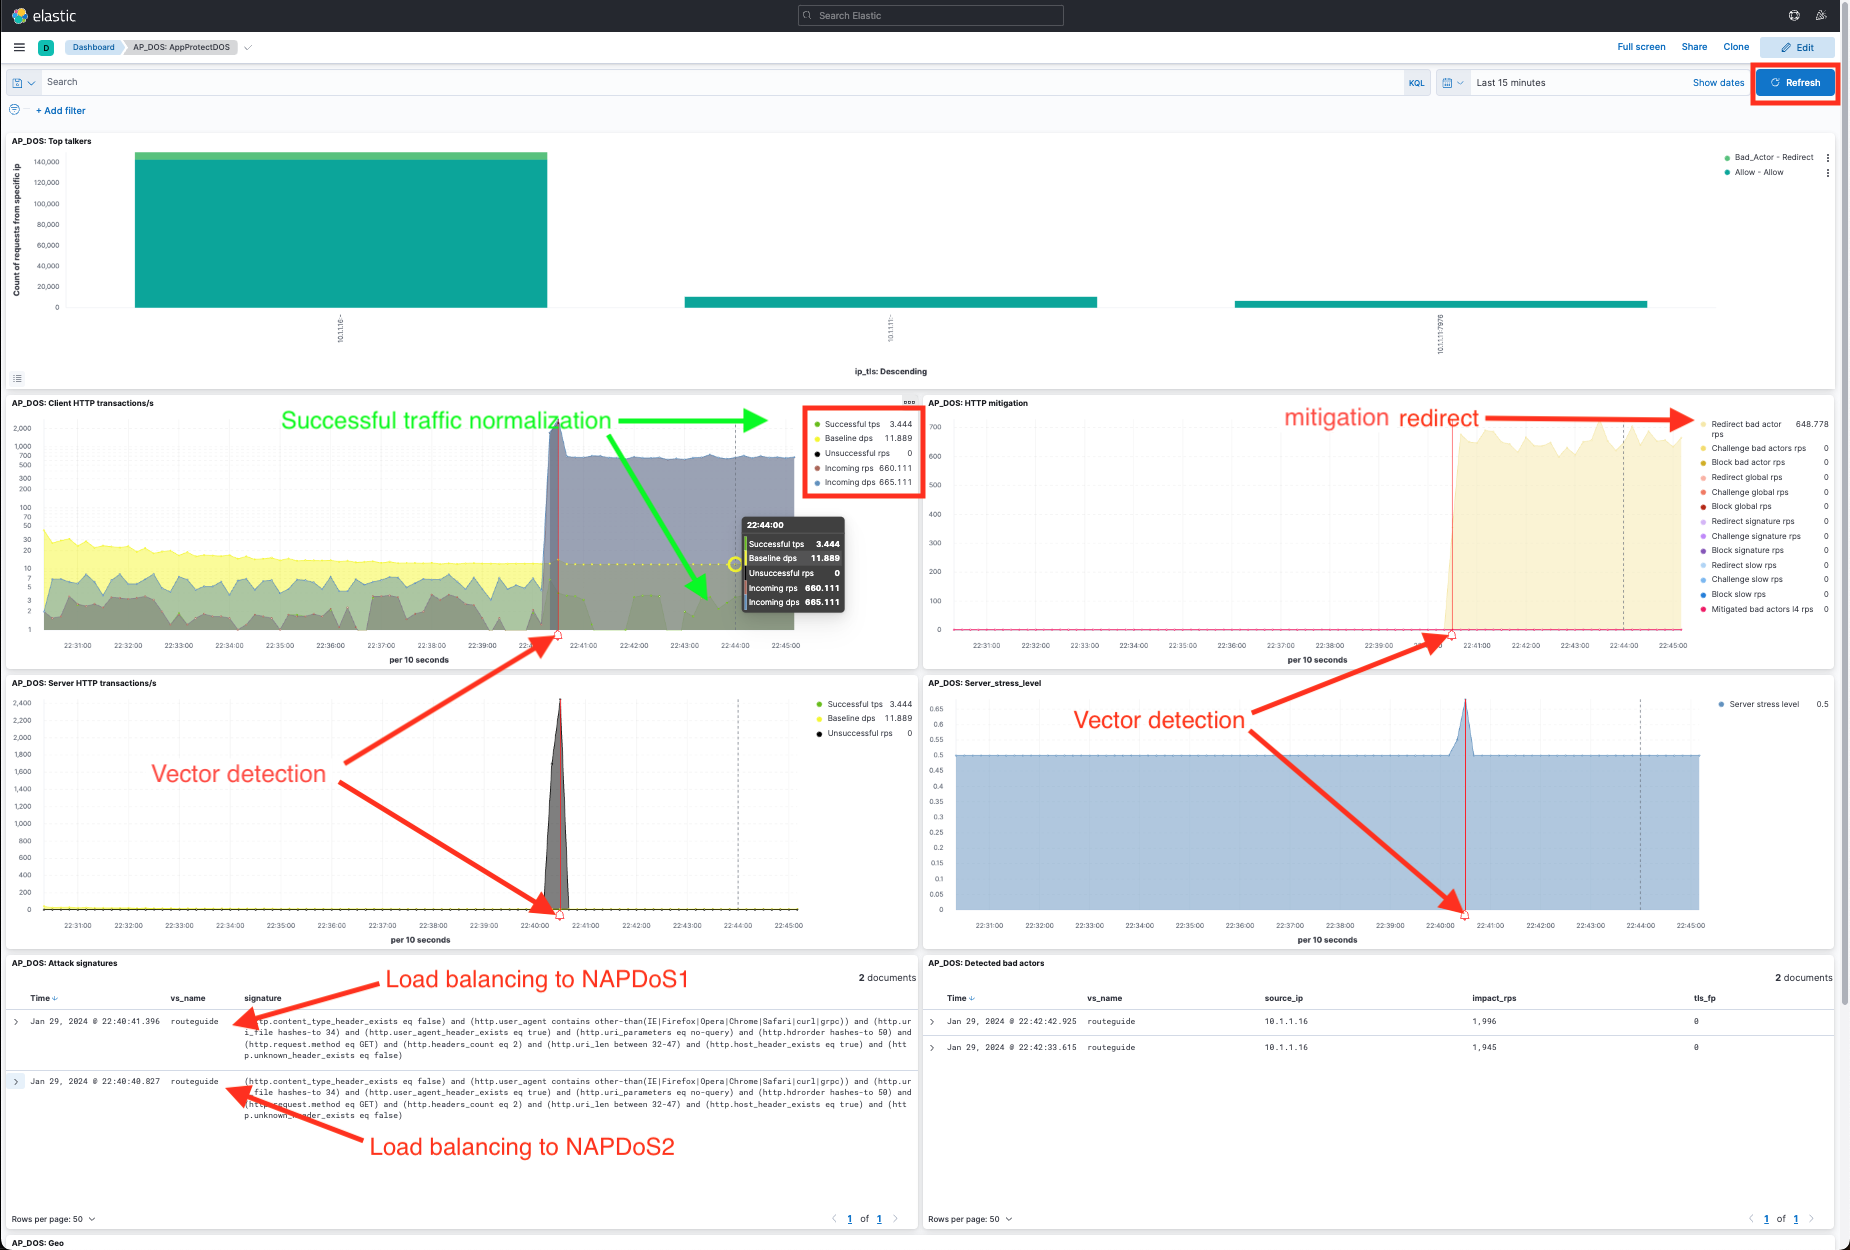
- Open the Kibana tab to verify that NGINX App Protect DoS is mitigating the attack. Click on the three lines in the far right corner, select Dashboard, then click AP_DOS_AppProtect.
- Click the refresh button. You should see a spike in traffic highlighted by a red line in the Client HTTP transactions/s, HTTP mitigation, Server HTTP transactions/s, and Server_stress_level panes. This denotes the beginning of the attack vector.
- Stop the attack. Use Ctrl+C.
Module Recap
We covered a lot in our exploration of how to mitigate attacks with NGINX App Protect DoS, as well as the visualization aspects of the events in the Kibana dashboard.
The following is a brief review of the salient features of the dashboard:
- Once an attack begins, NGINX App Protect DoS will switch into attack mode due to the server health deteriorating - almost immediately. (Dashboard : AP_DOS: Server_stress_level).
- NGINX App Protect DoS will first mitigate with a global rate limit just to protect the upstream server. (Dashboard: AP_DOS: HTTP mitigation, Global Rate will marked Red).
- During this time, NGINX App Protect DoS identifies anomalous traffic and generates Dynamic Signatures matching only the malicious traffic. (Dashboard: AP_DOS: HTTP mitigation, Signatures will be marked Purple).
- It might take a few moments for a dynamic signature(s) to generate, but shortly after the attack has been detected a signature should be created.
- Dynamic Signatures will be displayed in (Dashboard:AP_DOS: Attack signatures).
- Once mitigation is in effect, the upstream server health will rapidly improve and application performance will return to normal. (Dashboard : AP_DOS: Server_stress_level returns to value 0.5).
- After a few minutes, you will begin to see transactions being mitigated with Blocked Bad Actor events. (Dashboard: AP_DOS: HTTP mitigation, Bad Actors will marked Yellow).
- Bad Actor IP addresses will be listed in (Dashboard: AP_DOS: Detected bad actors).