Creating TCPIngress for an application
This use case describes a process of deploying an app into an existing Service Proxy for Kubernetes (SPK) environment, and exposing the service using a TCPIngress Custom Resource (CR) , also previously referred to as Layer4 fastL4.
Custom Resource Definitions (CRD)
SPK Install adds a number of F5 specific Custom Resource Definitions (CRDs). One of these CRDs is F5SPKIngressTCP.
TCPIngress in the context of SPK
The Service Proxy for Kubernetes (SPK) TCPIngress Custom Resource Definition (CRD) configures the Service Proxy Traffic Management Microkernel (TMM) for full-proxy, layer 4 (L4) TCP traffic management and load balancing. The TCPIngress CRD also enables granular connection management. For example, you can modify the type-of-service (TOS) or quality-of-service (QoS) packet headers, connection idle-timeout periods, and whether the system should send TCP reset packets. To view the full list of available TCPIngress CRD options, refer to the F5SPKIngressTCP Reference Guide.
Assumptions
You have access to an existing healthy OpenShift environment
You have deployed SPK version 1.6.0 in namespace “spk-ingress”
You have deployed an application to your watched namespace “spk-apps”
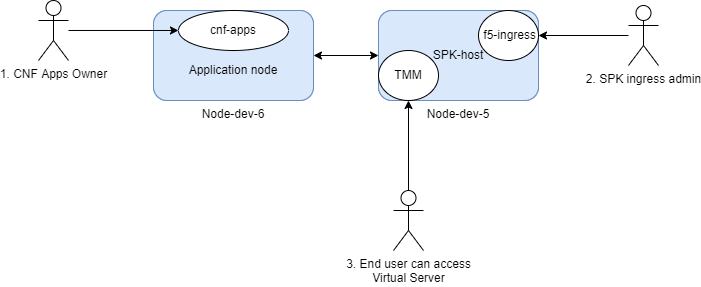
Use case scenario
Application owner has containerized a new Network Function and deploys to the namespace (Project) watched by the F5ingress controller.
SPK Administrator exposes the service using a TCPIngress Custom Resource (CR).
End User can then consume the service by connecting to the destination address/port within TMM (Virtual Server).
Create a TCPIngress yaml file
Create a file tcpIngress.yaml using the sample below for deployment. Note that we specify the API version, as well as the type of ingress we would like to create (F5SPKIngressTCP). The destination port and address are reflective of Virtual Server on BIG-IP.
apiVersion: "ingresstcp.k8s.f5net.com/v1"
kind: F5SPKIngressTCP
metadata:
  # name of the Virtual Server
  name: tcpingress
  namespace: spk-apps
service:
  # Name of the installed ServicePort for podinfo app Pod
  name: podinfo
  # ServicePort of podinfo app Pod
  port: 9898
spec:
  idleTimeout: 88000
  # the address of the Virtual Server
  # can be v4 or v6, or "dual stack" for both.
  destinationAddress: "2.4.6.8"
  ipv6destinationAddress: ""
  # exposed kubectl service port
  destinationPort: 9001
monitors:
  icmp:
  - failures: 3
Deploy TCPIngress Custom Resource to F5ingress
Now we can install the Ingress Route TCPIngress custom resource using the oc
command-line provided with OpenShift. The install process will complete in a few
seconds. Once complete you can check for the applied values using oc get with
the -o yaml option. Using oc describe we can see very similar details in a
different format.
oc project spk-apps
oc apply -f tcpingress.yaml -n spk-apps
Discover the f5ingress pod name
oc get pods -n spk-ingress
Confirming Proper operation
Use CURL to test application is exposed
curl http://<Your IP Address>:8080
The results should look something like this:
{
  "hostname": "podinfo-869b98bb5c-ngsmm",
  "version": "6.2.2",
  "revision": "1cf228c67b8f8102db1a6966f81a95c09954b3e8",
  "color": "#34577c",
  "logo": "https://raw.githubusercontent.com/stefanprodan/podinfo/gh-pages/cuddle_clap.gif",
  "message": "greetings from podinfo v6.2.2",
  "goos": "linux",
  "goarch": "amd64",
  "runtime": "go1.19.2",
  "num_goroutine": "8",
  "num_cpu": "28"
}%
Debugging
Check connection statistics and routing
The SPK Debug Sidecar container can be access to perform various diagnostic and troubleshooting tasks.
Refer to the above link for a complete list and examples of commands available on the Debug Sidecar. See relevant examples below.
Connecting to the sidecar
To connect to the debug sidecar and begin gathering diagnostic information, use the commands below.
Connect to the debug sidecar:
oc exec -it deploy/f5-tmm -c debug -n spk-ingress -- bash
Use the ping command to test connectivity to a remote host
ping 192.168.10.100
PING 192.168.10.100 (192.168.10.100): 56 data bytes
64 bytes from 192.168.10.100: icmp_seq=0 ttl=64 time=0.067 ms
64 bytes from 192.168.10.100: icmp_seq=1 ttl=64 time=0.067 ms
64 bytes from 192.168.10.100: icmp_seq=2 ttl=64 time=0.067 ms
64 bytes from 192.168.10.100: icmp_seq=3 ttl=64 time=0.067 ms
Type Exit to leave the debug sidecar.
tmctl
Use the tmctl tool to query Service Proxy TMM for application traffic processing statistics.
Connect to the debug sidecar:
oc exec -it deploy/f5-tmm -c debug -n spk-ingress -- bash
To view virtual server connection statistics run the following command:
tmctl -d blade virtual_server_stat -s name,clientside.tot_conns
To view pool member connection statistics run the following command:
tmctl -d blade pool_member_stat -s pool_name,serverside.tot_conns
bdt_cli
Use the bdt_cli tool to query the Service Proxy TMM for networking data.
Connect to the debug sidecar:
oc exec -it deploy/f5-tmm -c debug -n spk-ingress -- bash
Display routes
bdt_cli -u -s tmm0:8850 route
The output will resemble the following:
routeType:0 isIpv6:false destNet:{ip:{addr:10.131.1.165, rd:0} pl:32} gw:{ip:{addr:172.20.1.202, rd:0}} gwType:1 interface:internal
routeType:0 isIpv6:false destNet:{ip:{addr:<none>, rd:0} pl:0} gw:{ip:{addr:10.131.0.1, rd:0}} gwType:1 interface:eth0
routeType:1 isIpv6:false destNet:{ip:{addr:10.131.0.0, rd:0} pl:23} gw:{ip:{addr:<none>, rd:0}} gwType:0 interface:eth0
routeType:1 isIpv6:false destNet:{ip:{addr:10.40.51.0, rd:0} pl:24} gw:{ip:{addr:<none>, rd:0}} gwType:0 interface:external
routeType:1 isIpv6:false destNet:{ip:{addr:172.20.1.0, rd:0} pl:24} gw:{ip:{addr:<none>, rd:0}} gwType:0 interface:internal
Display arp tables
bdt_cli -u -s tmm0:8850 arp
The output will resemble the following:
name:172.20.1.202 ipAddr:172.20.1.202 macAddr:40:a6:b7:54:55:80 vlan:internal expire:34 status:resolved
name:169.254.0.254 ipAddr:169.254.0.254 macAddr:00:01:23:45:67:fe vlan:tmm expire:0 status:permanent
name:10.131.0.1 ipAddr:10.131.0.1 macAddr:0a:58:0a:83:00:01 vlan:eth0 expire:82 status:resolved
name:172.20.1.101 ipAddr:172.20.1.101 macAddr:3e:37:5d:1d:16:da vlan:internal expire:0 status:permanent
Display connection info
bdt_cli -u -s tmm0:8850 connection
The output will resemble the following:
csClientAddr:{ip:{addr:169.254.0.253, rd:0}} csClientPort:56413 csServerAddr:
{ip:{addr:172.30.0.10, rd:0}} csServerPort:53 ssServerAddr:
{ip:{addr:172.30.0.10, rd:0}} ssServerPort:53 type:1 protocol:17 idleTime: 31
idleTimeout:30 ssClientAddr:{ip:{addr:10.131.0.78, rd:0}} ssClientPort:56413
virtualPathAddr:{ip:{addr:<none>, rd:65535}} virtualPathPort:0 haUnitId:0
csBytesIn:101 csBytesOut:205 csPacketsIn:1 csPacketsOut: 1 ssBytesIn:205
ssBytesOut:101 ssPacketsIn:1 ssPacketsOut:1 lasthopInfo:tmm 00:98:76:54:32:10
nexthopInfo:eth0 0a:58:0a:83:00:01 ingressMac:mac:"00:01:23:45:67:fe"
tmm_cli
By default, the f5-tmm container logs events at the Notice level. You can use the tmm_cli command to modify the logging level. The logging levels are listed below in the order of message severity. More severe levels generally log messages from the lower severity levels as well.
1-Debug, 2-Informational, 3-Notice, 4-Warning, 5-Error, 6-Critical, 7-Alert, 8-Emergency
Connect to the debug sidecar:
oc exec -it deploy/f5-tmm -c debug -n spk-ingress -- bash
To set the f5-tmm container’s logging level to Debug, run the following command:
tmm_cli -logLevel 1
ok
The f5-tmm container will log an event message simlilar to the following:
Set bigdb var 'log.tmm.level'='Debug'
Uninstall your demo application and TCPIngress CR
Deleting the TCPIngress custom resource is fairly straightforward. We can use the
oc command again point to the yaml file and use the delete option.
Alternatively, if you know the object name, type and the namespace it resides
in you can delete the object without the file.
oc delete -f tcpingress.yaml