NGINX Modern Apps > Class 5 - NGINX App Protect WAF & DoS > Module 3 - Modern Apps NGINX App Protect WAF Deployment Source | Edit on
Review the NGINX Plus & Grafana Dashboard Statistics
This section is optional and showcases the use of NGINX Dashboard (included with NGINX Plus).
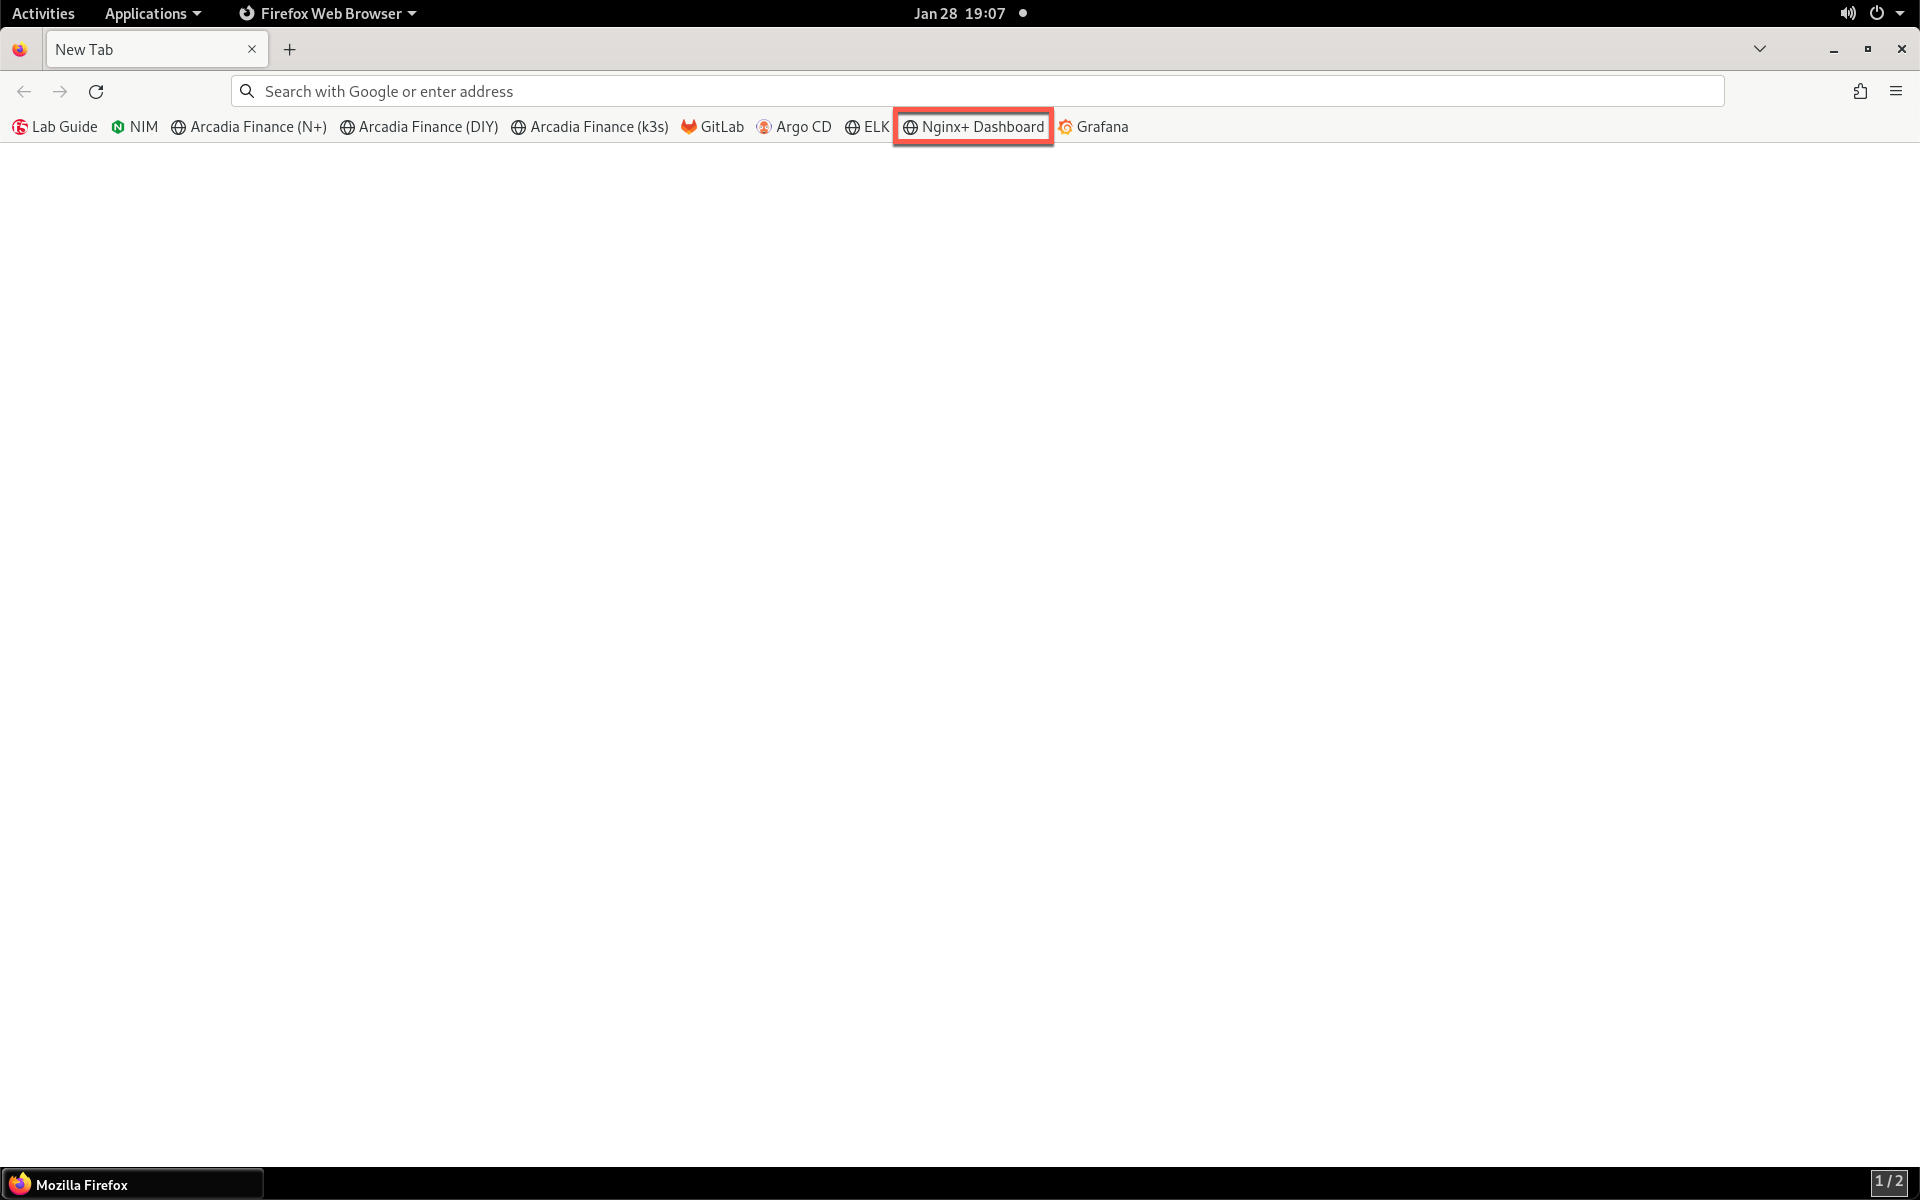
- Return to Firefox and open a new tab. Click the NGINX+ Dashboard bookmark.
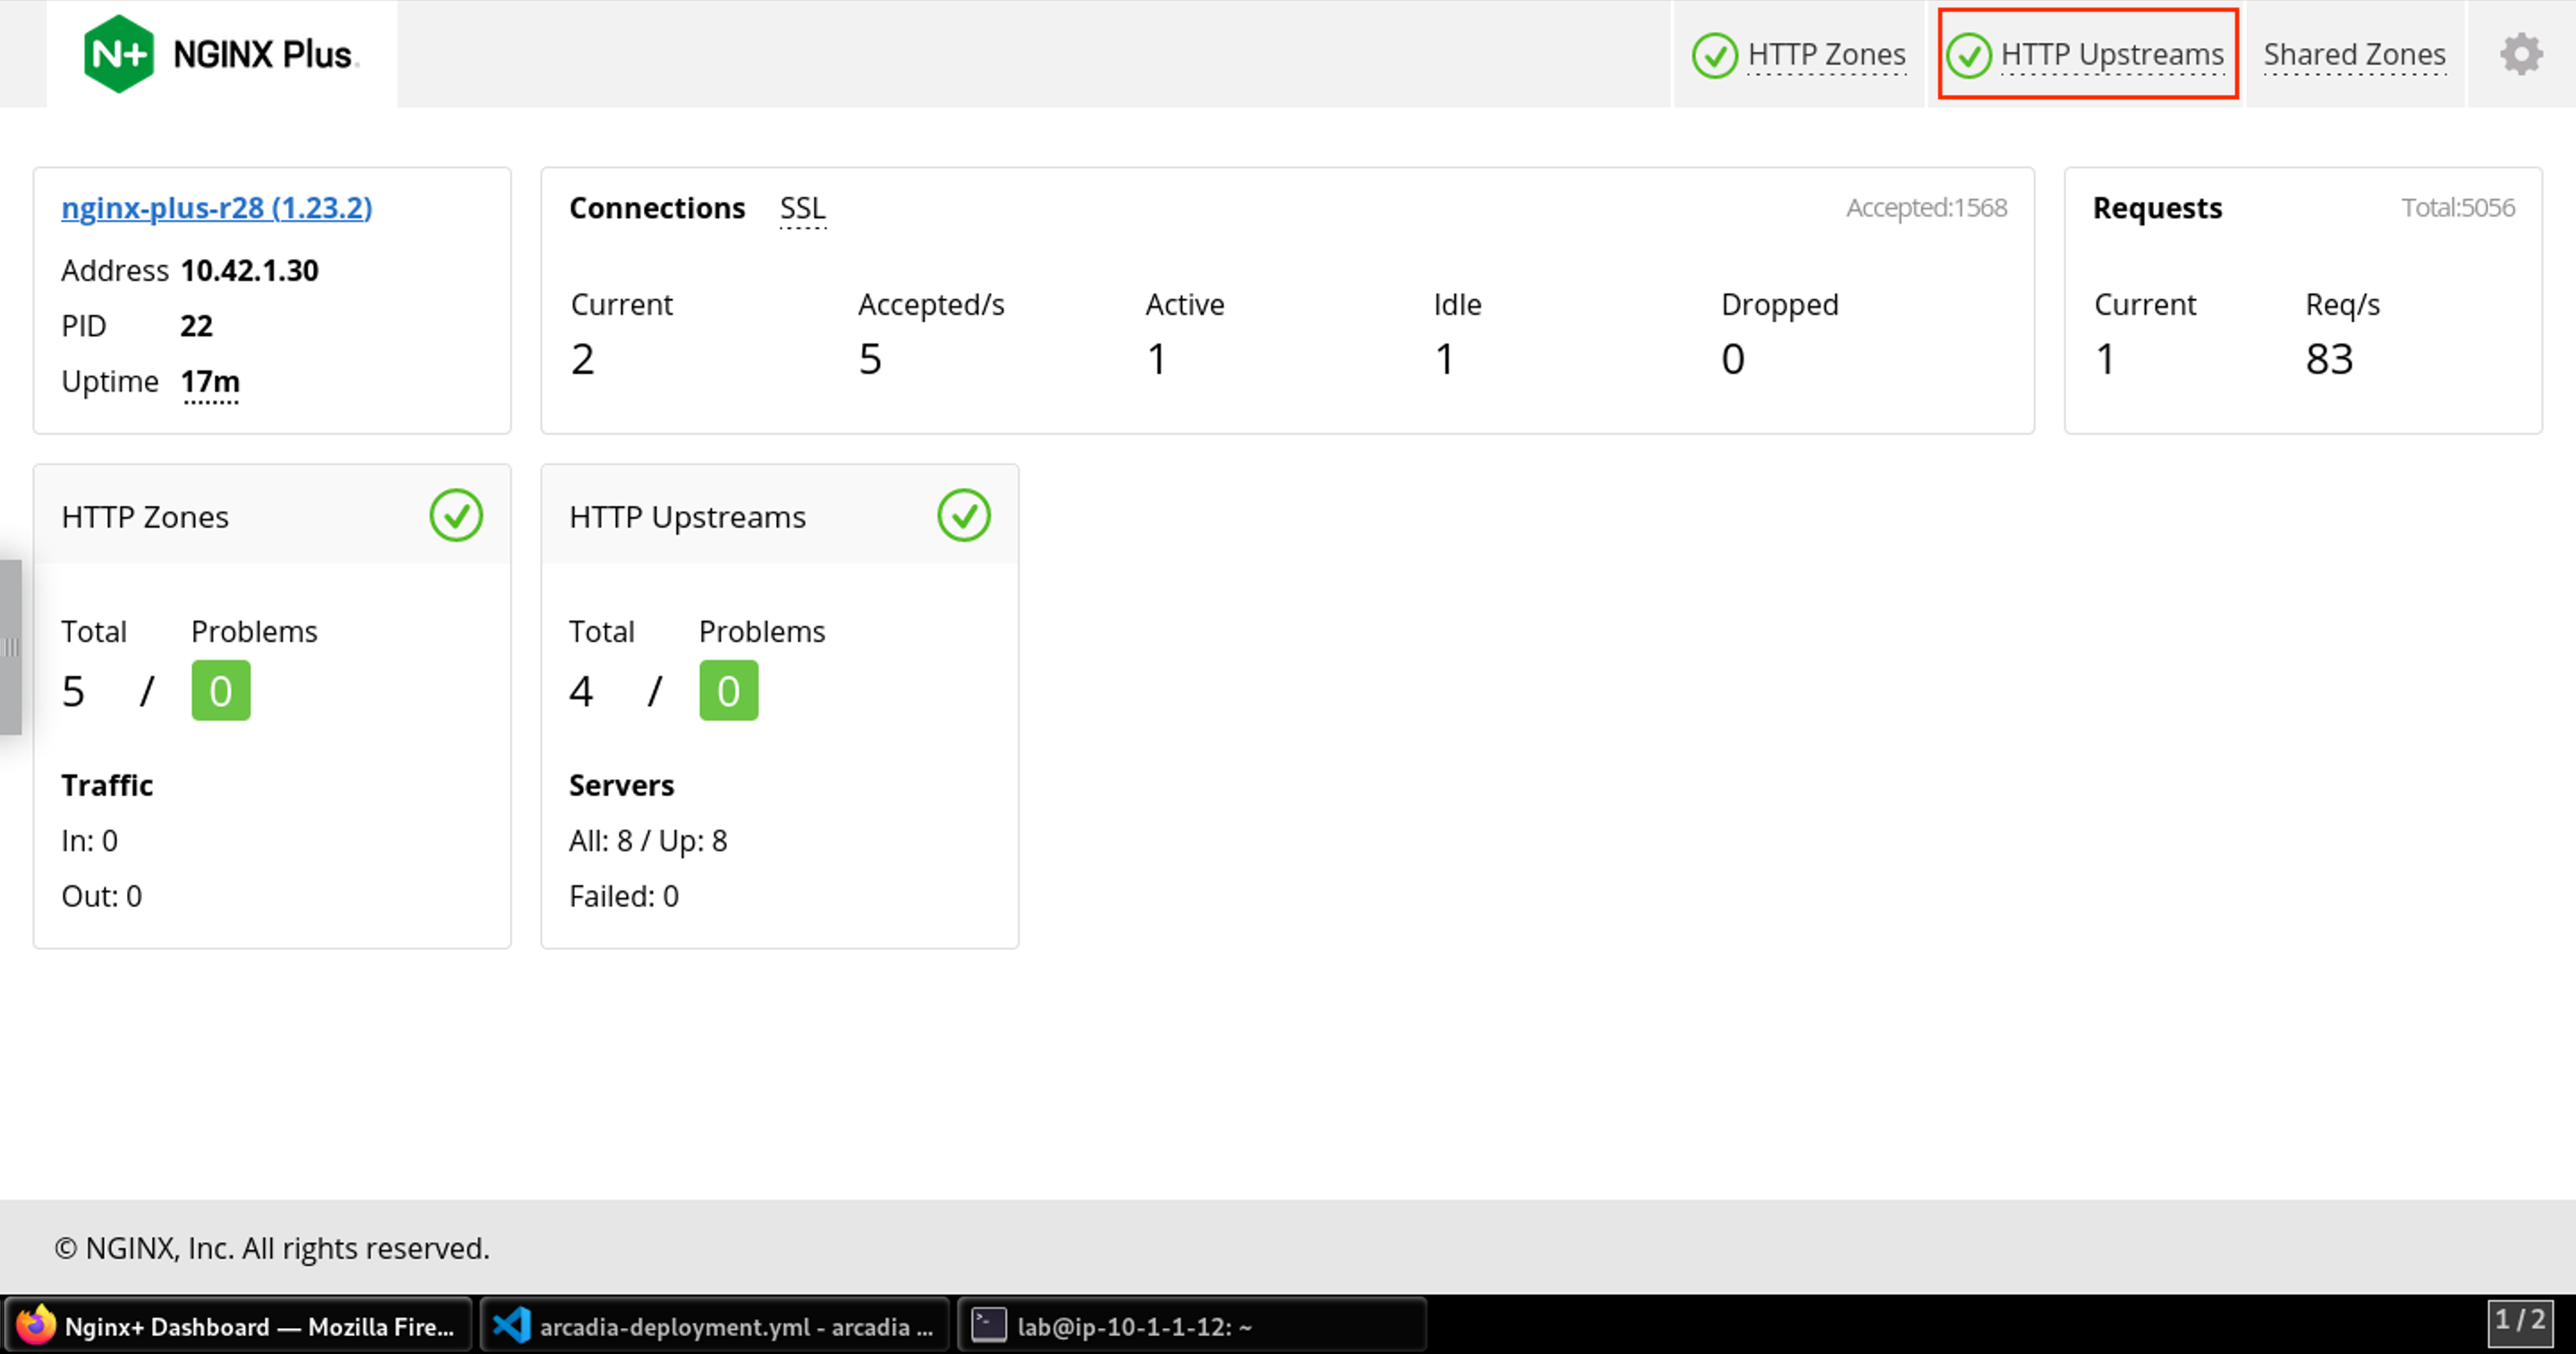
- The landing page gives you an overview of the current traffic statistics. Click on HTTP Upstreams.
- The HTTP Upstreams section shows all your Kubernetes endpoints.
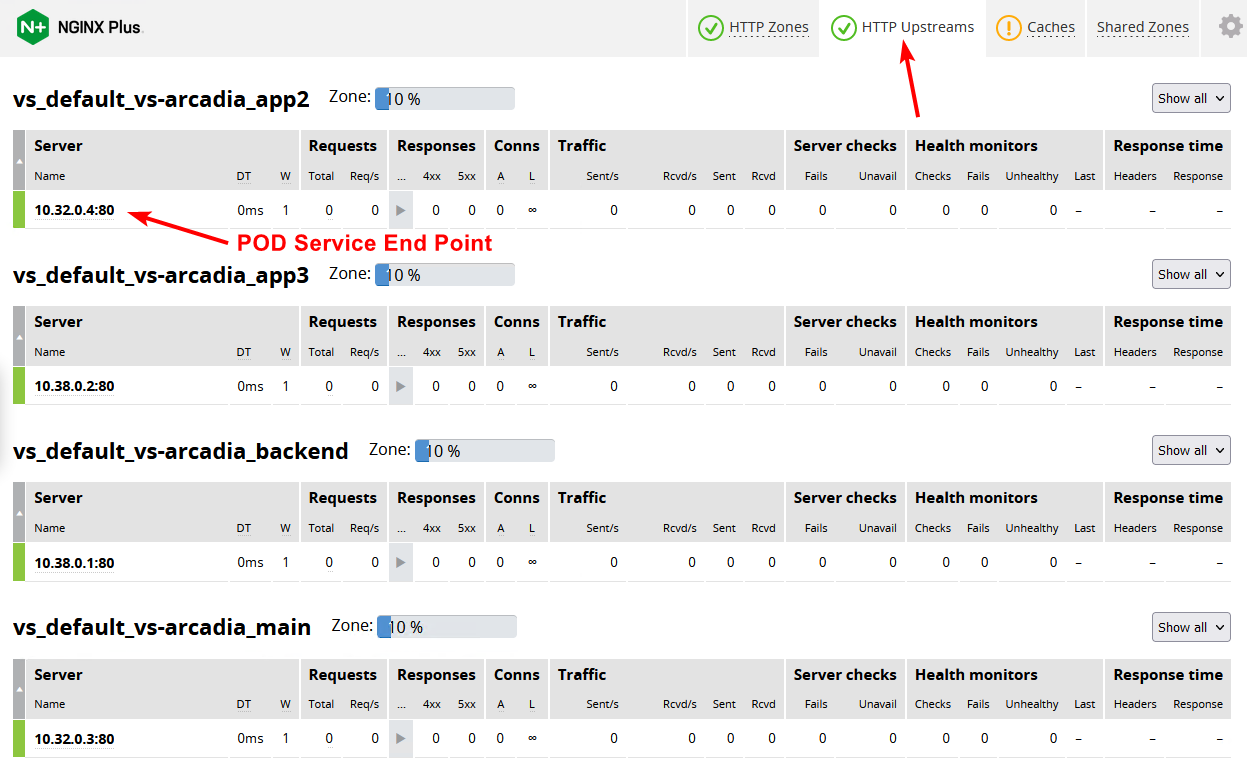
- The additional detail provided in the NGINX Dashboard is provided via Snippets that are enabled in the values.yaml file and directives called out in arcadia-vs.yml file.

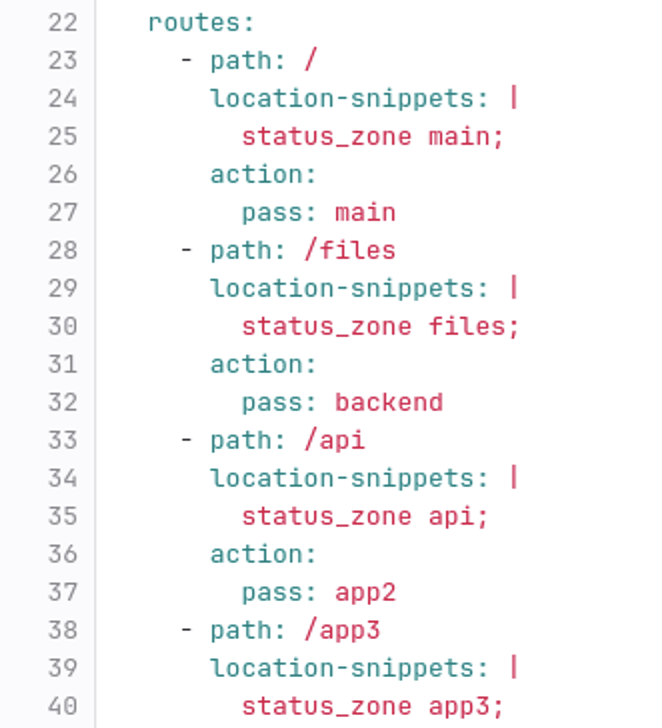
- Here is a small section showing how the snippet directive was used in arcadia-vs.yml file.
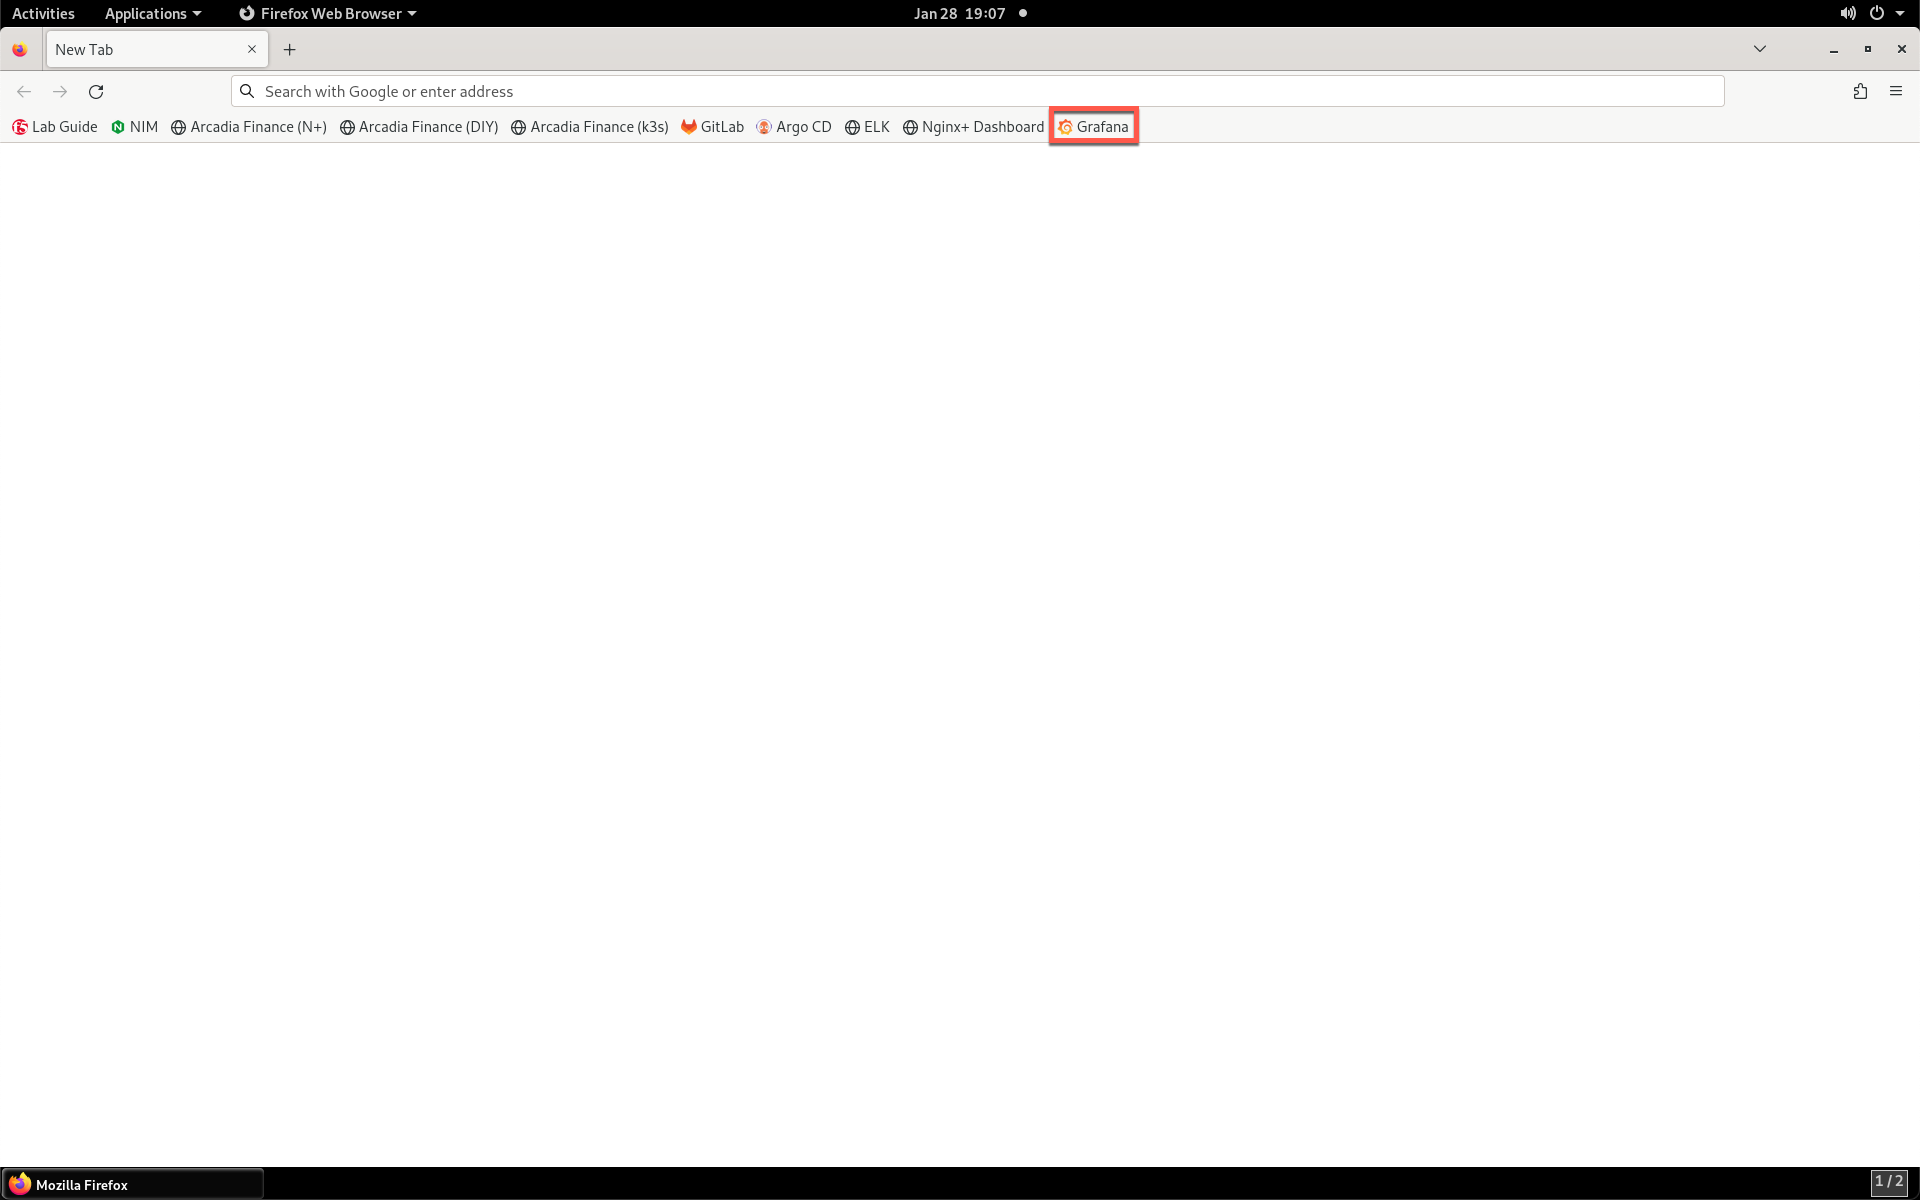
- Open a new tab in Firefox and click the Grafana bookmark.
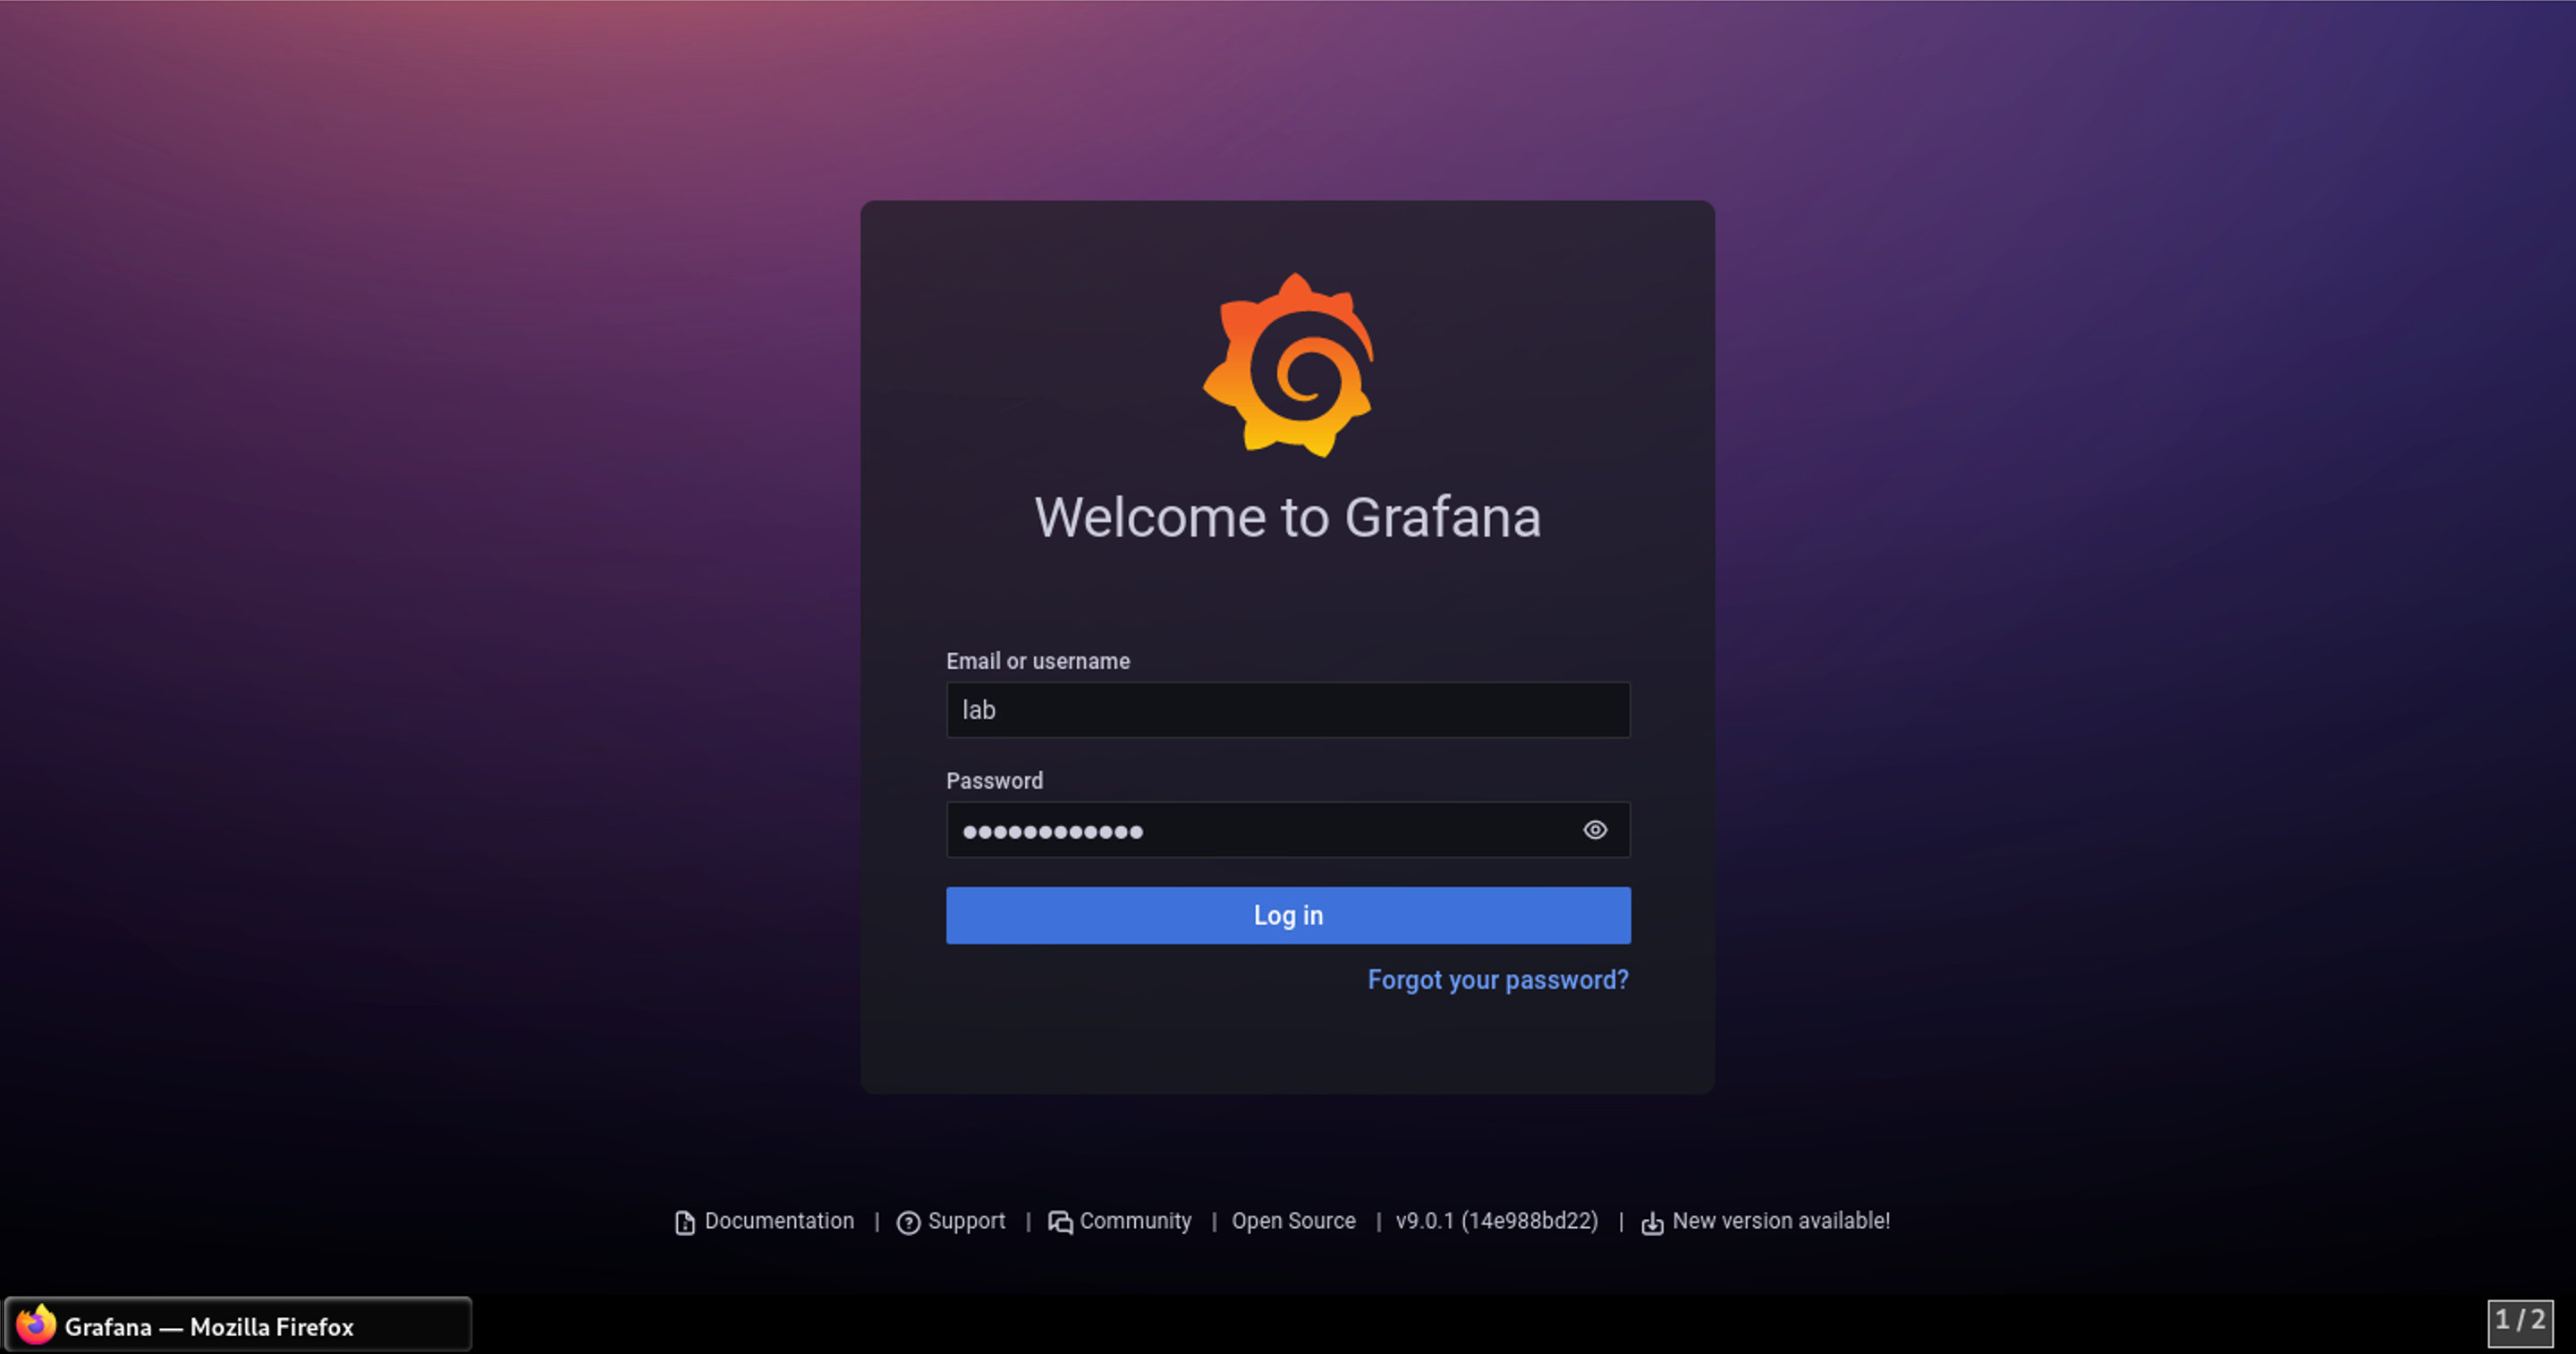
- Log in using the lab / AppWorld2024! credentials.
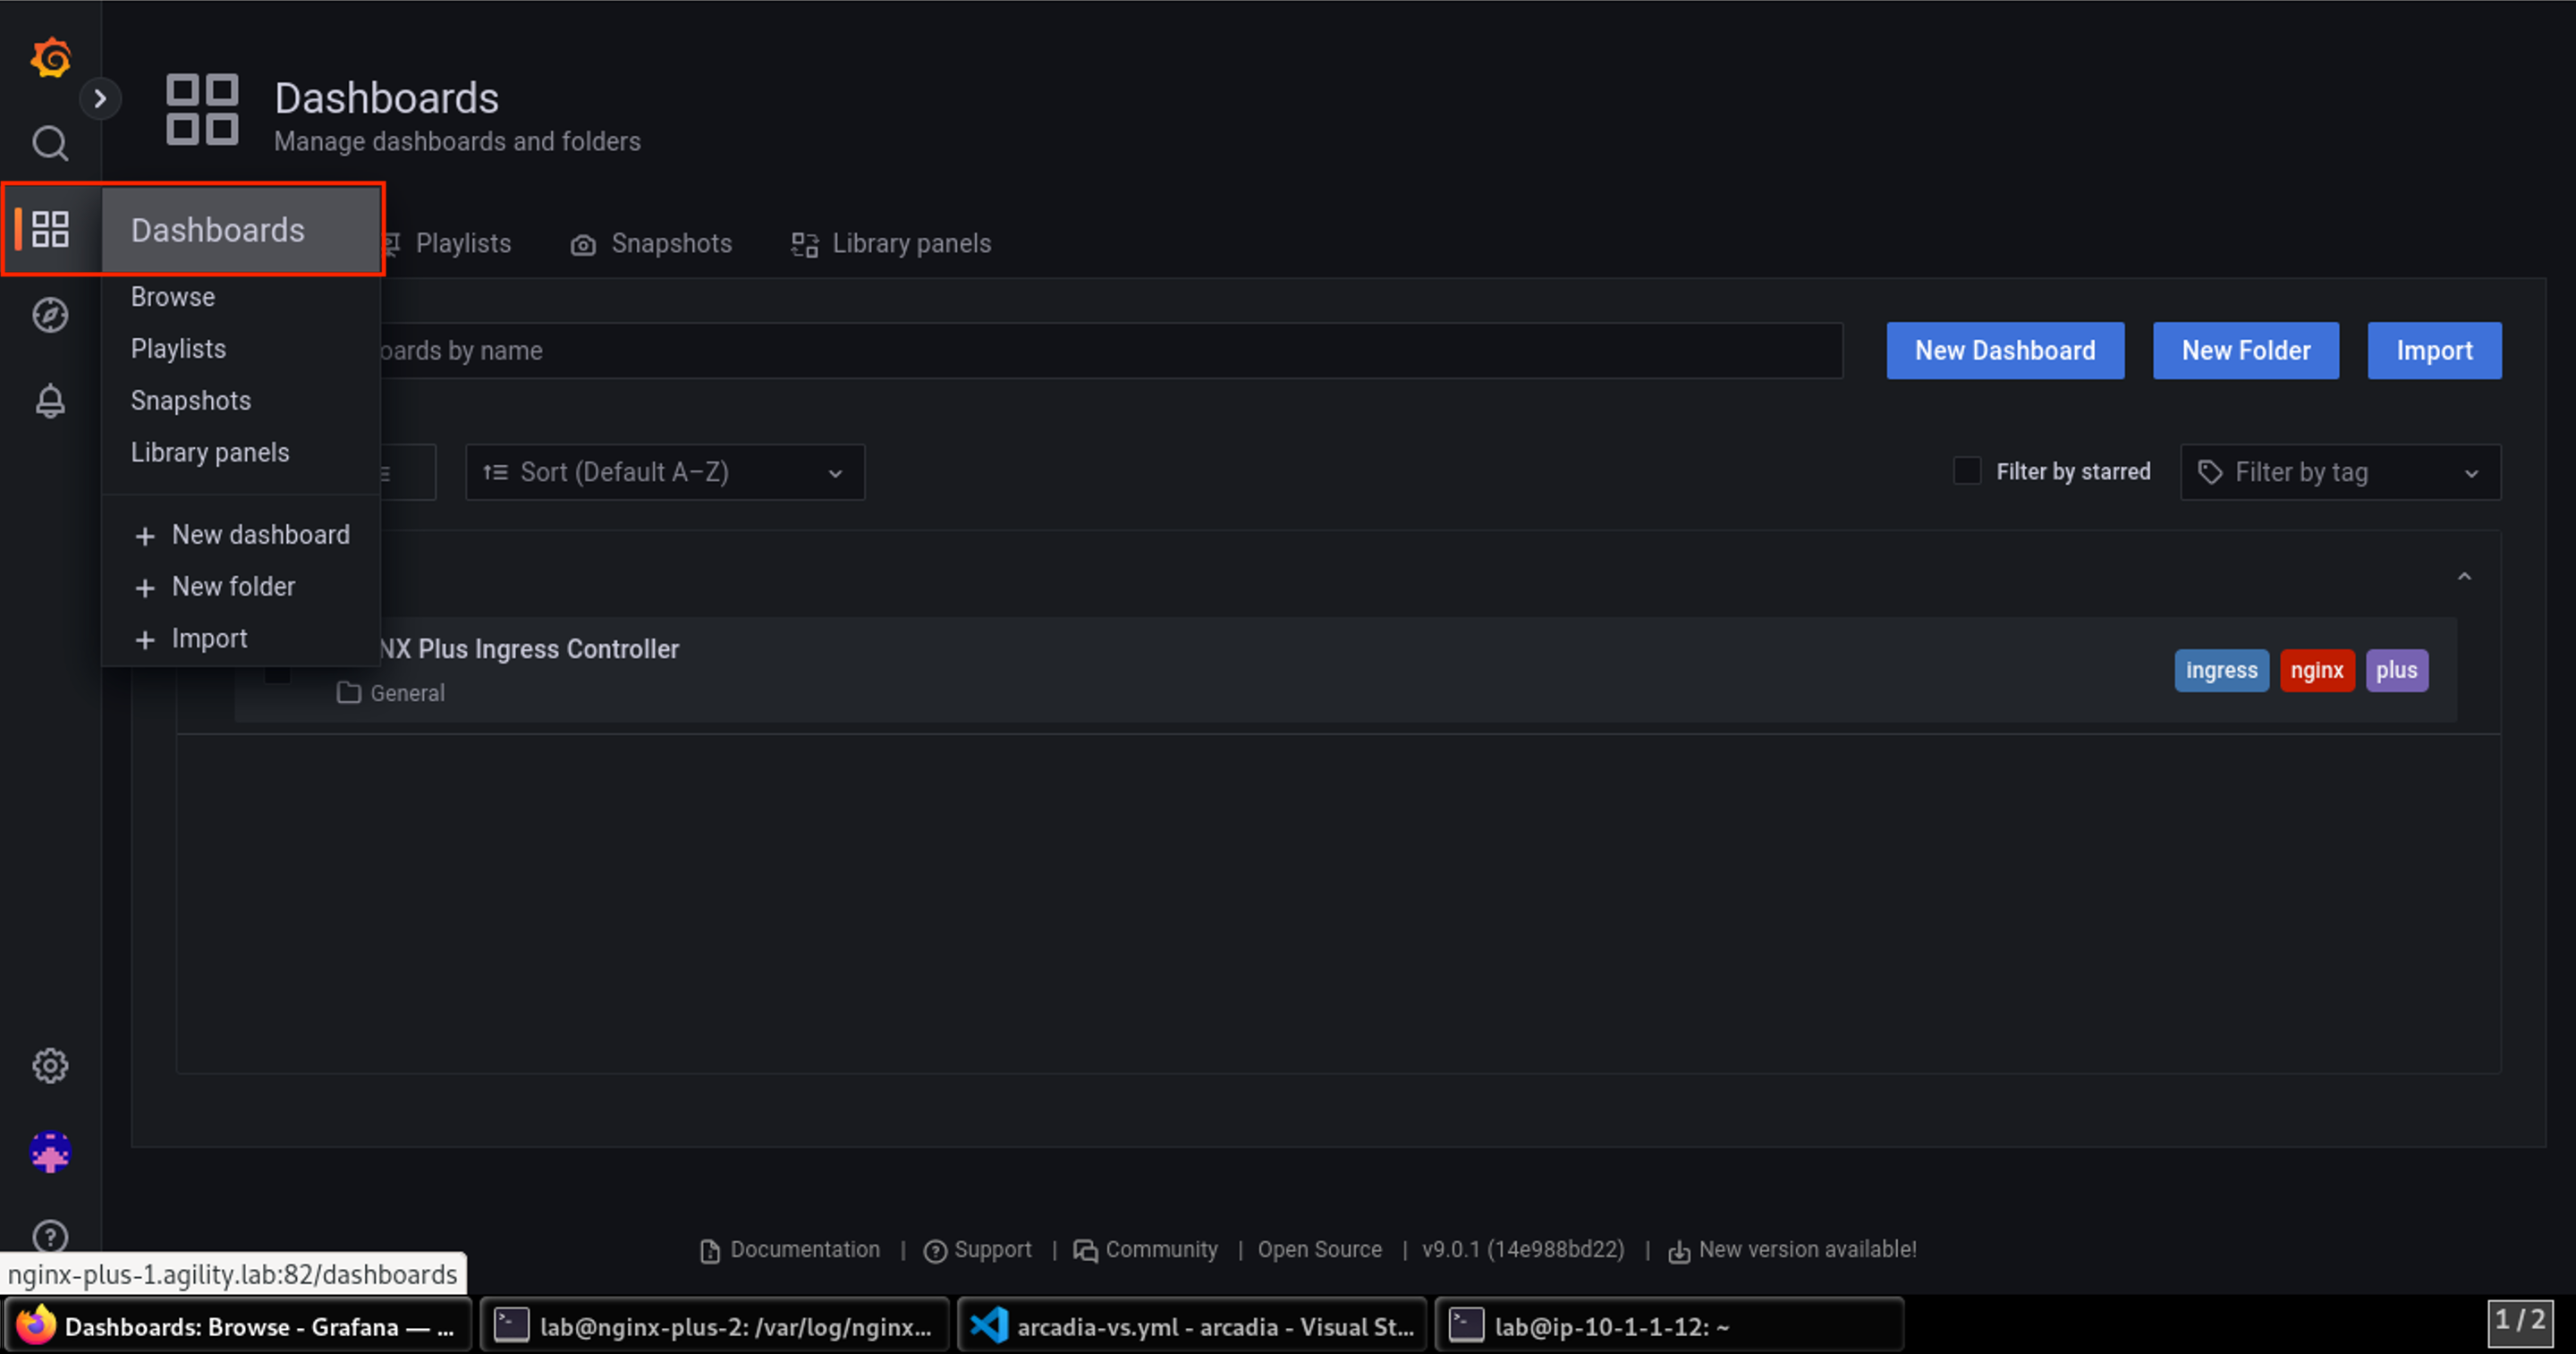
- Click on the Dashboards icon and select Dashboards from the left menu.
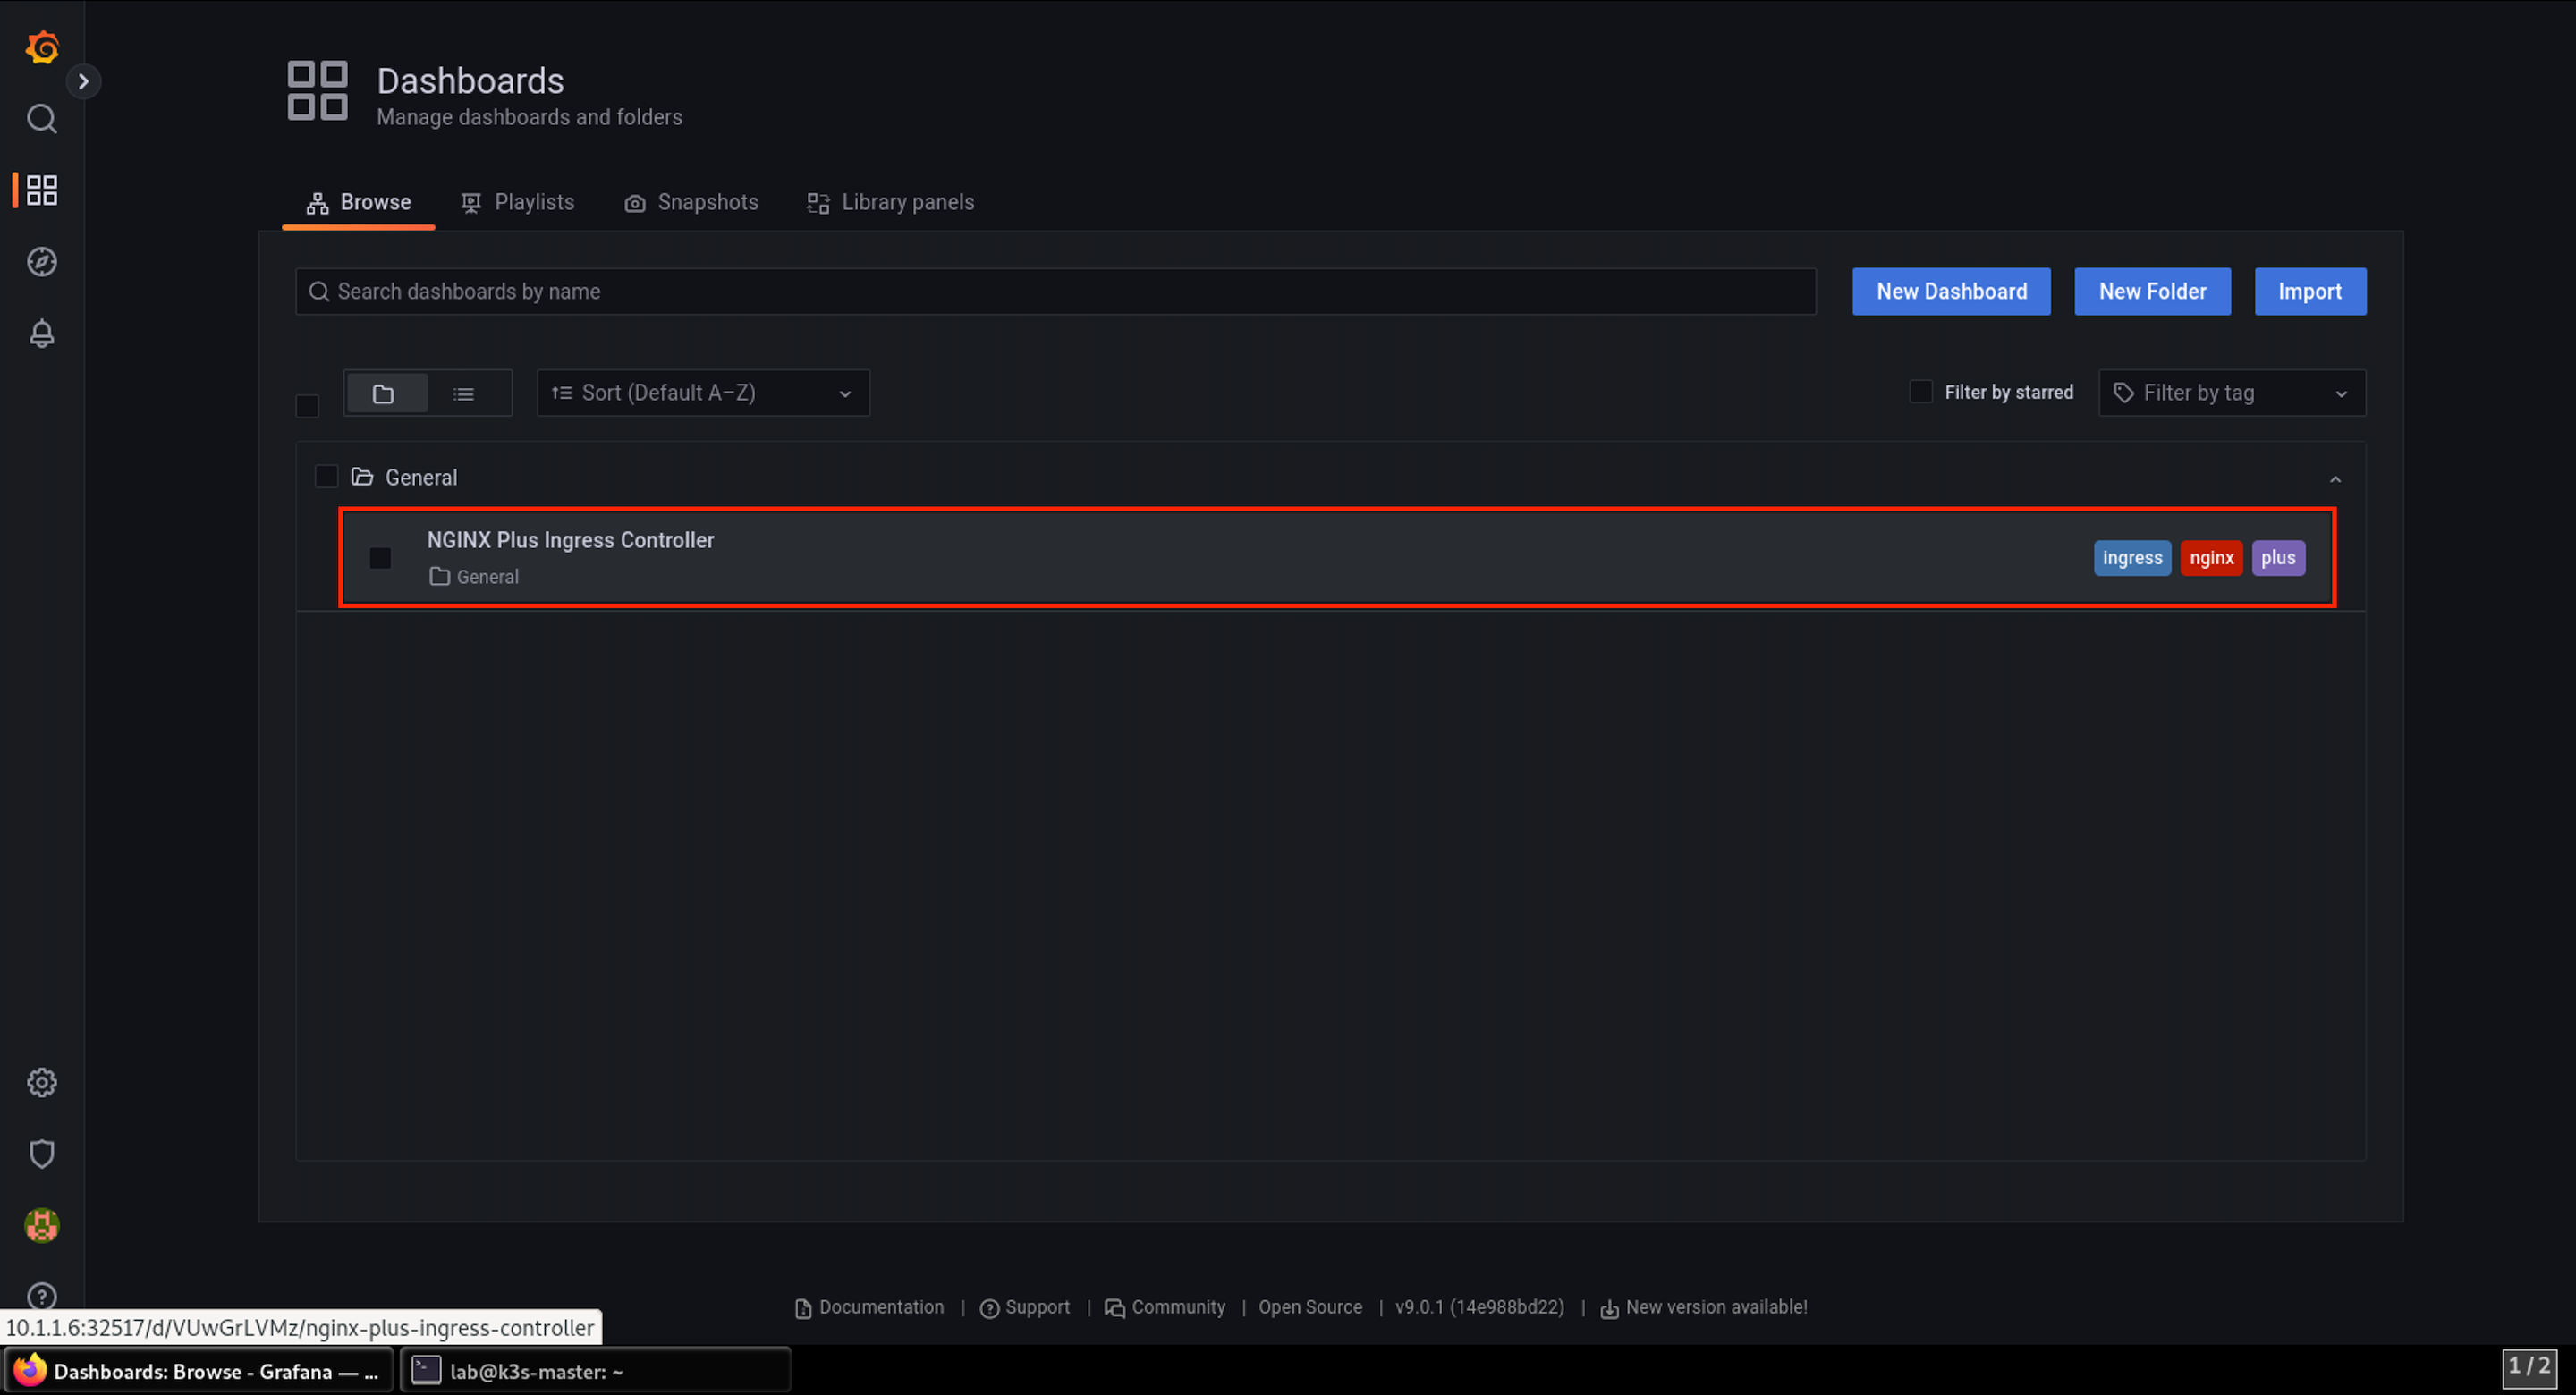
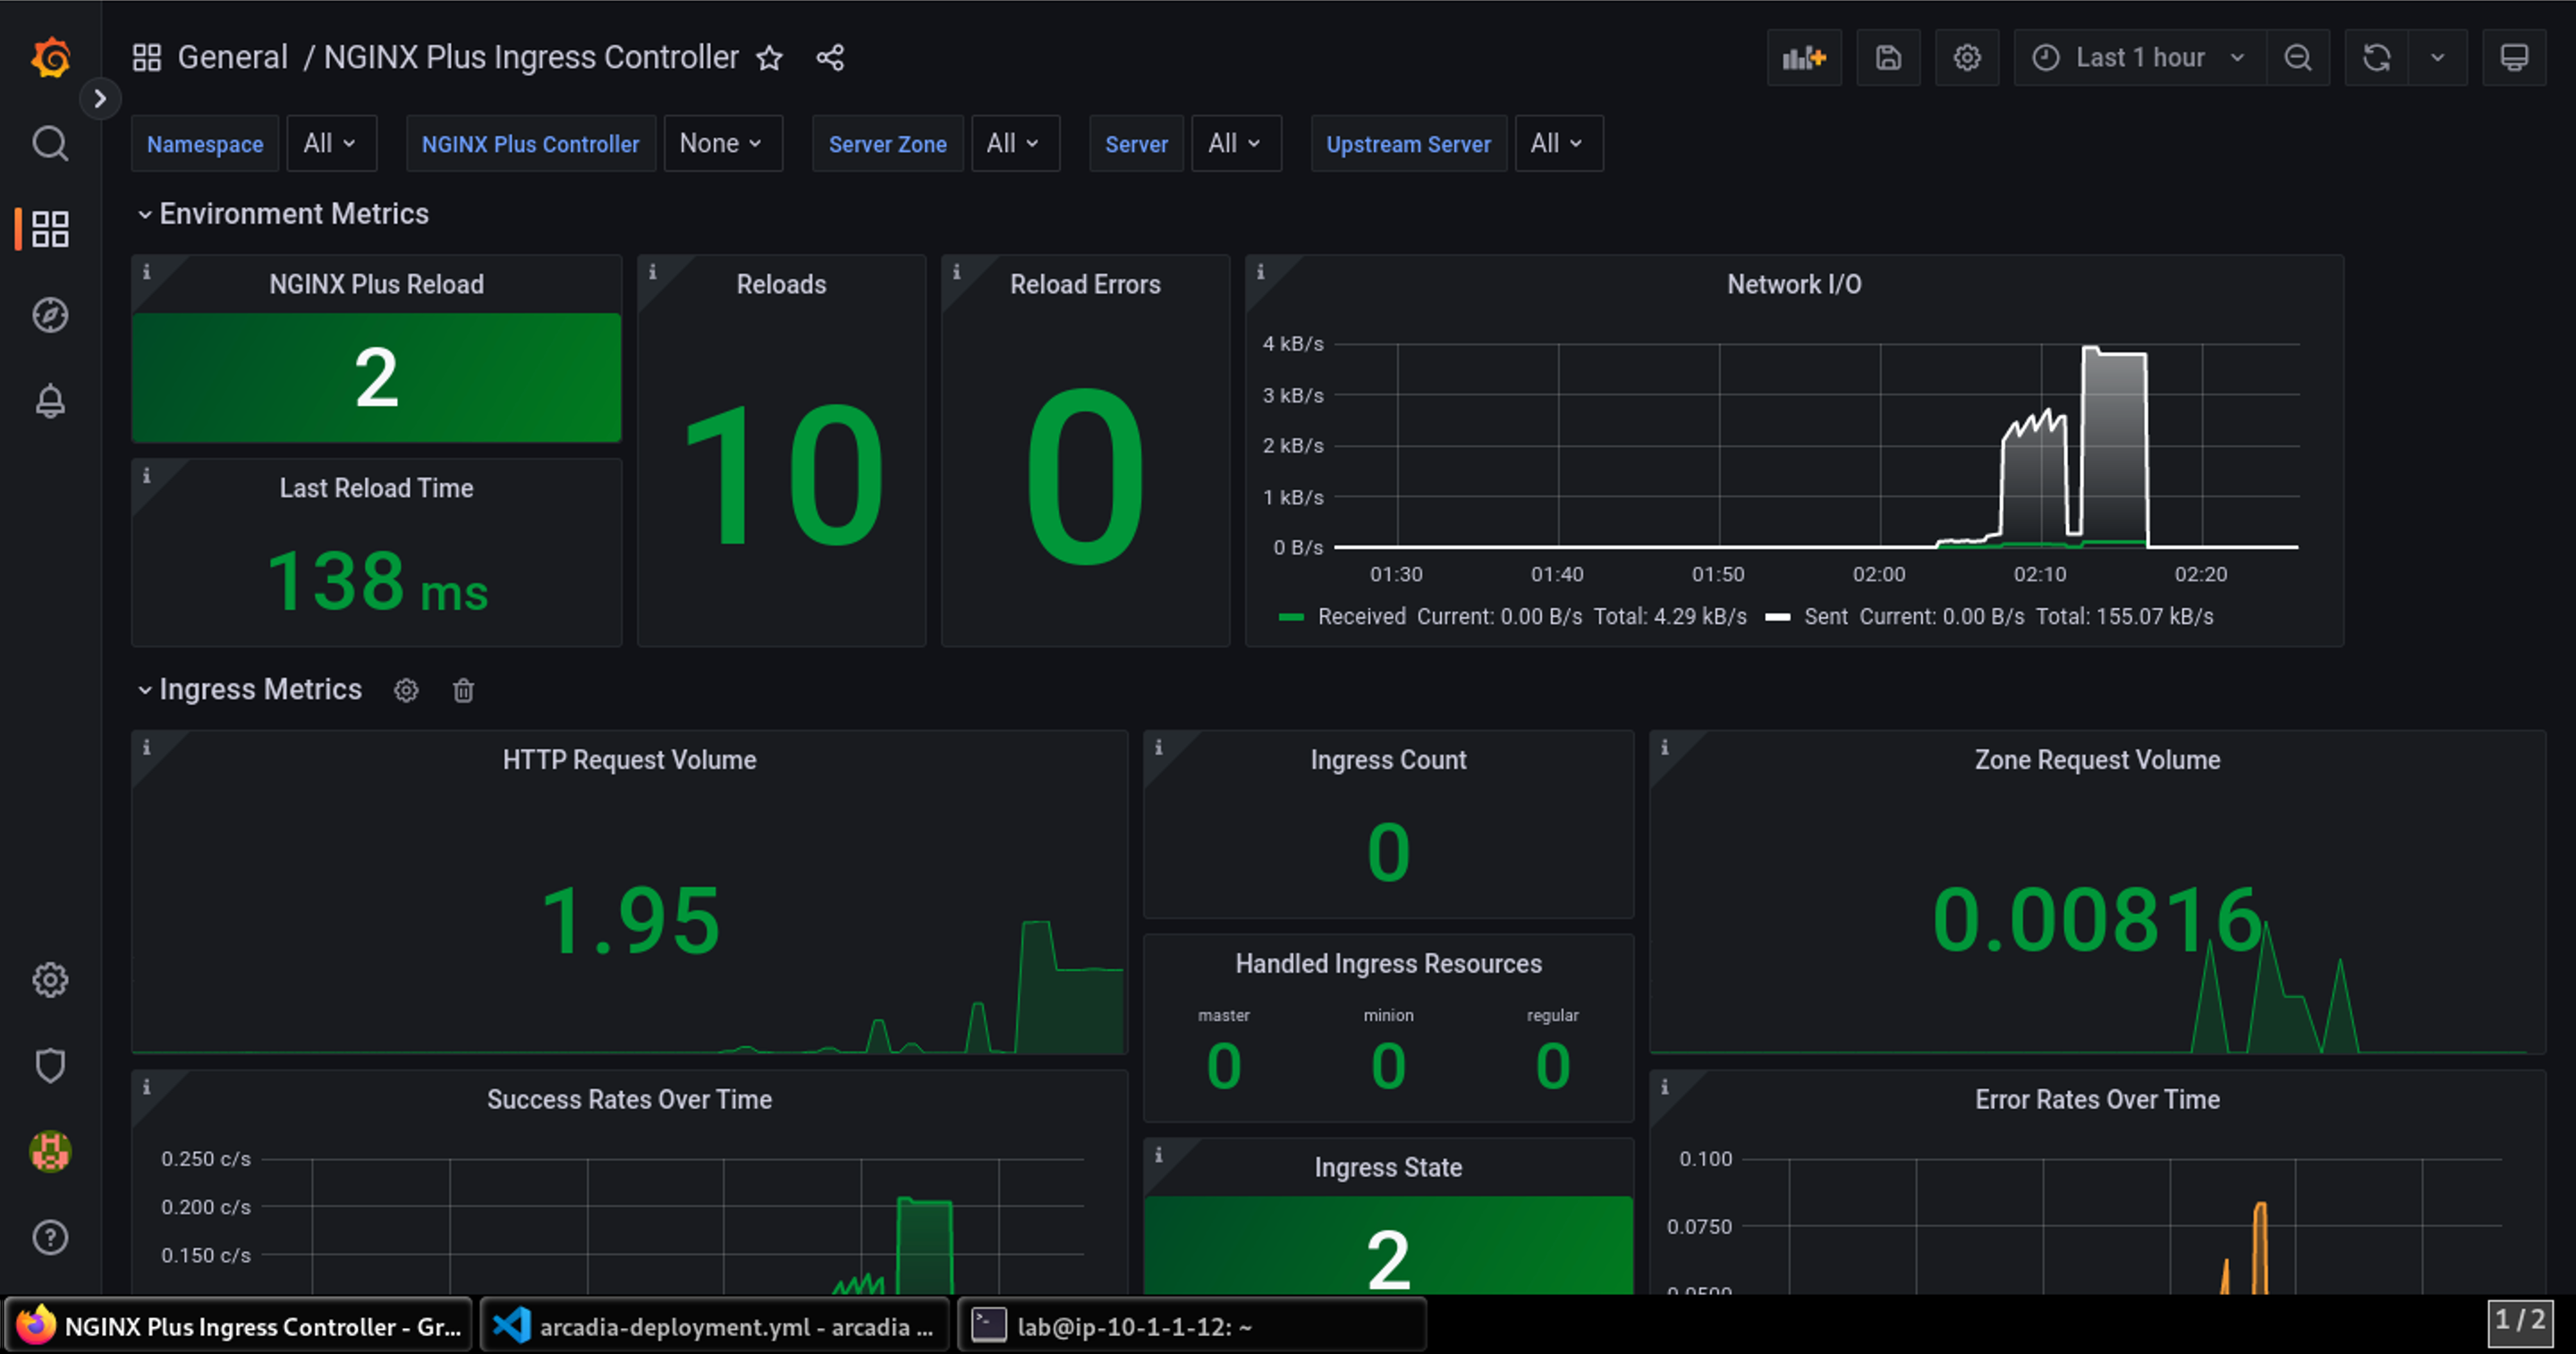
- Click on the NGINX Plus Ingress Controller dashboard in the list.
- This section shows Prometheus exporting NGINX Ingress Controller data to Grafana. For a full list of metrics exported please see this link.
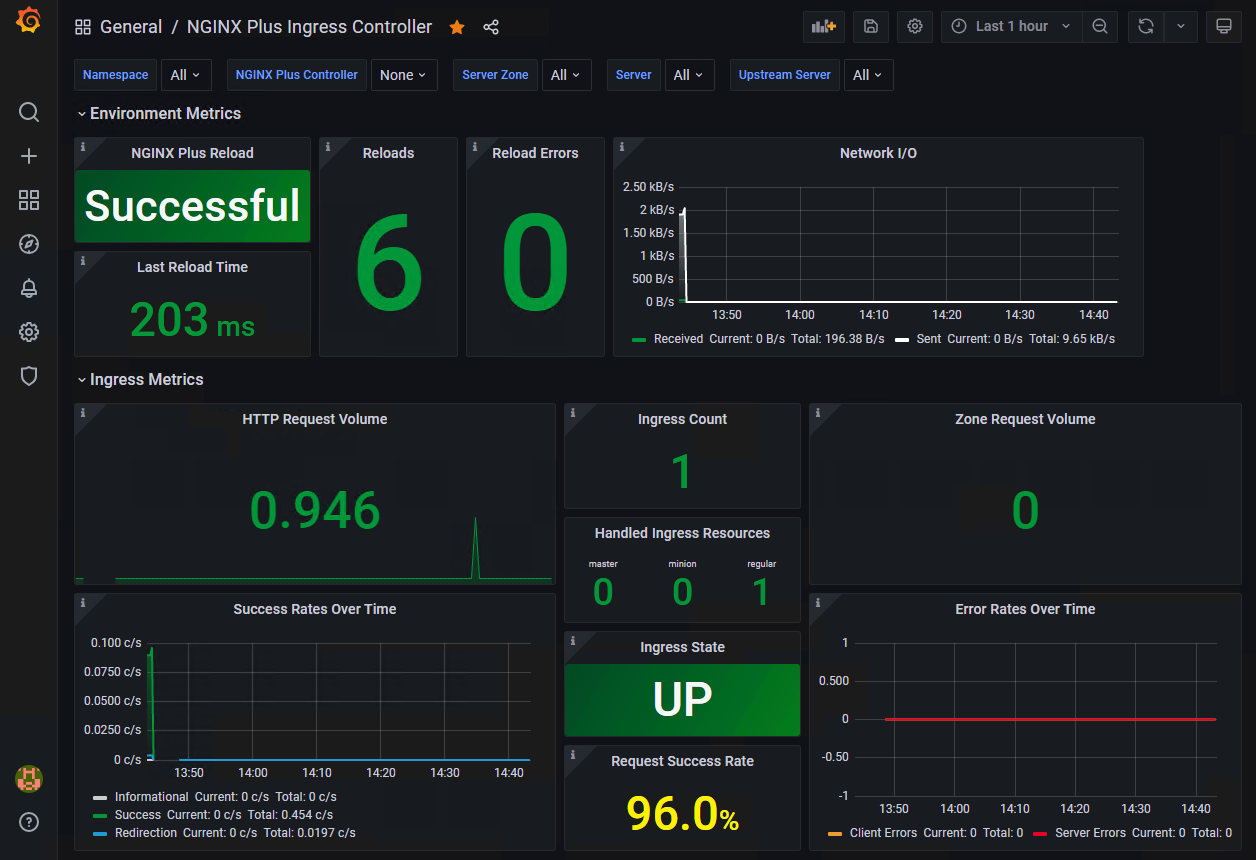
- Expand the sections in the dashboard to see the related statistics.
This concludes the NGINX Ingress Controller deployment for NGINX App Protect.