NGINX Modern Apps > Class 5 - NGINX App Protect WAF & DoS > Module 1 - Test Driving NGINX Plus with App Protect WAF and NGINX Instance Manager Source | Edit on
View NGINX App Protect in NIM
There are two components to NGINX App Protect within NIM:
- NAP configuration via Instance Manager extension
- NAP monitoring via NGINX Security Monitoring (SM)
- Take a look at both of these components. First, load the NIM bookmark in Firefox and login using the lab / AppWorld2024! credentials, if not already. Then, click the Instance Manager tile.
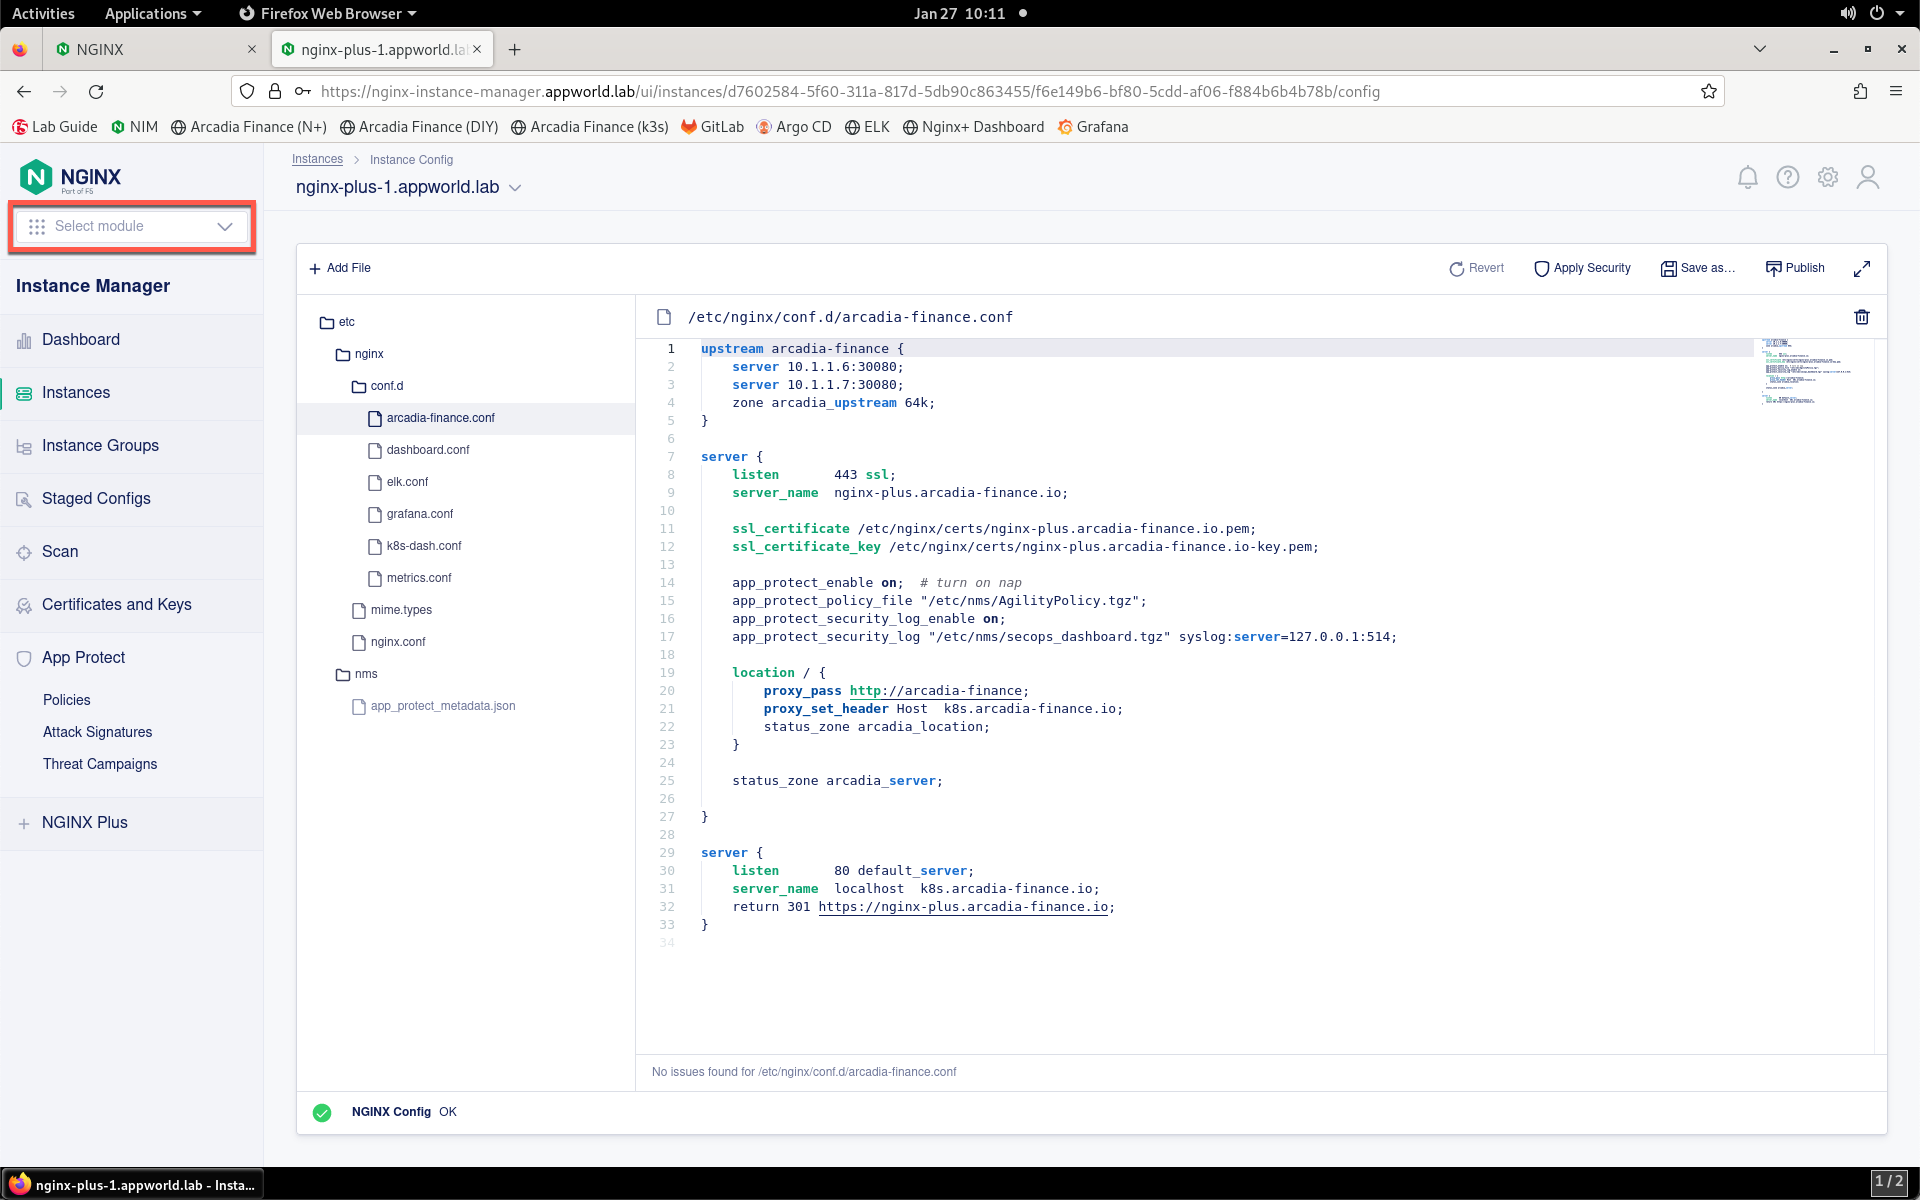
- Click the Select module drop-down from the top of the left menu bar.
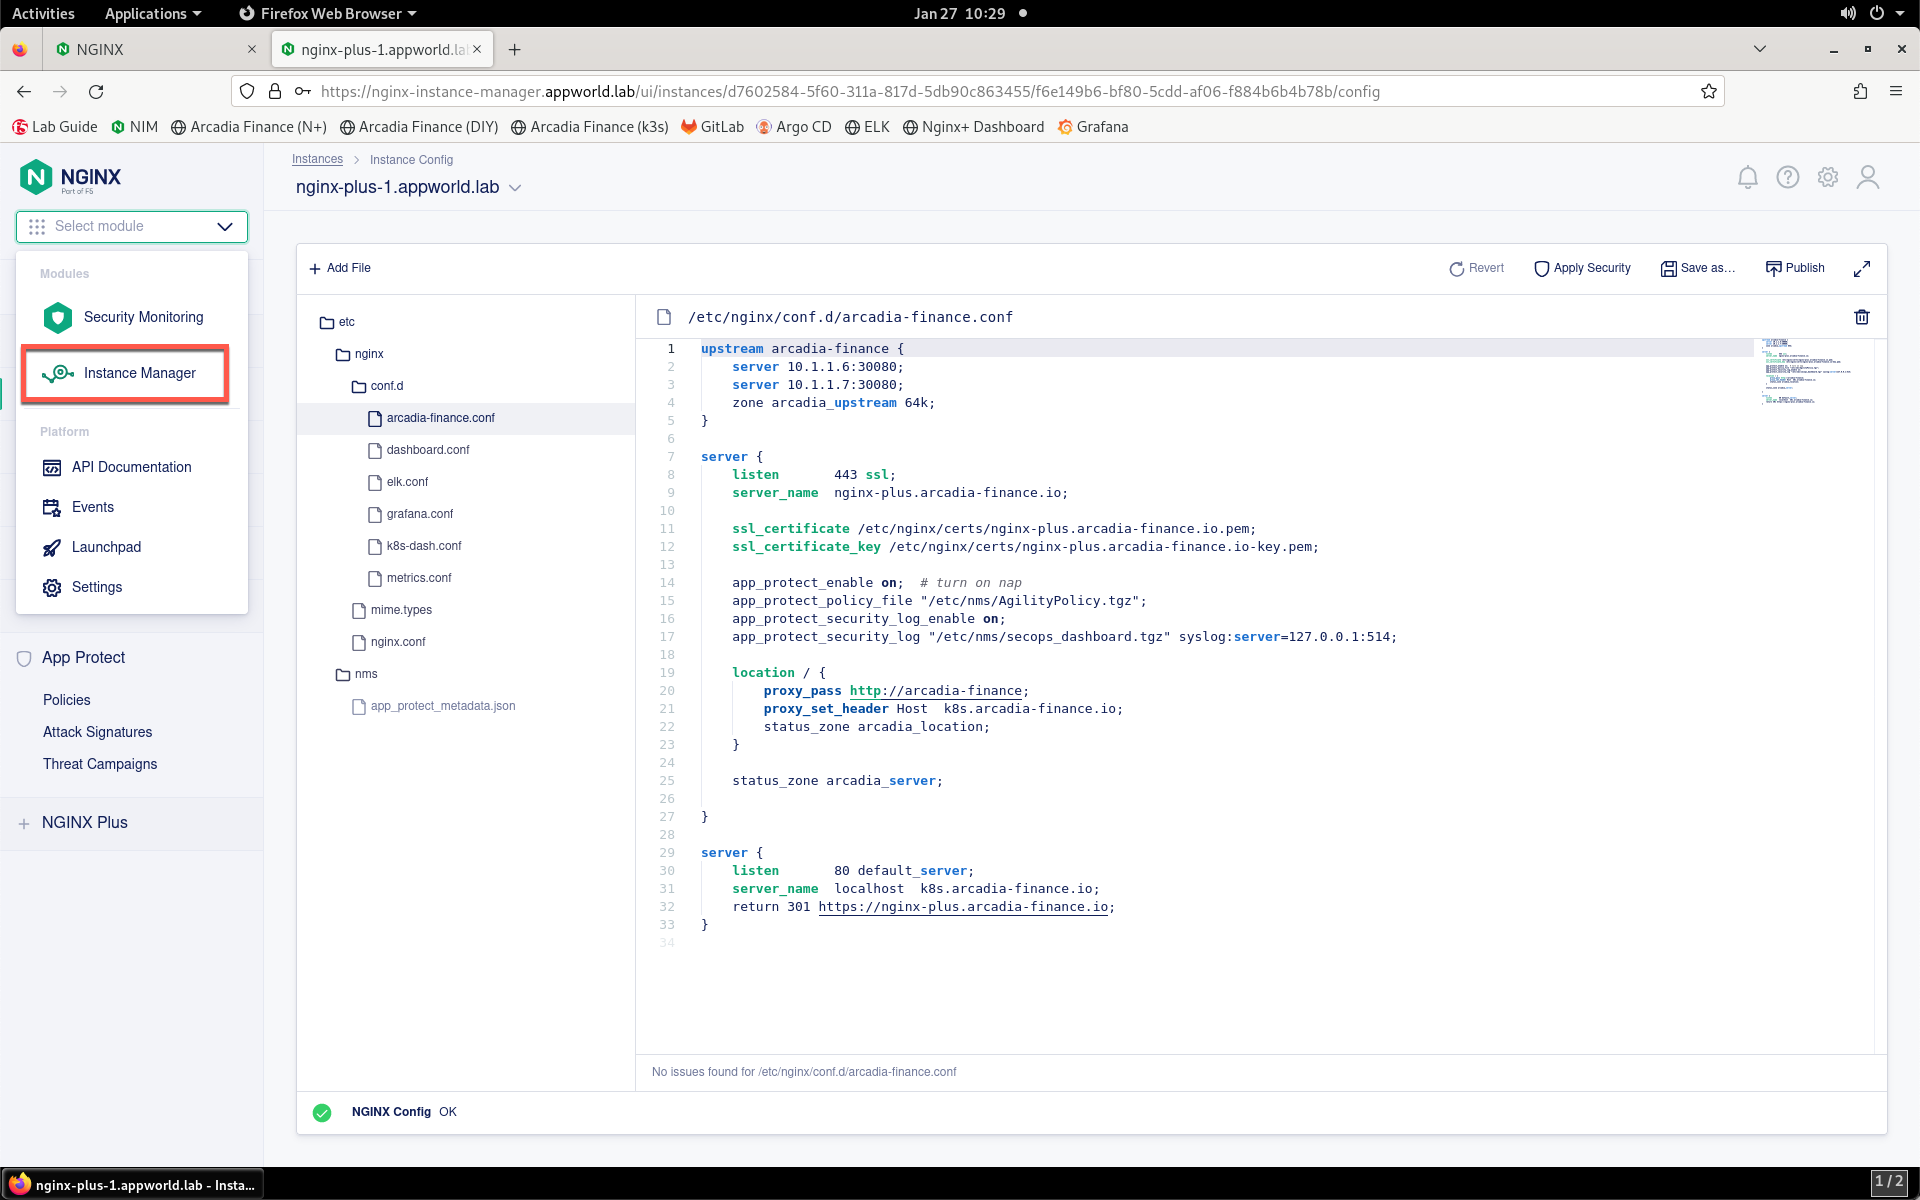
- Click Instance Manager in the drop-down.
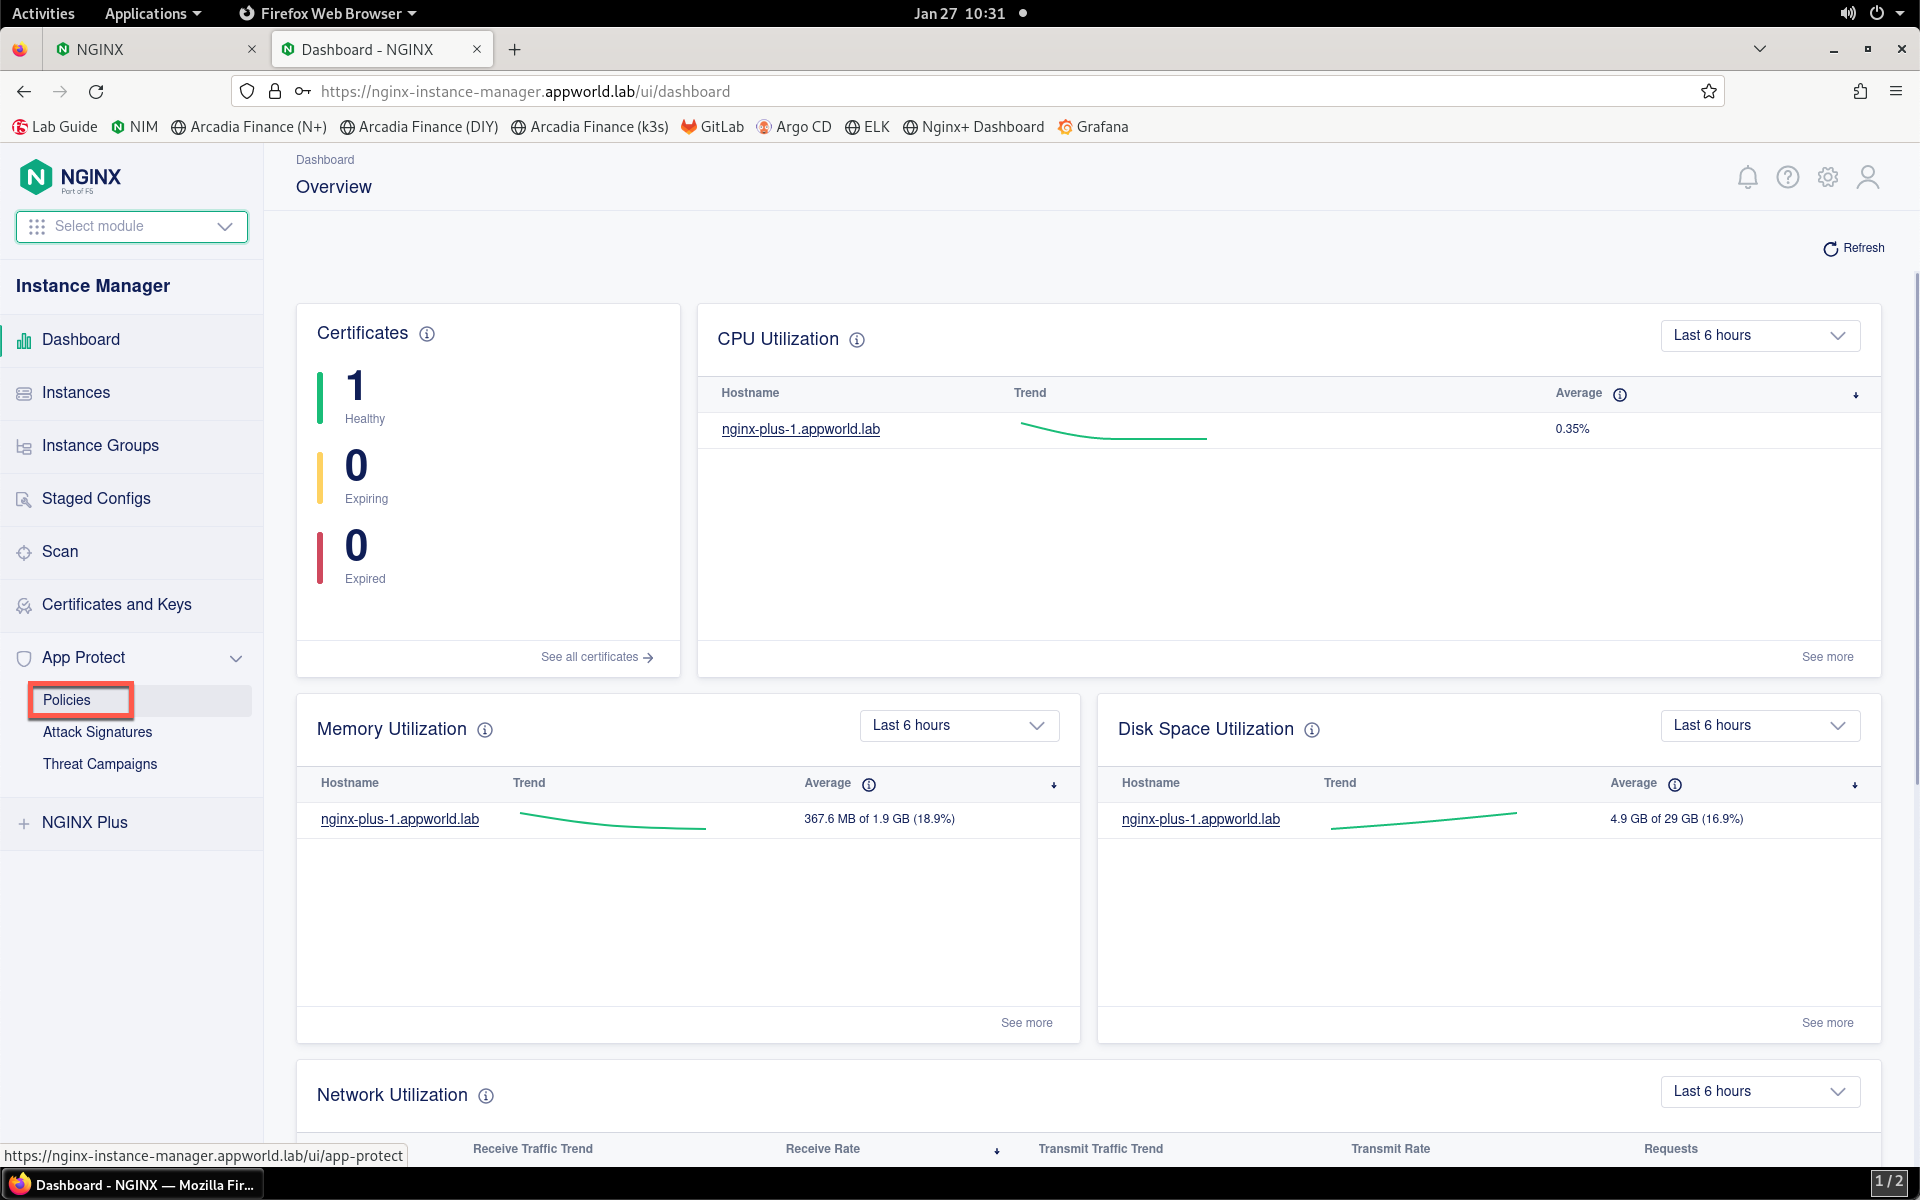
- Take a look at the NGINX App Protect policies that exist in NIM. Click on App Protect -> Policies towards the bottom of the Instance Manager menu bar.
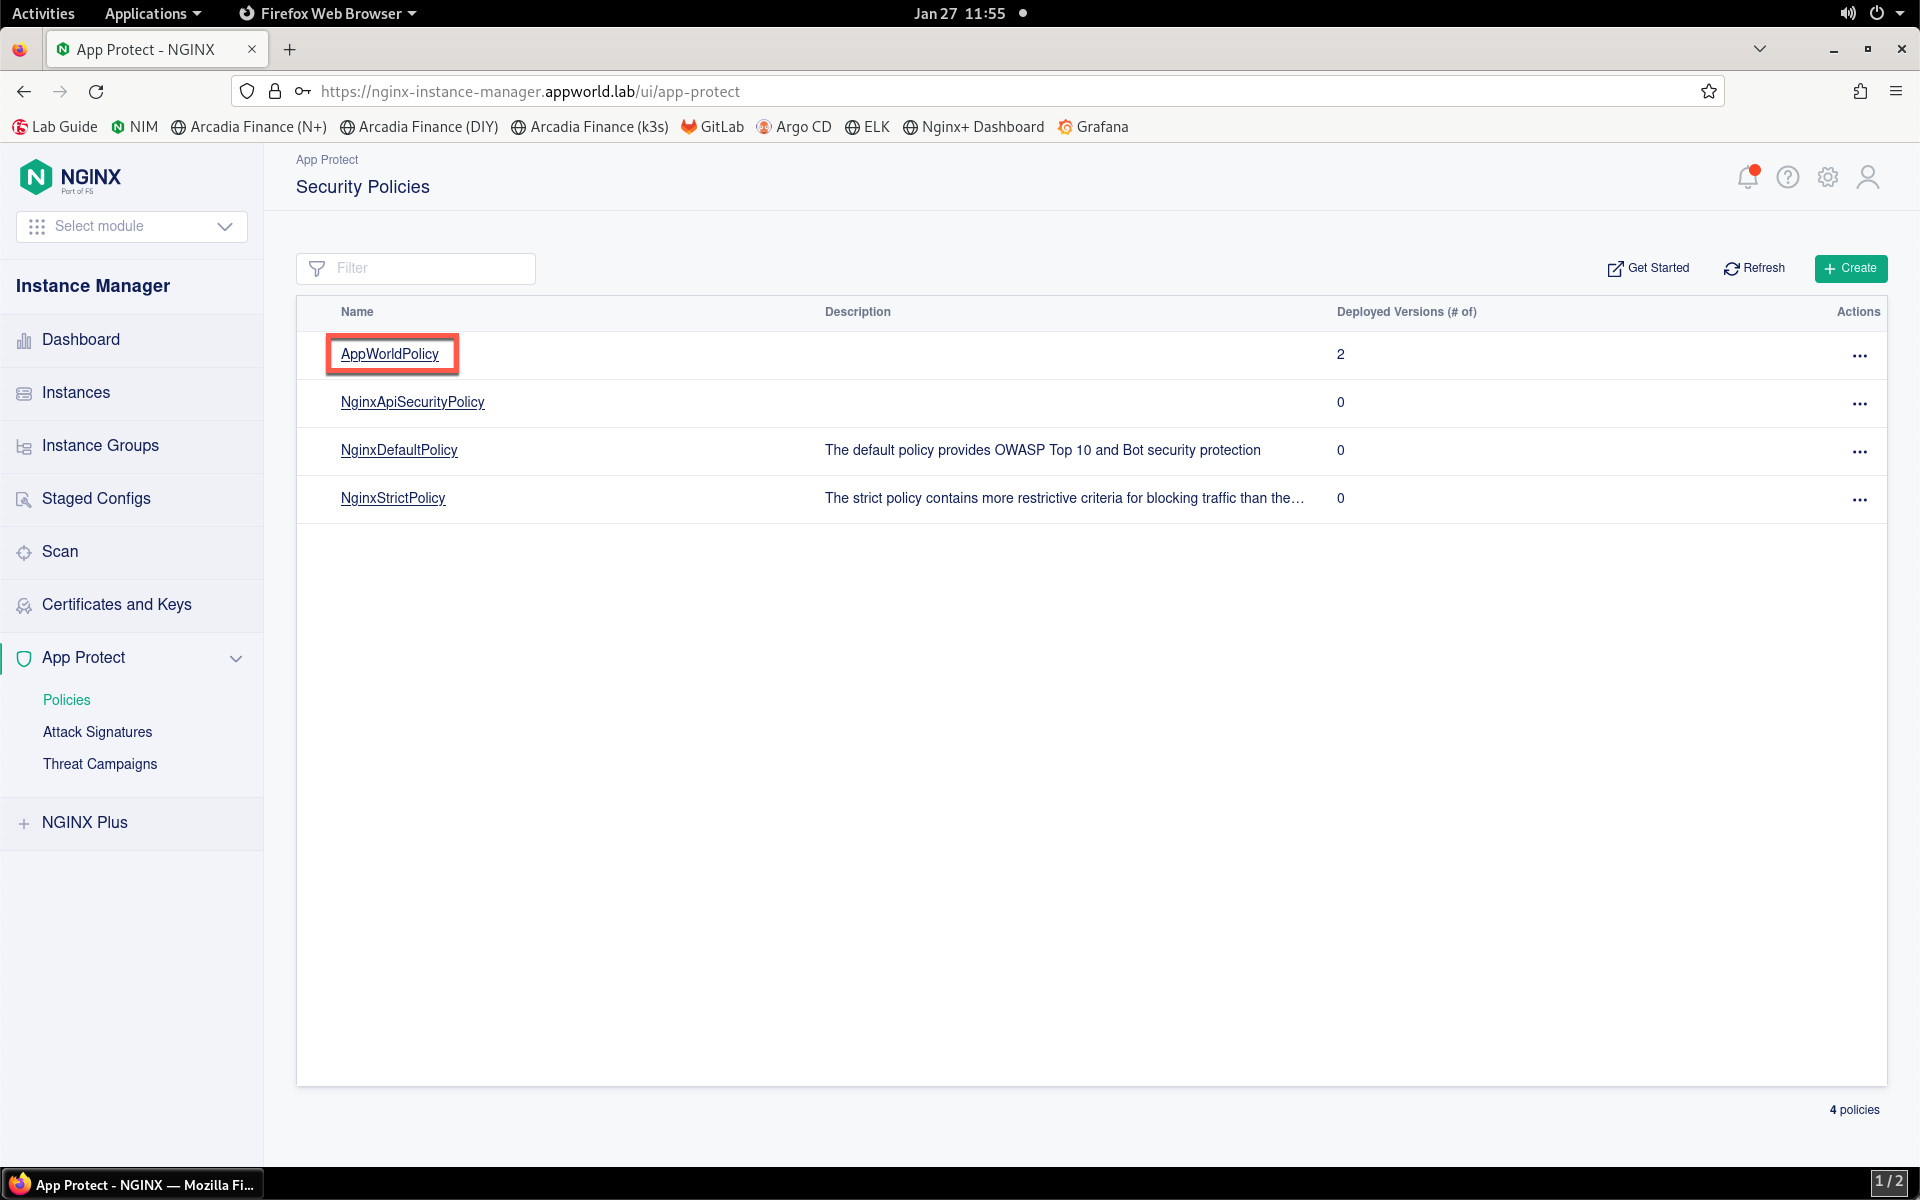
- You should see a list of existing WAF policies. You can see four policies configured. Notice that only the AppWorldPolicy is applied to an application. Click on the policy name to view more details.
- You’ll see that the policy is applied to an NGINX instance. The version of the policy that is applied is also shown. Click on the Versions sub-tab to see existing versions of this policy.
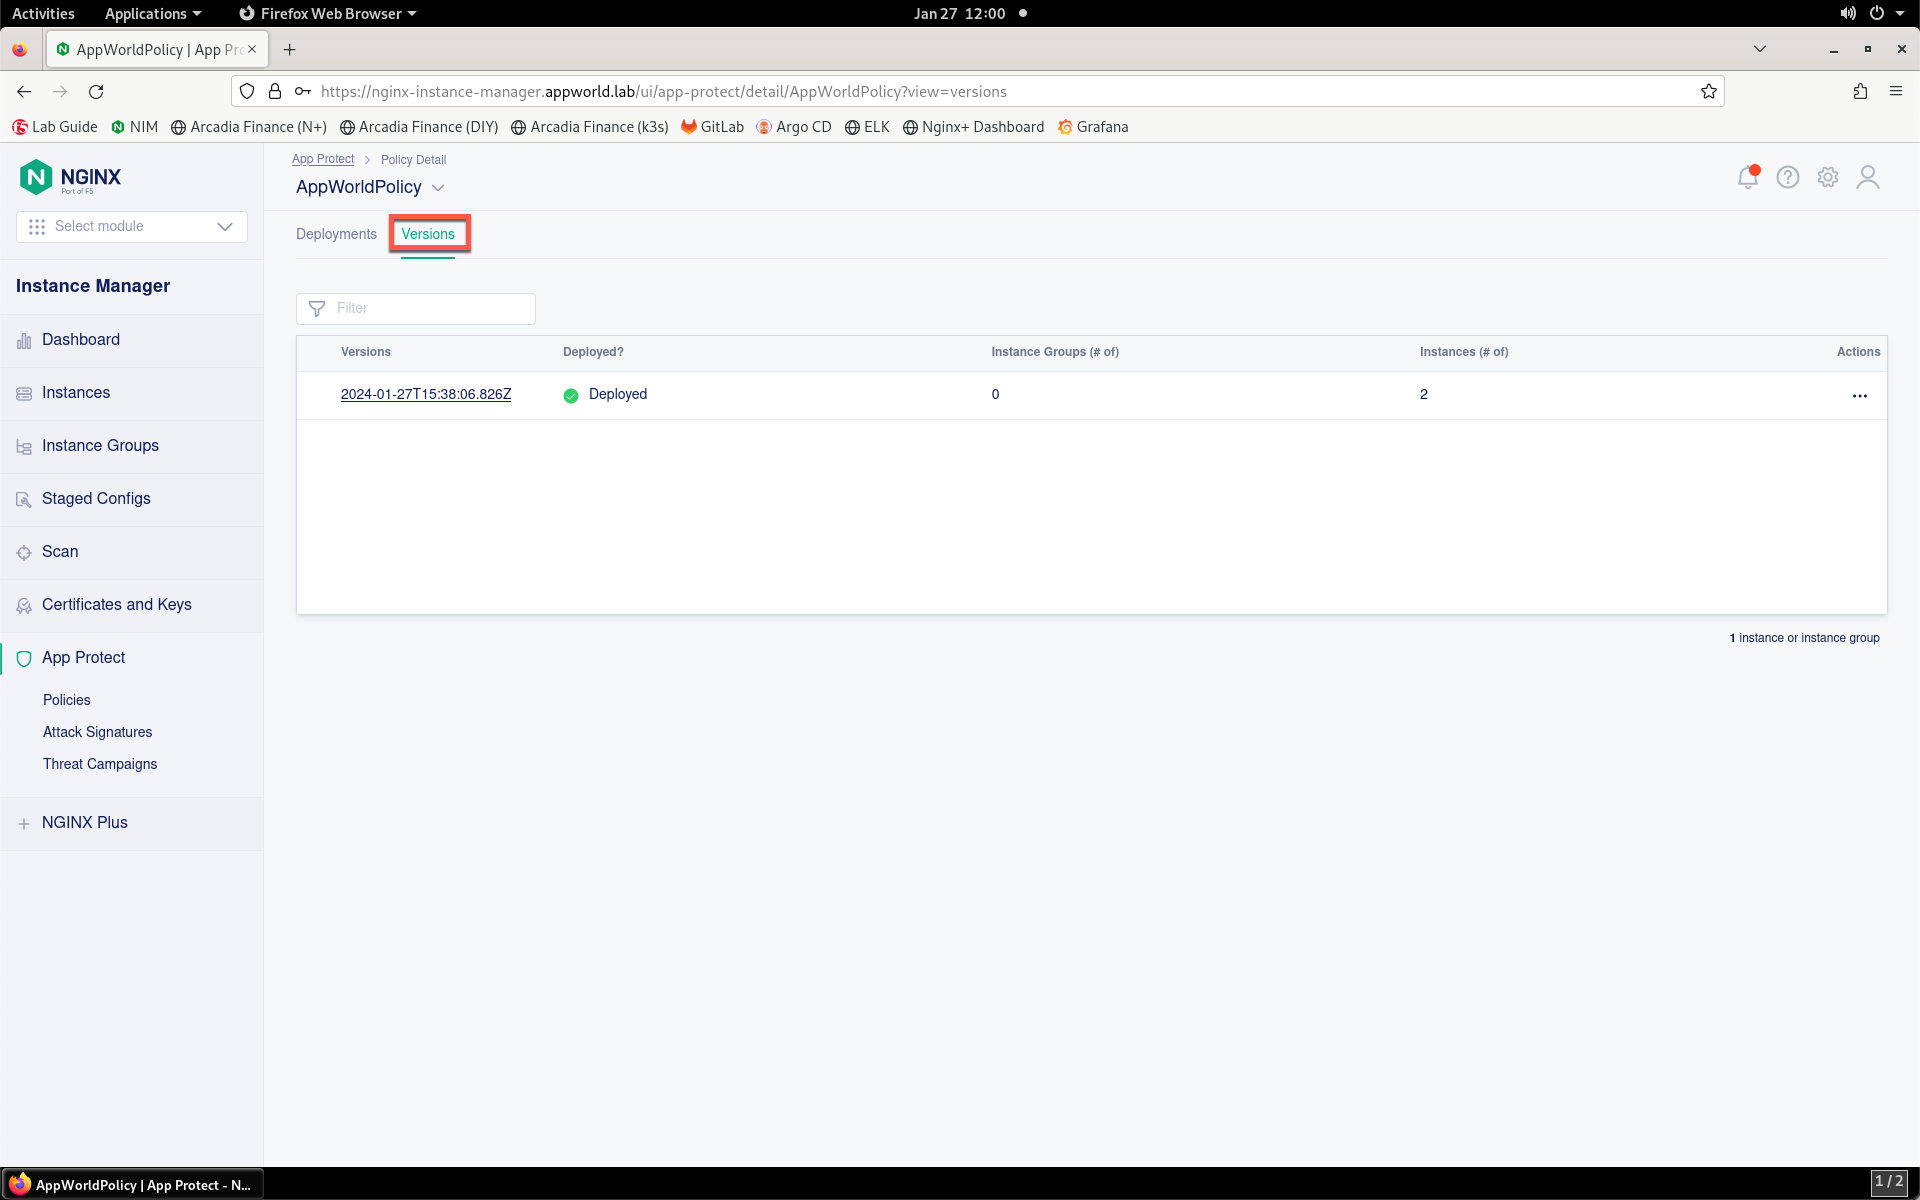
- Notice that currently there is only one version. Click on the version name of the policy version in the list.
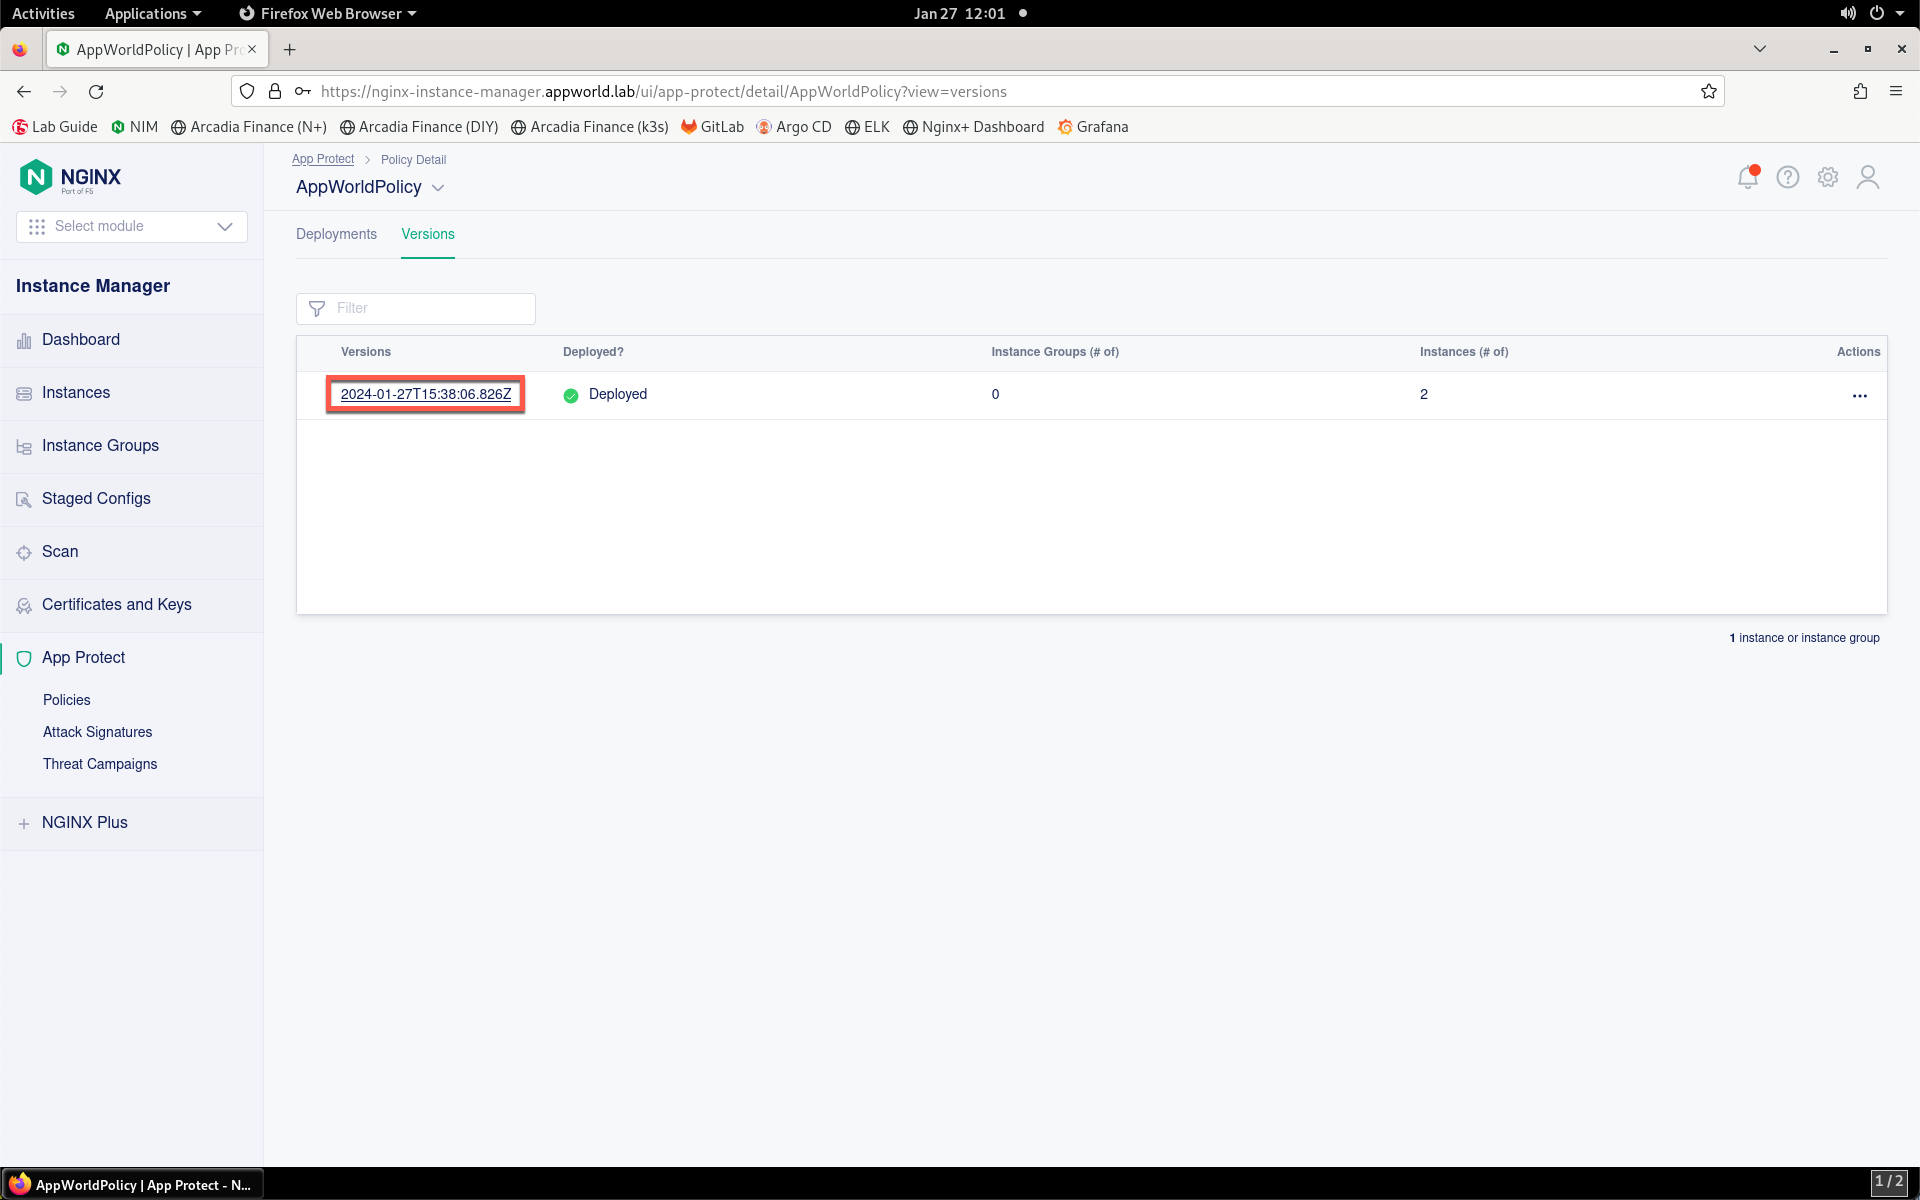
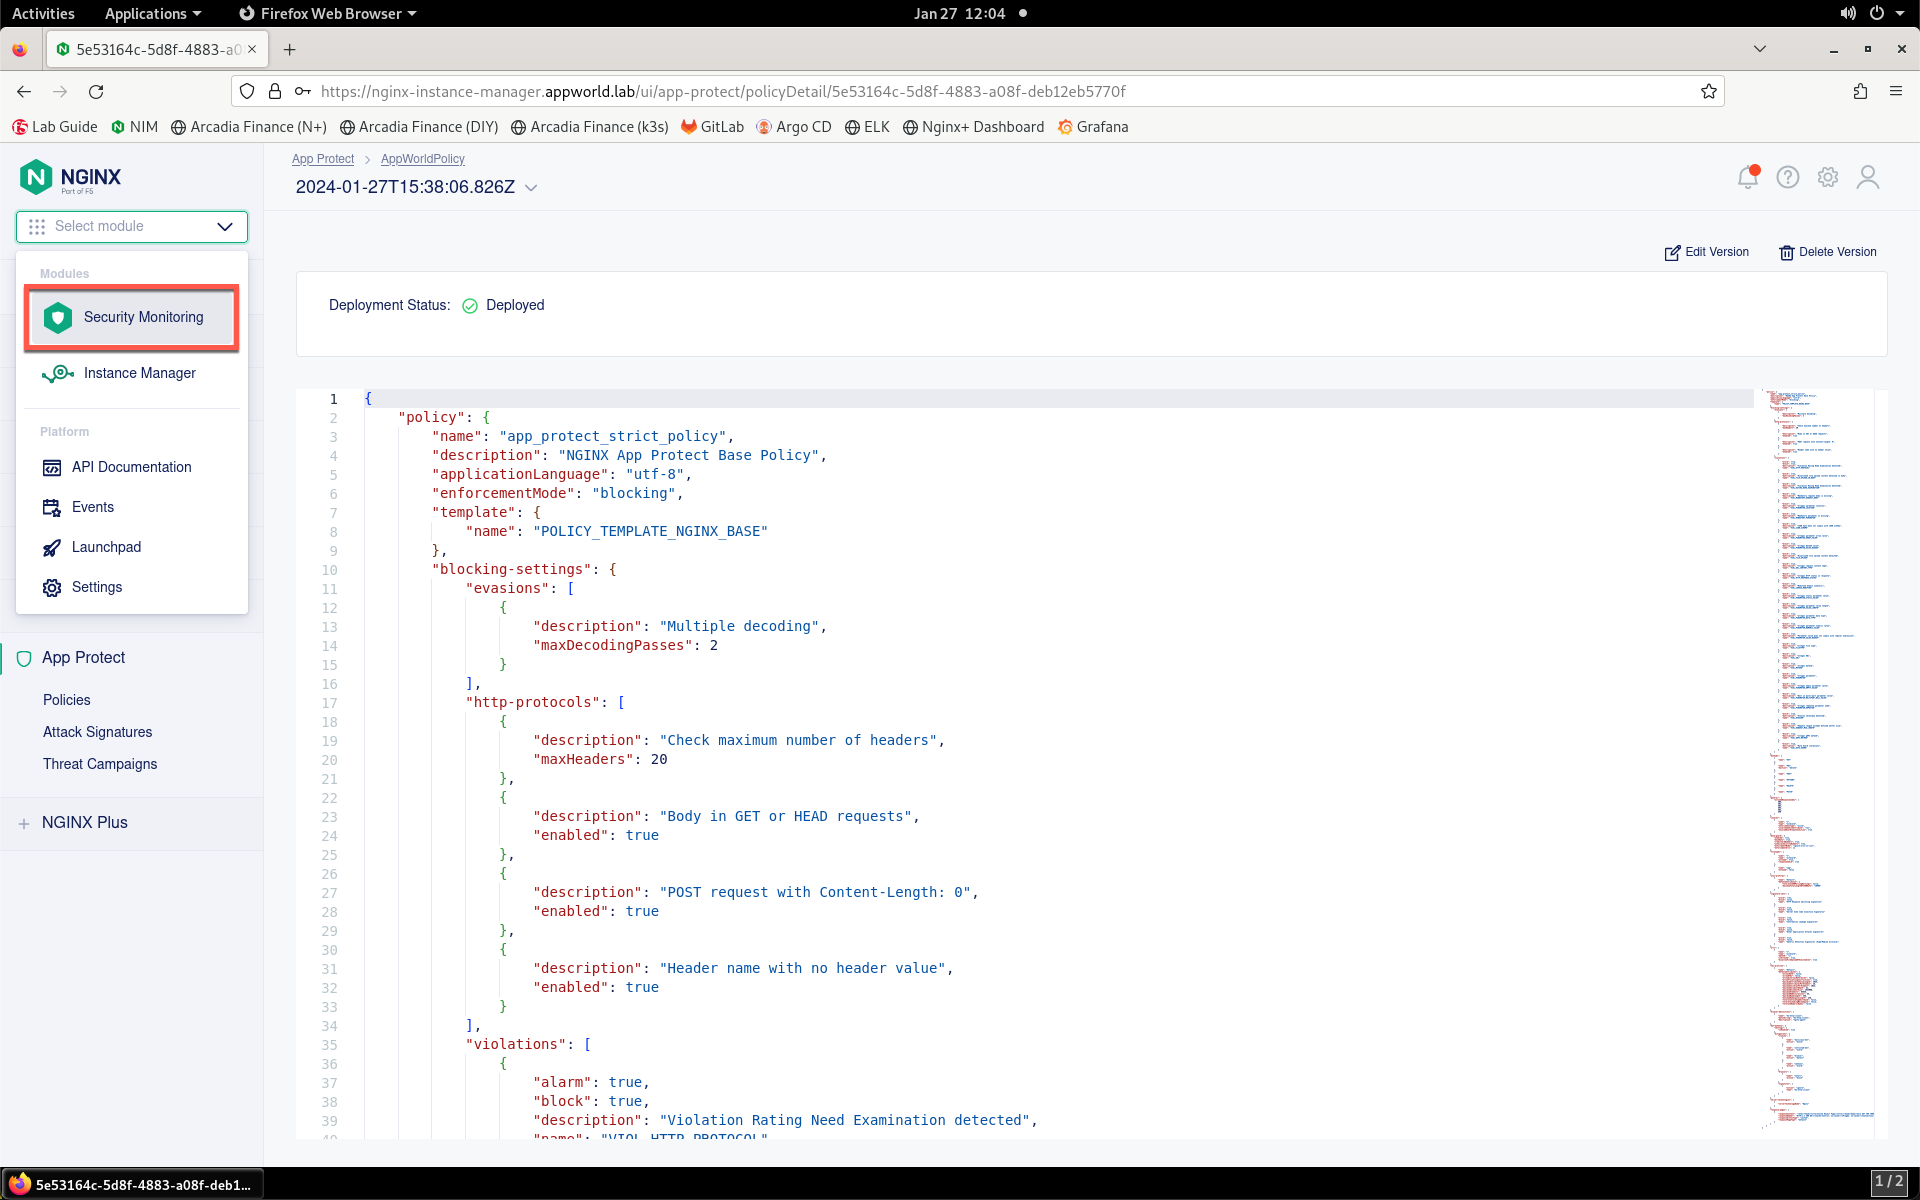
- You will see the JSON configuration for this WAF policy. Scroll through the WAF policy to briefly view the policy configuration. You can see actions configured for particular violations, blocked file types, HTTP verbs, and more. Don’t make any changes just yet.
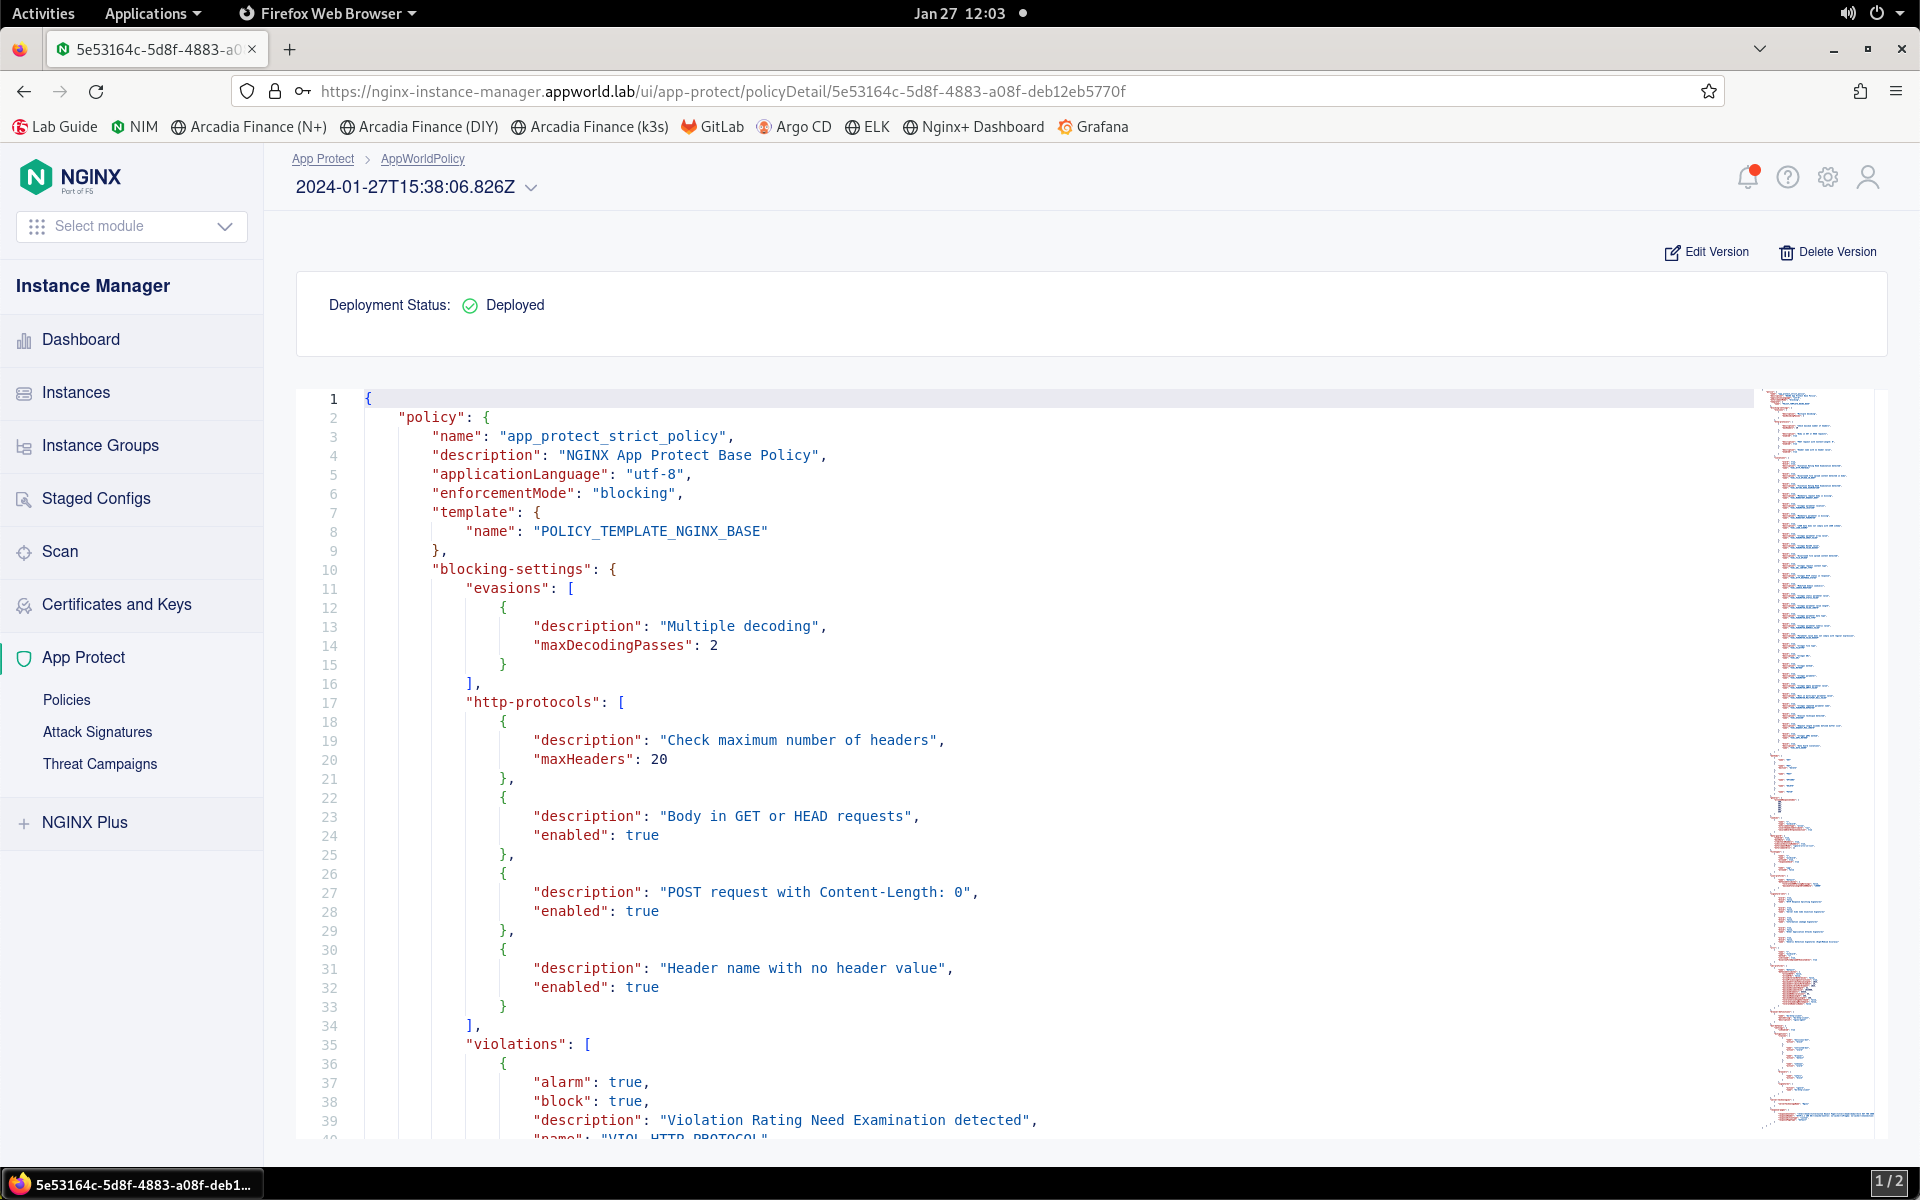
- Now you can view metrics surrounding the App Protect instance. Click the Select module drop-down from the top of the left menu bar.
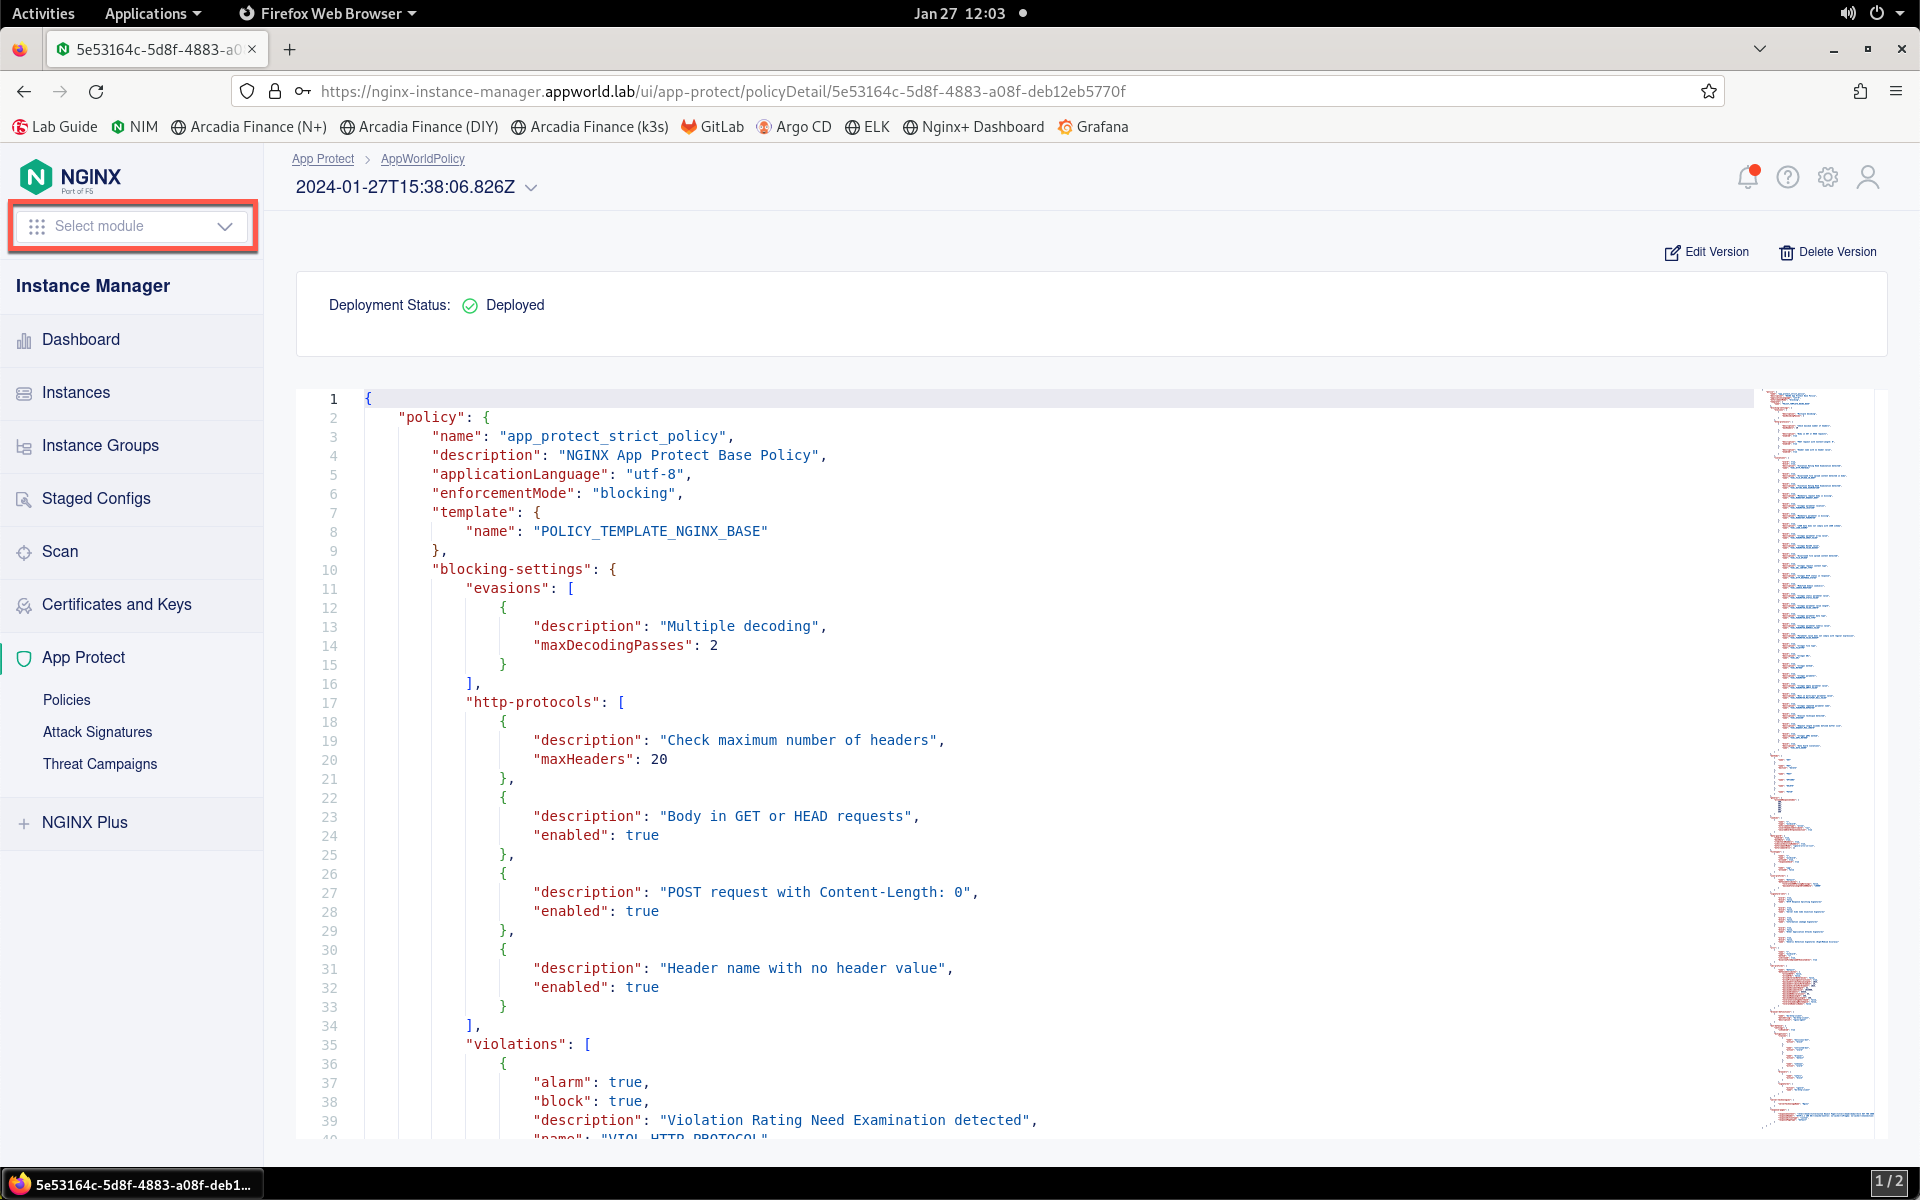
- Select Security Monitoring from the drop-down.
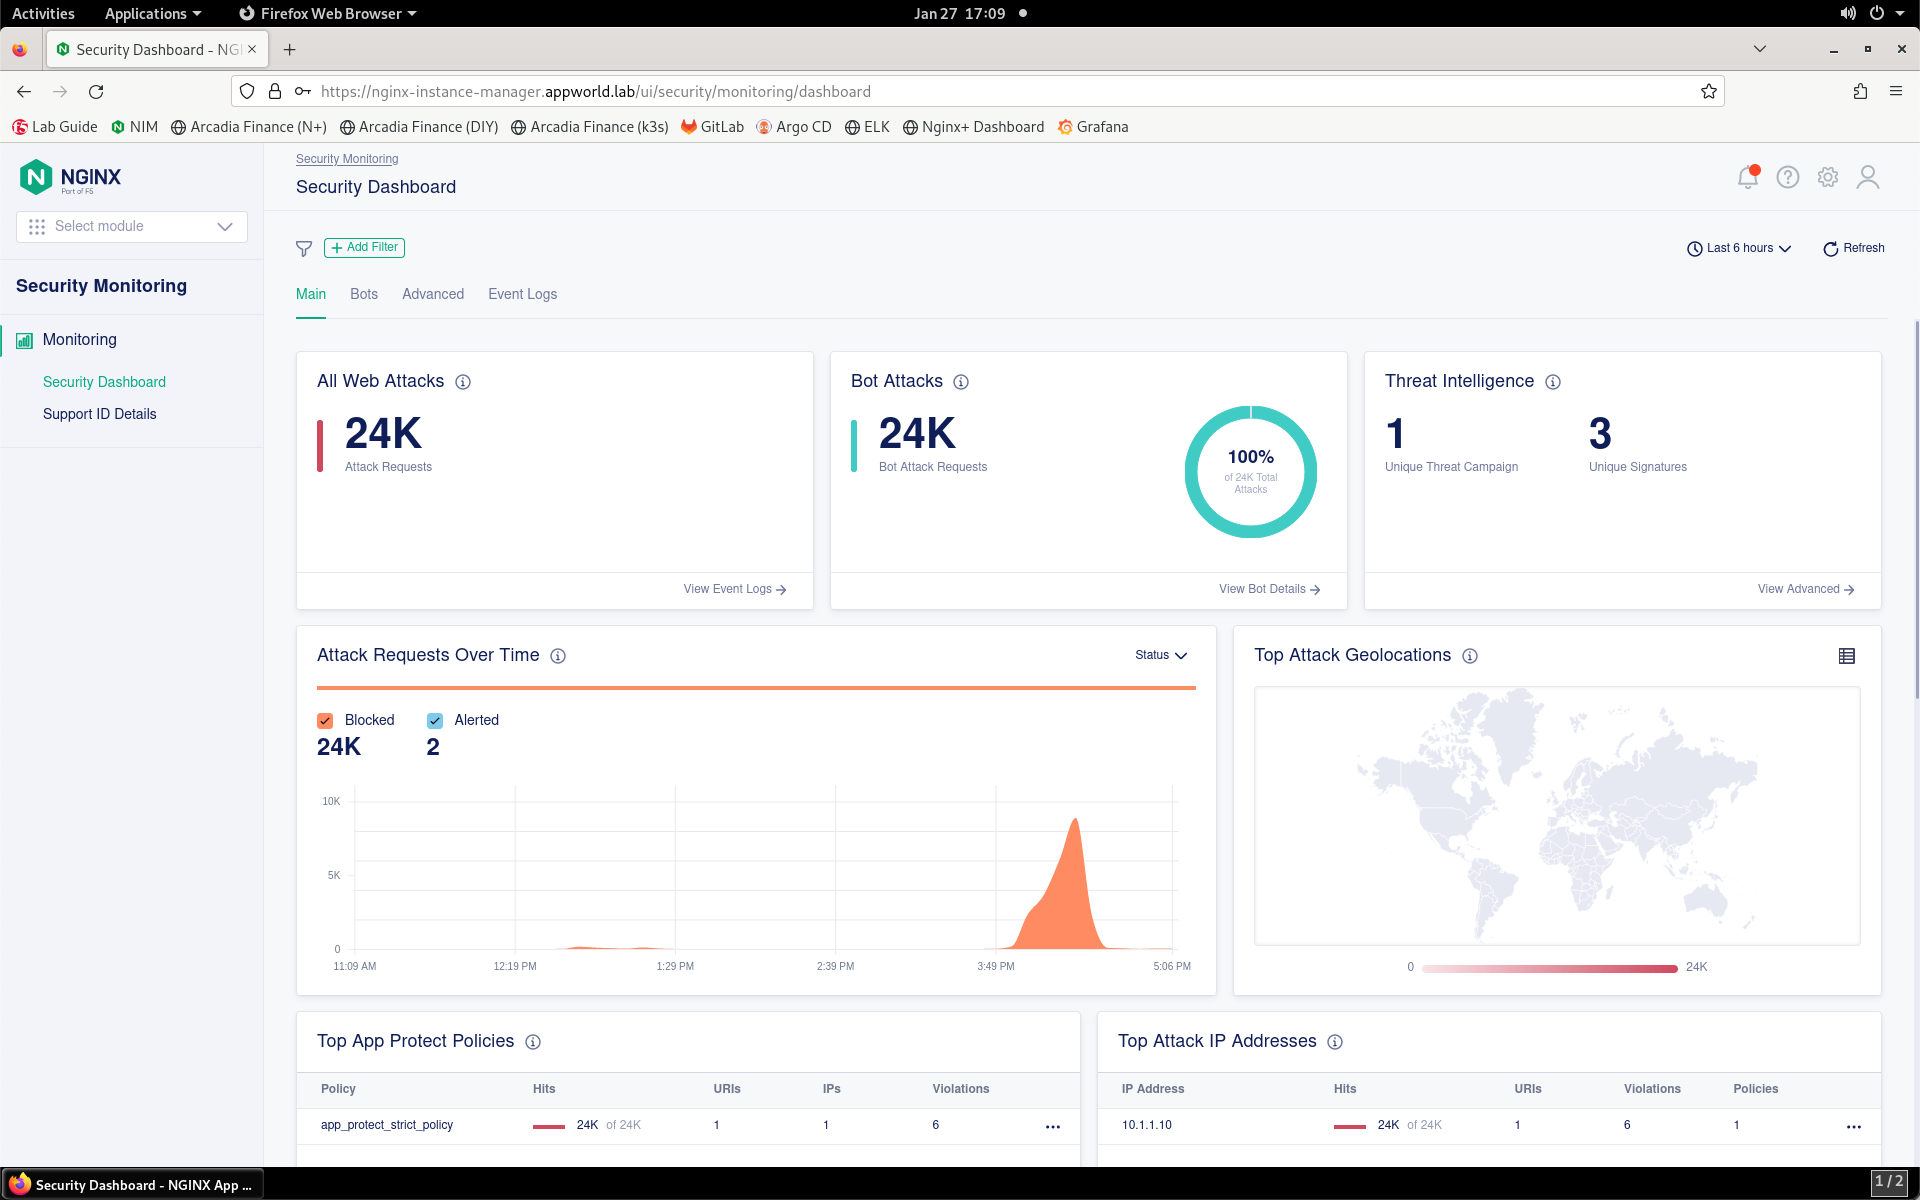
- The Security Dashboard page will load, as shown below.
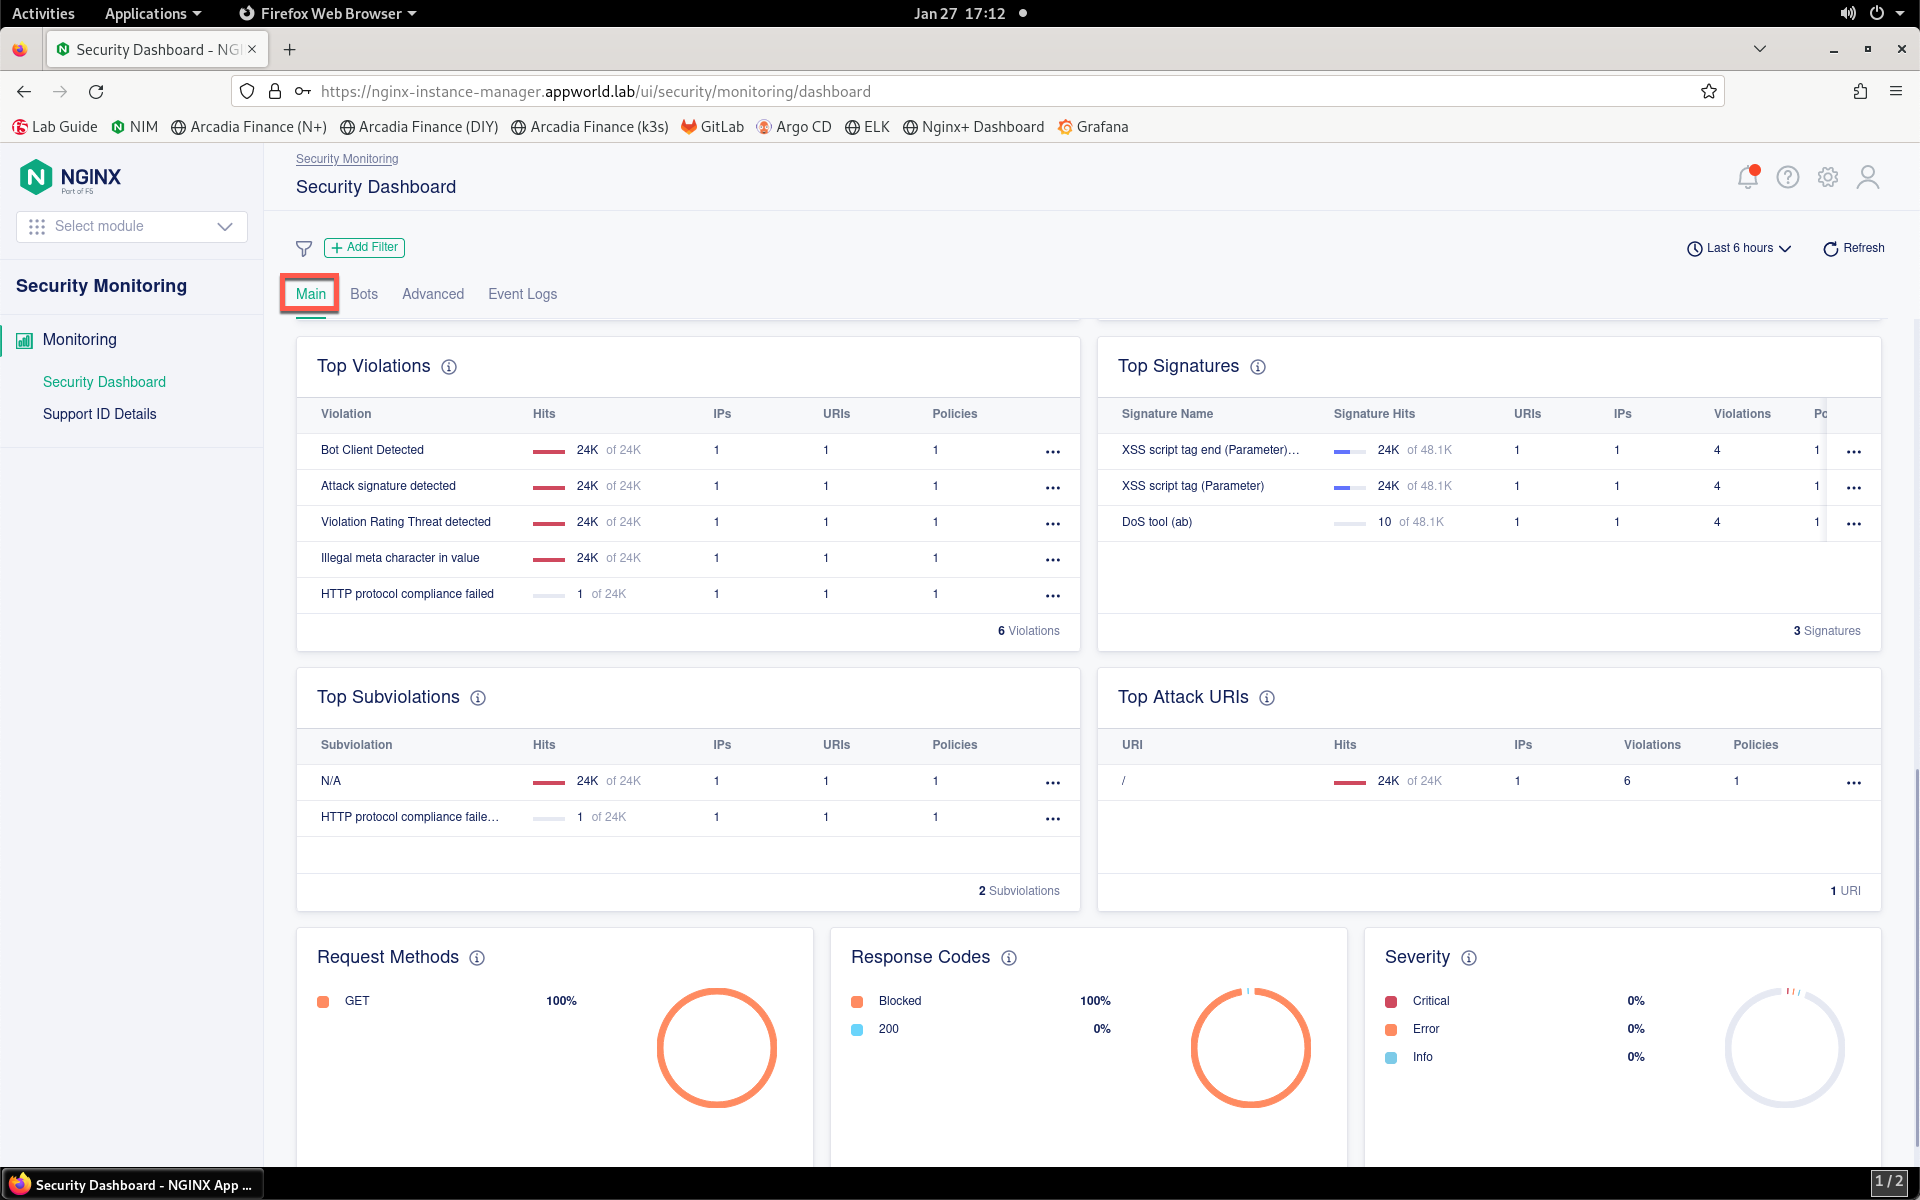
- Scroll down through the Main tab to see statistics surrounding attack traffic types, IP addresses, violations, URIs, and more.
- Click the Bots tab.
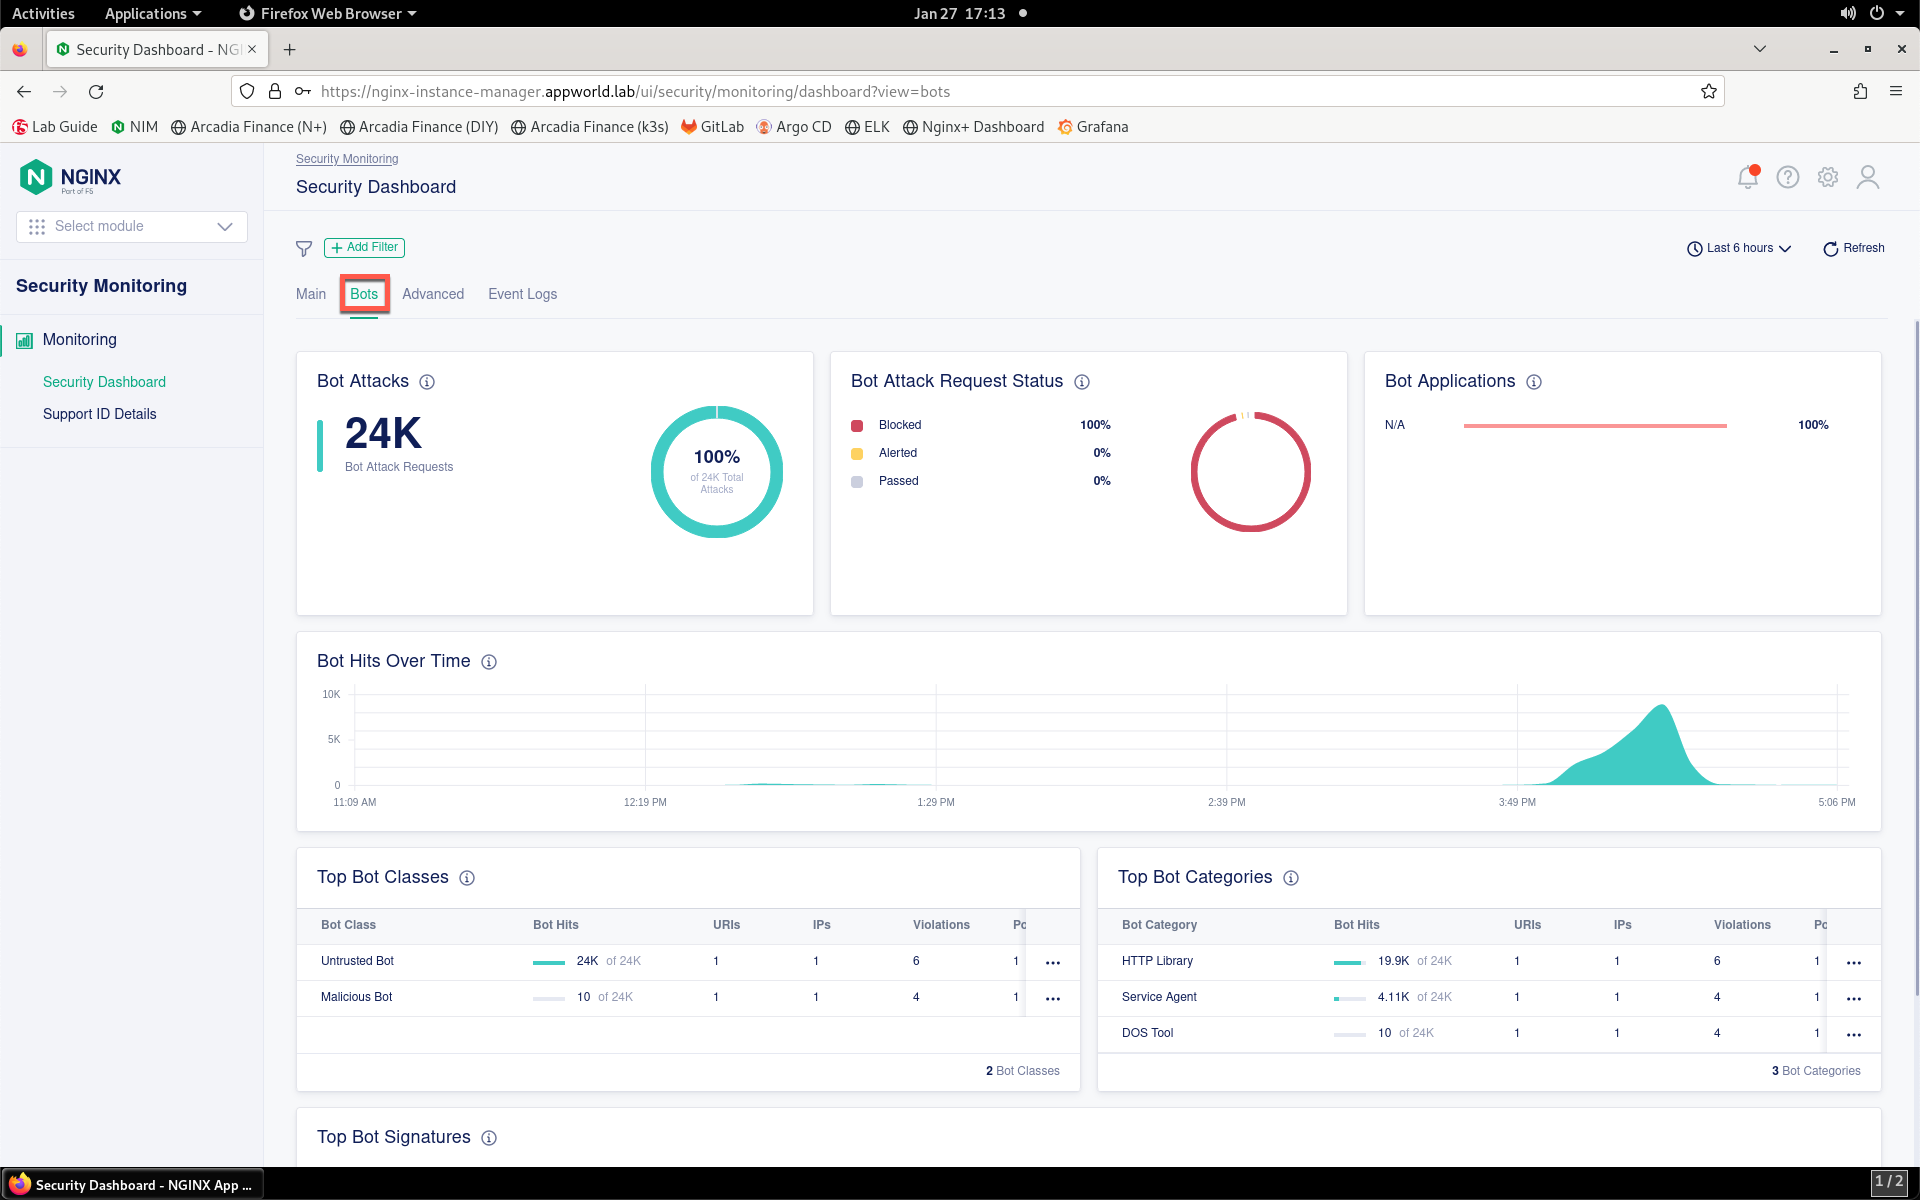
- This tab shows information around bot traffic detected by App Protect. Scroll down to the Top Bot Classes, Top Bot Categories, and Top Bot Signatures. Click on Untrusted Bot in the Top Bot Classes list.
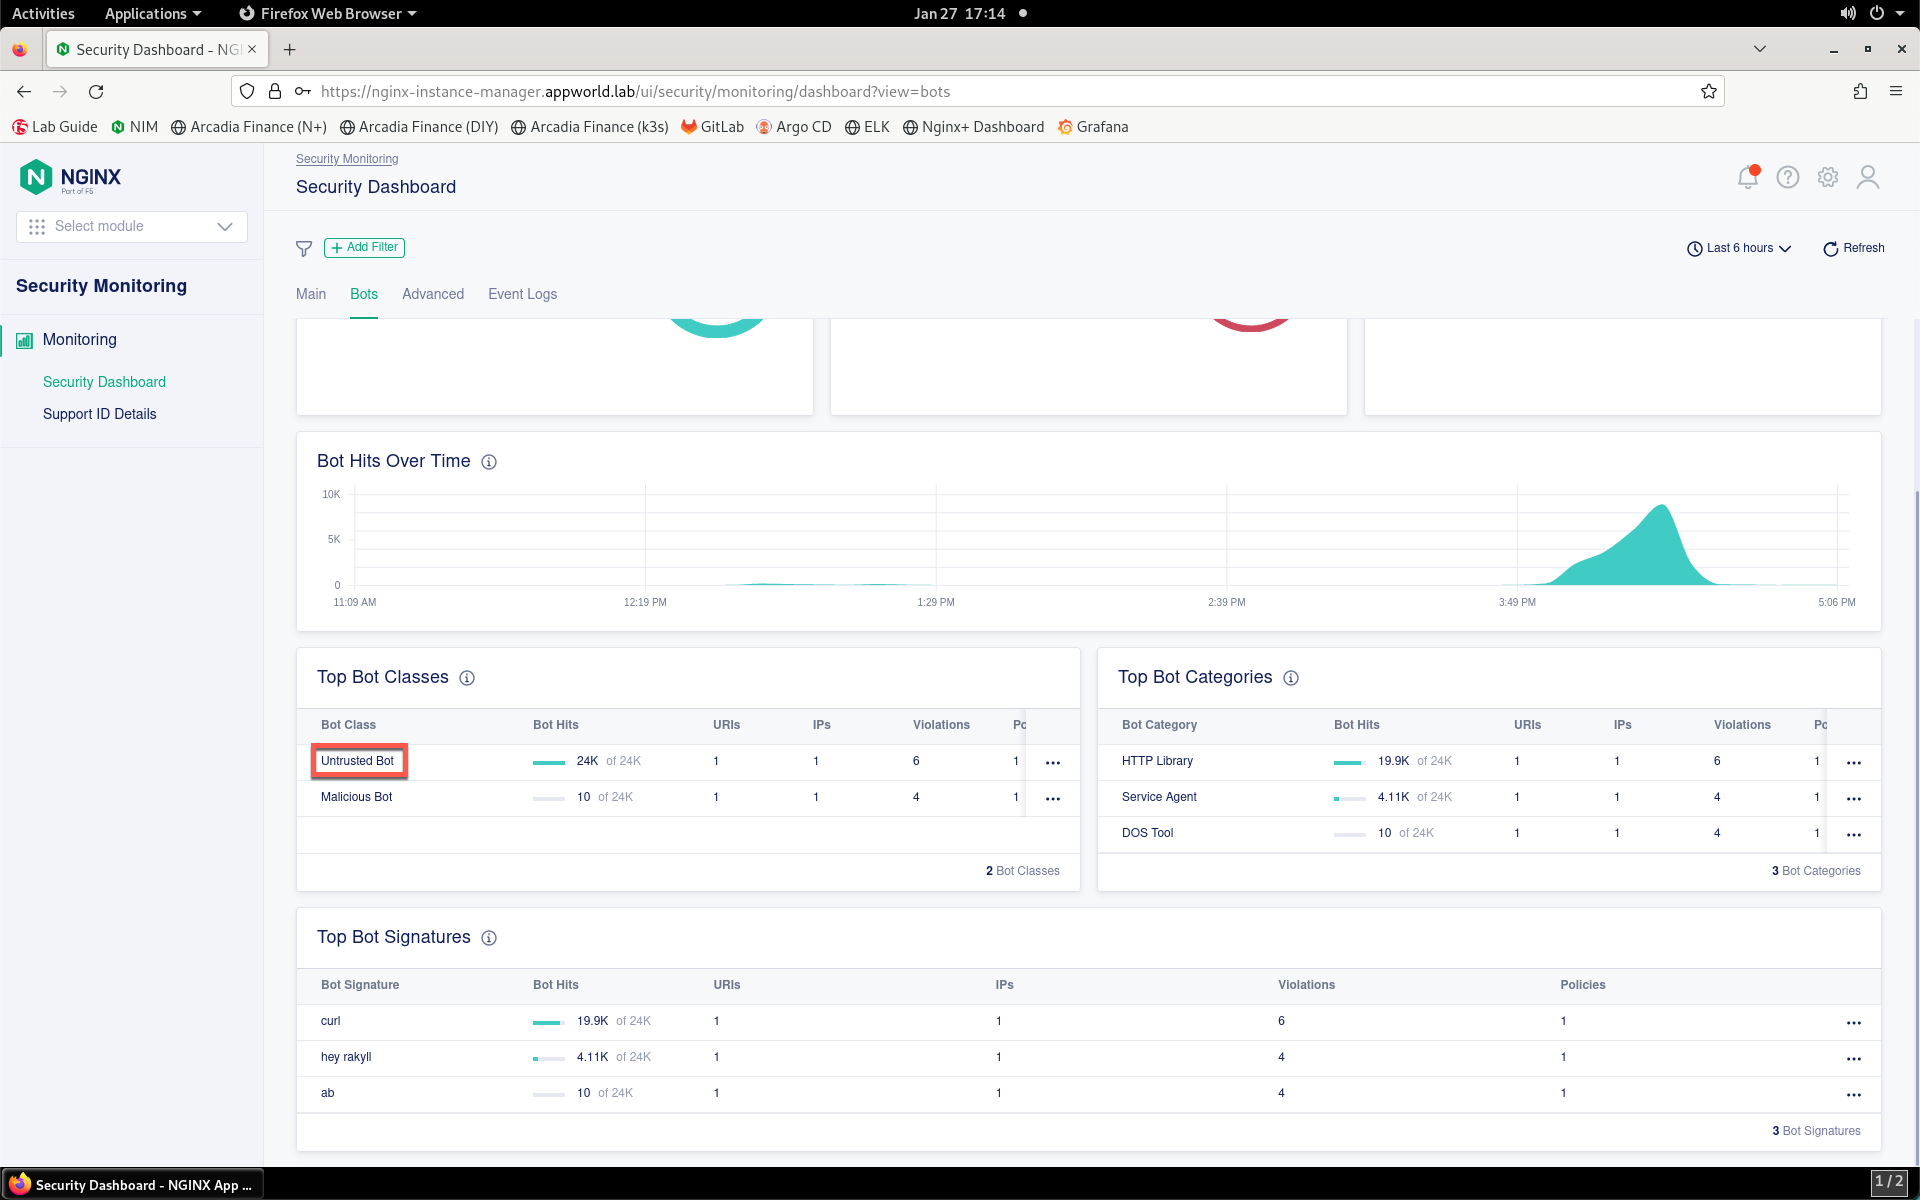
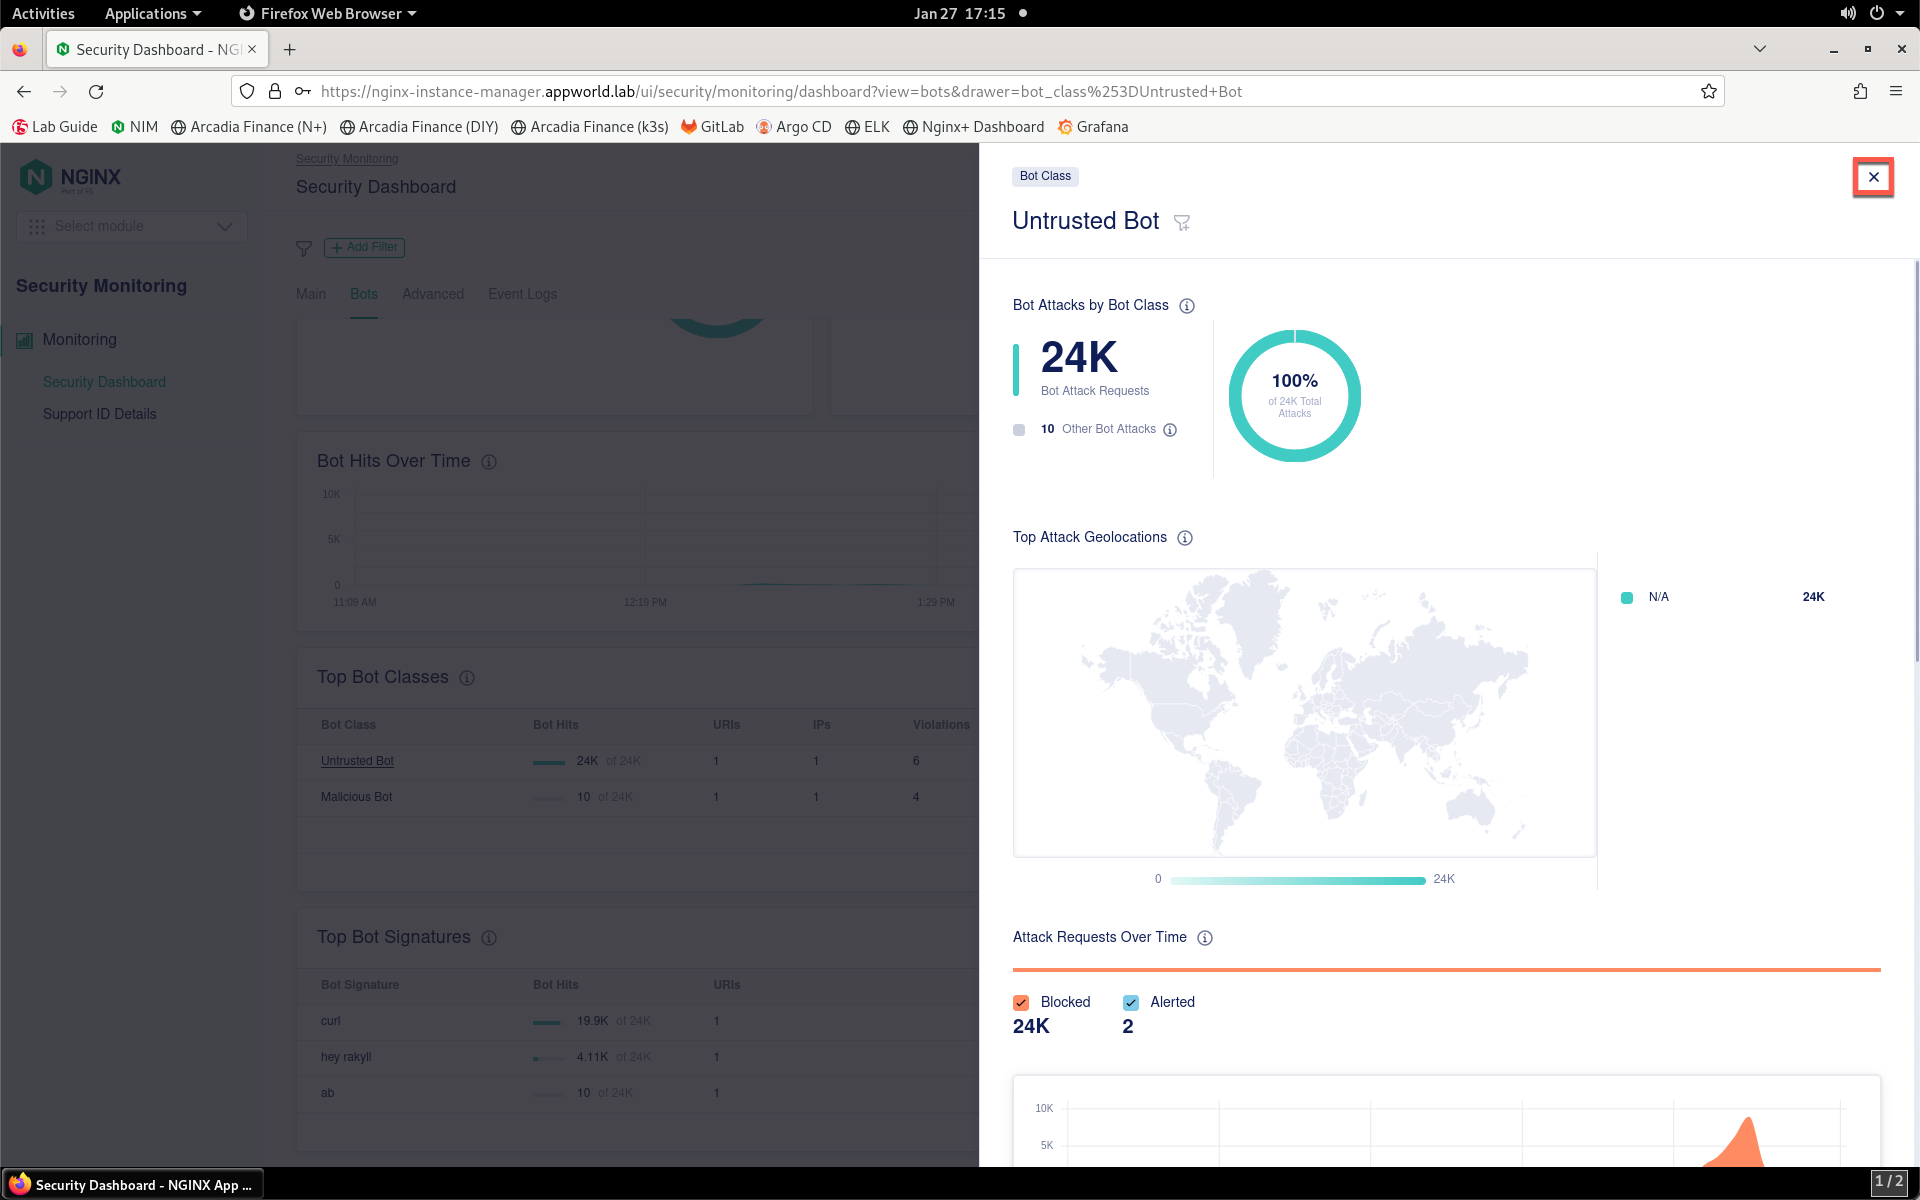
- View extra details around the entry. Close the details box when finished.
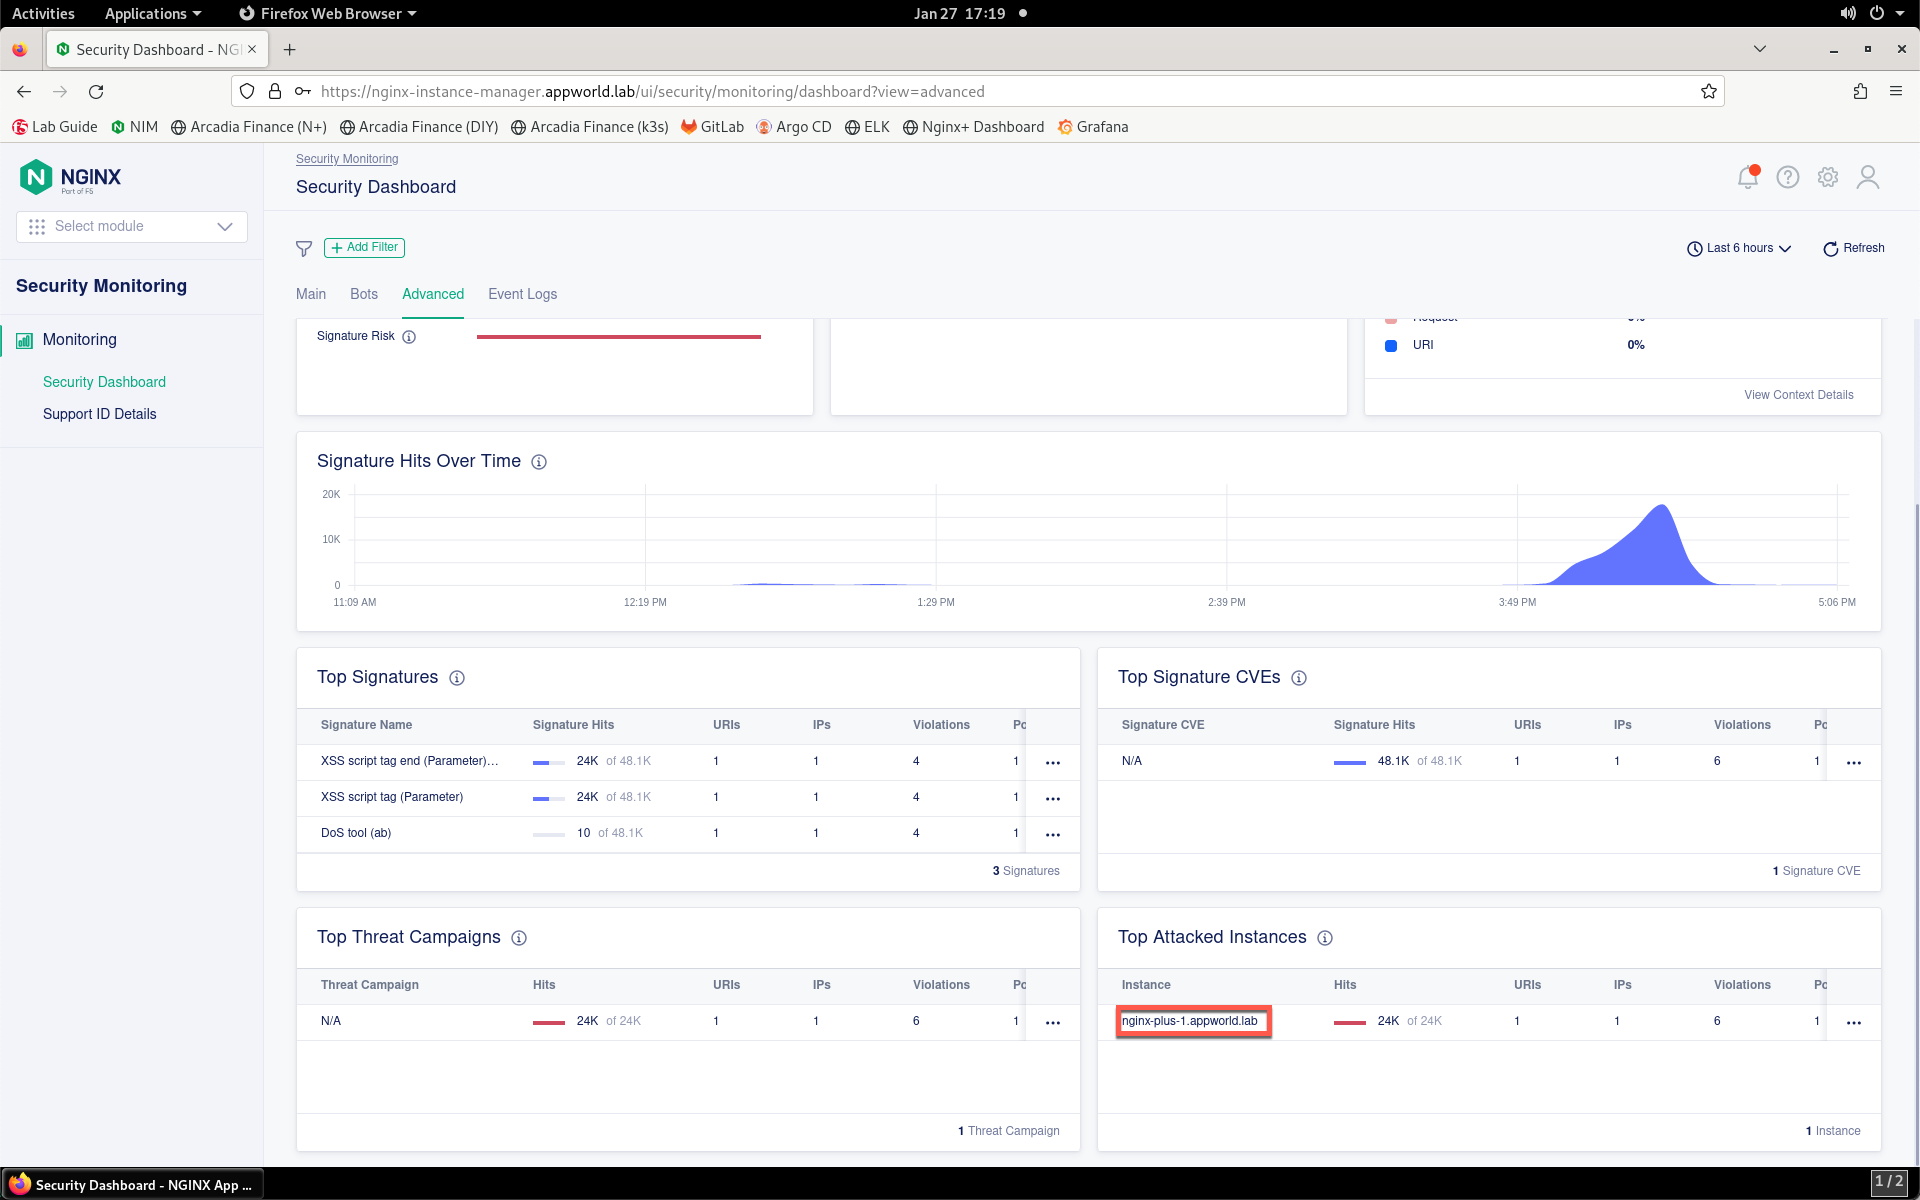
- Click the Advanced tab.
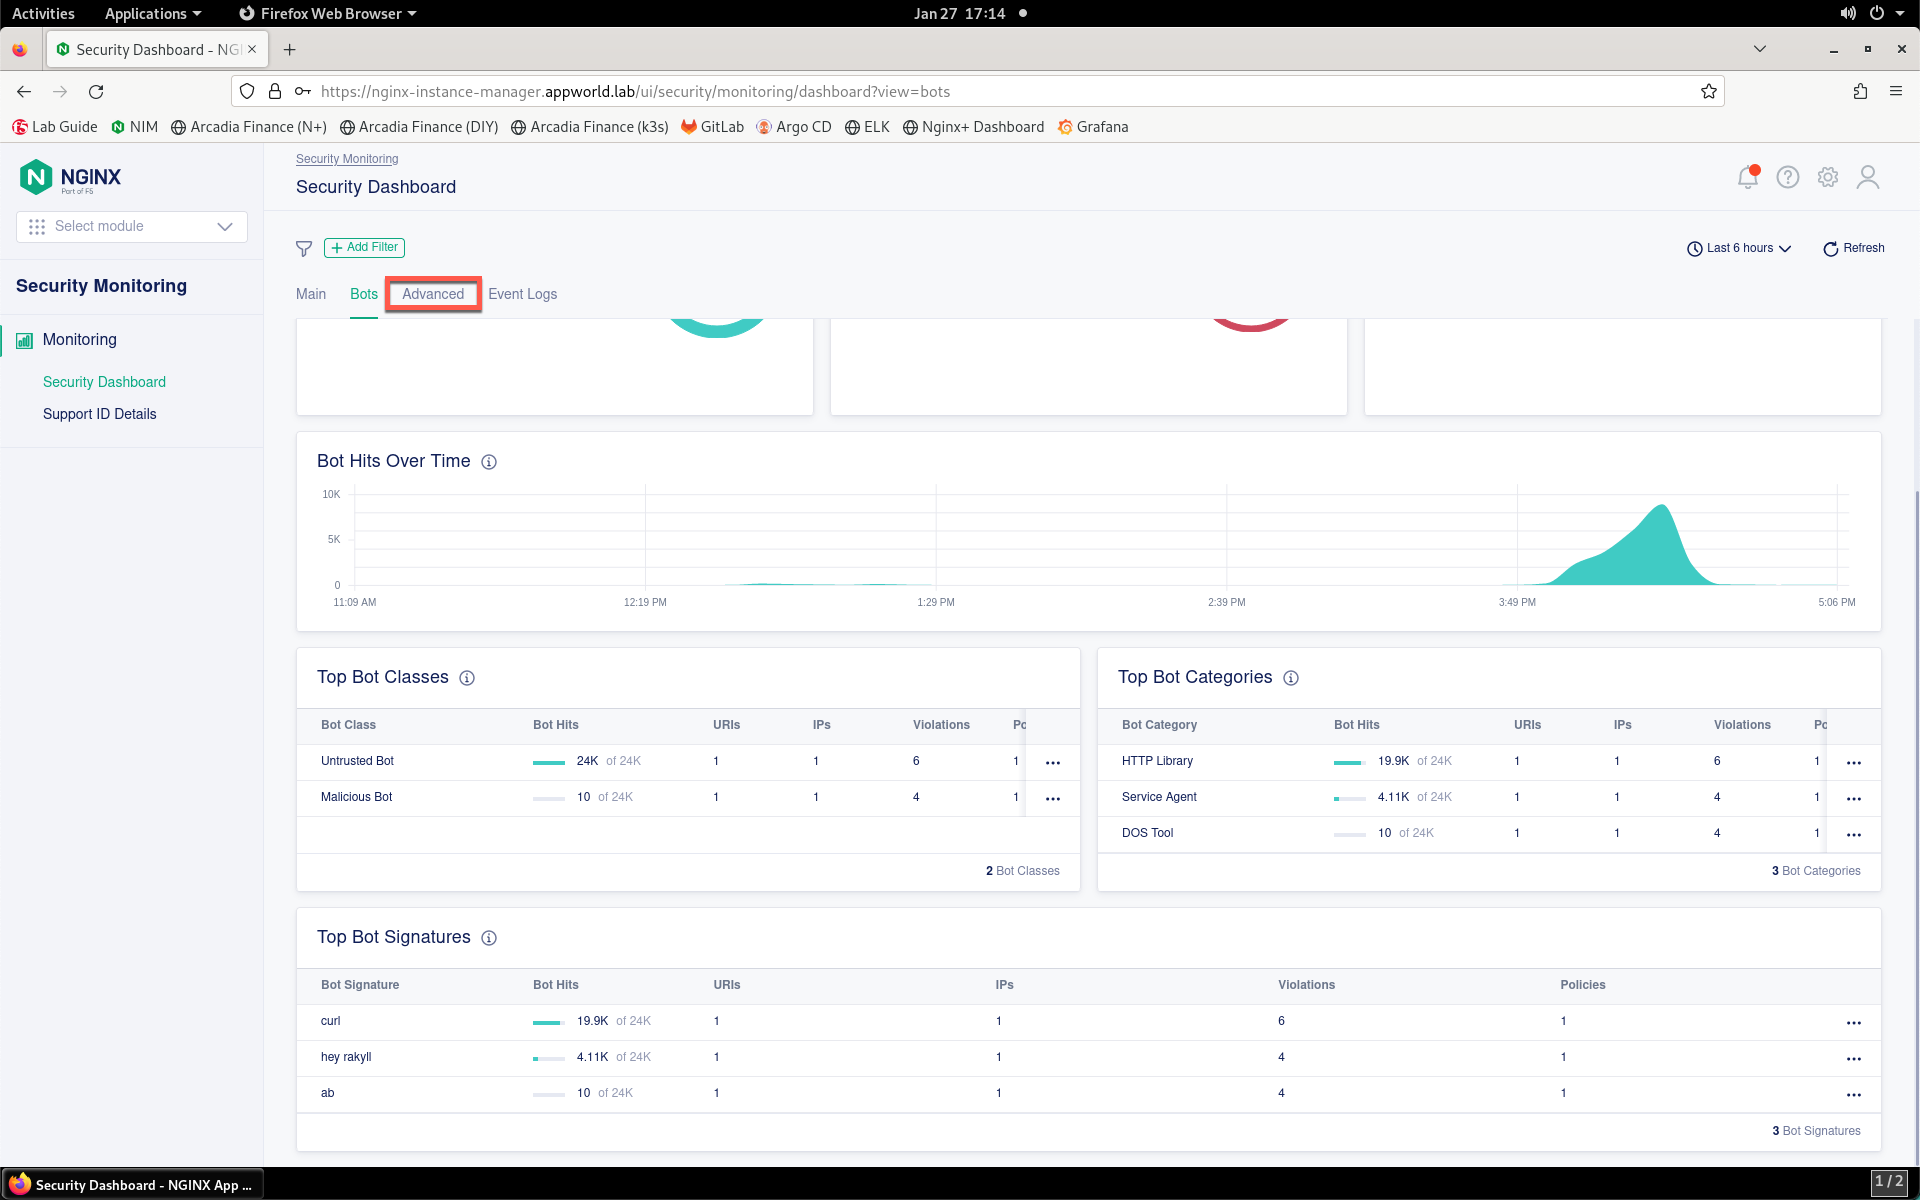
- This tab shows data relating to attacks matching downloaded signatures.
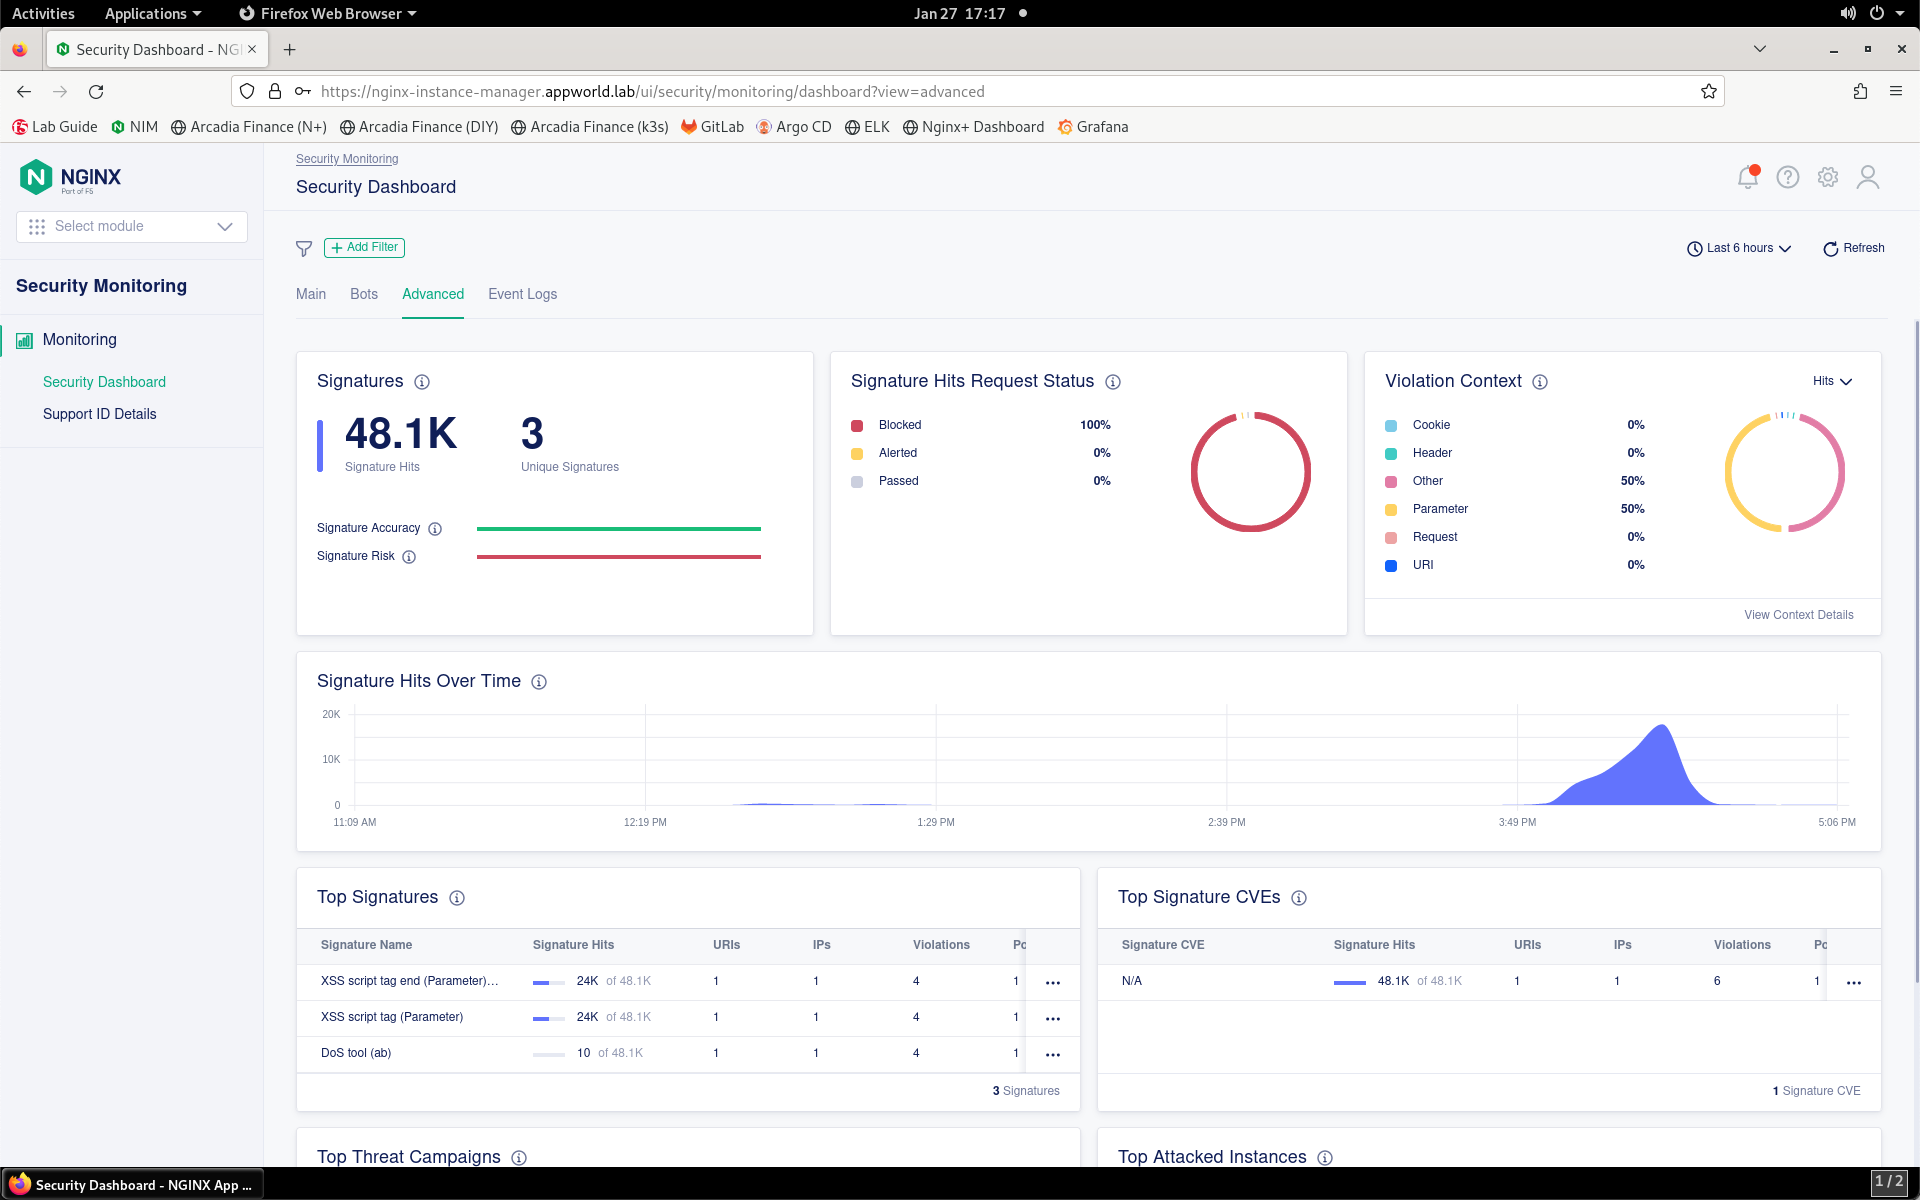
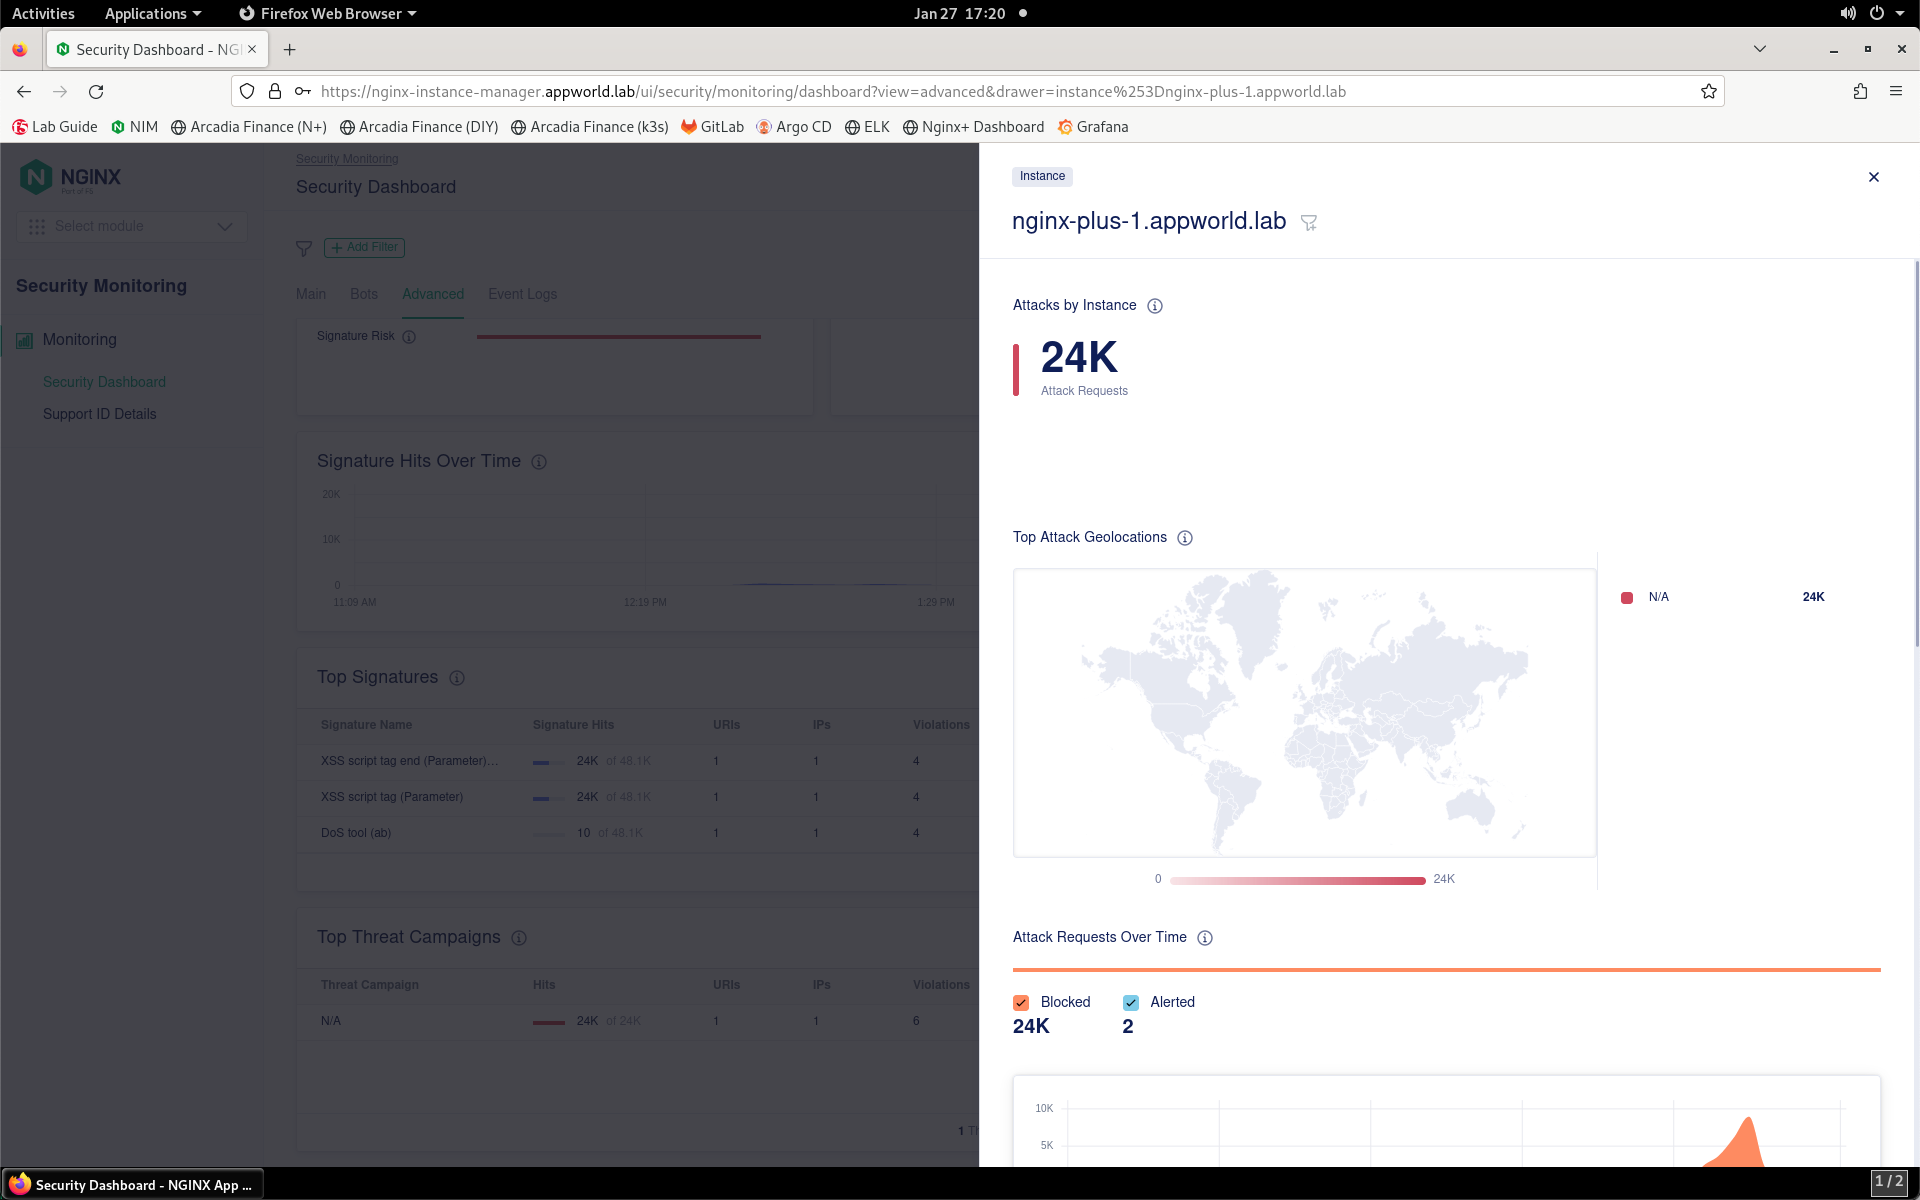
- Scroll down and review the additional metrics available. Click on the single entry under the Top Attacked Instances list to see additional details.
- Close the details box when finished.
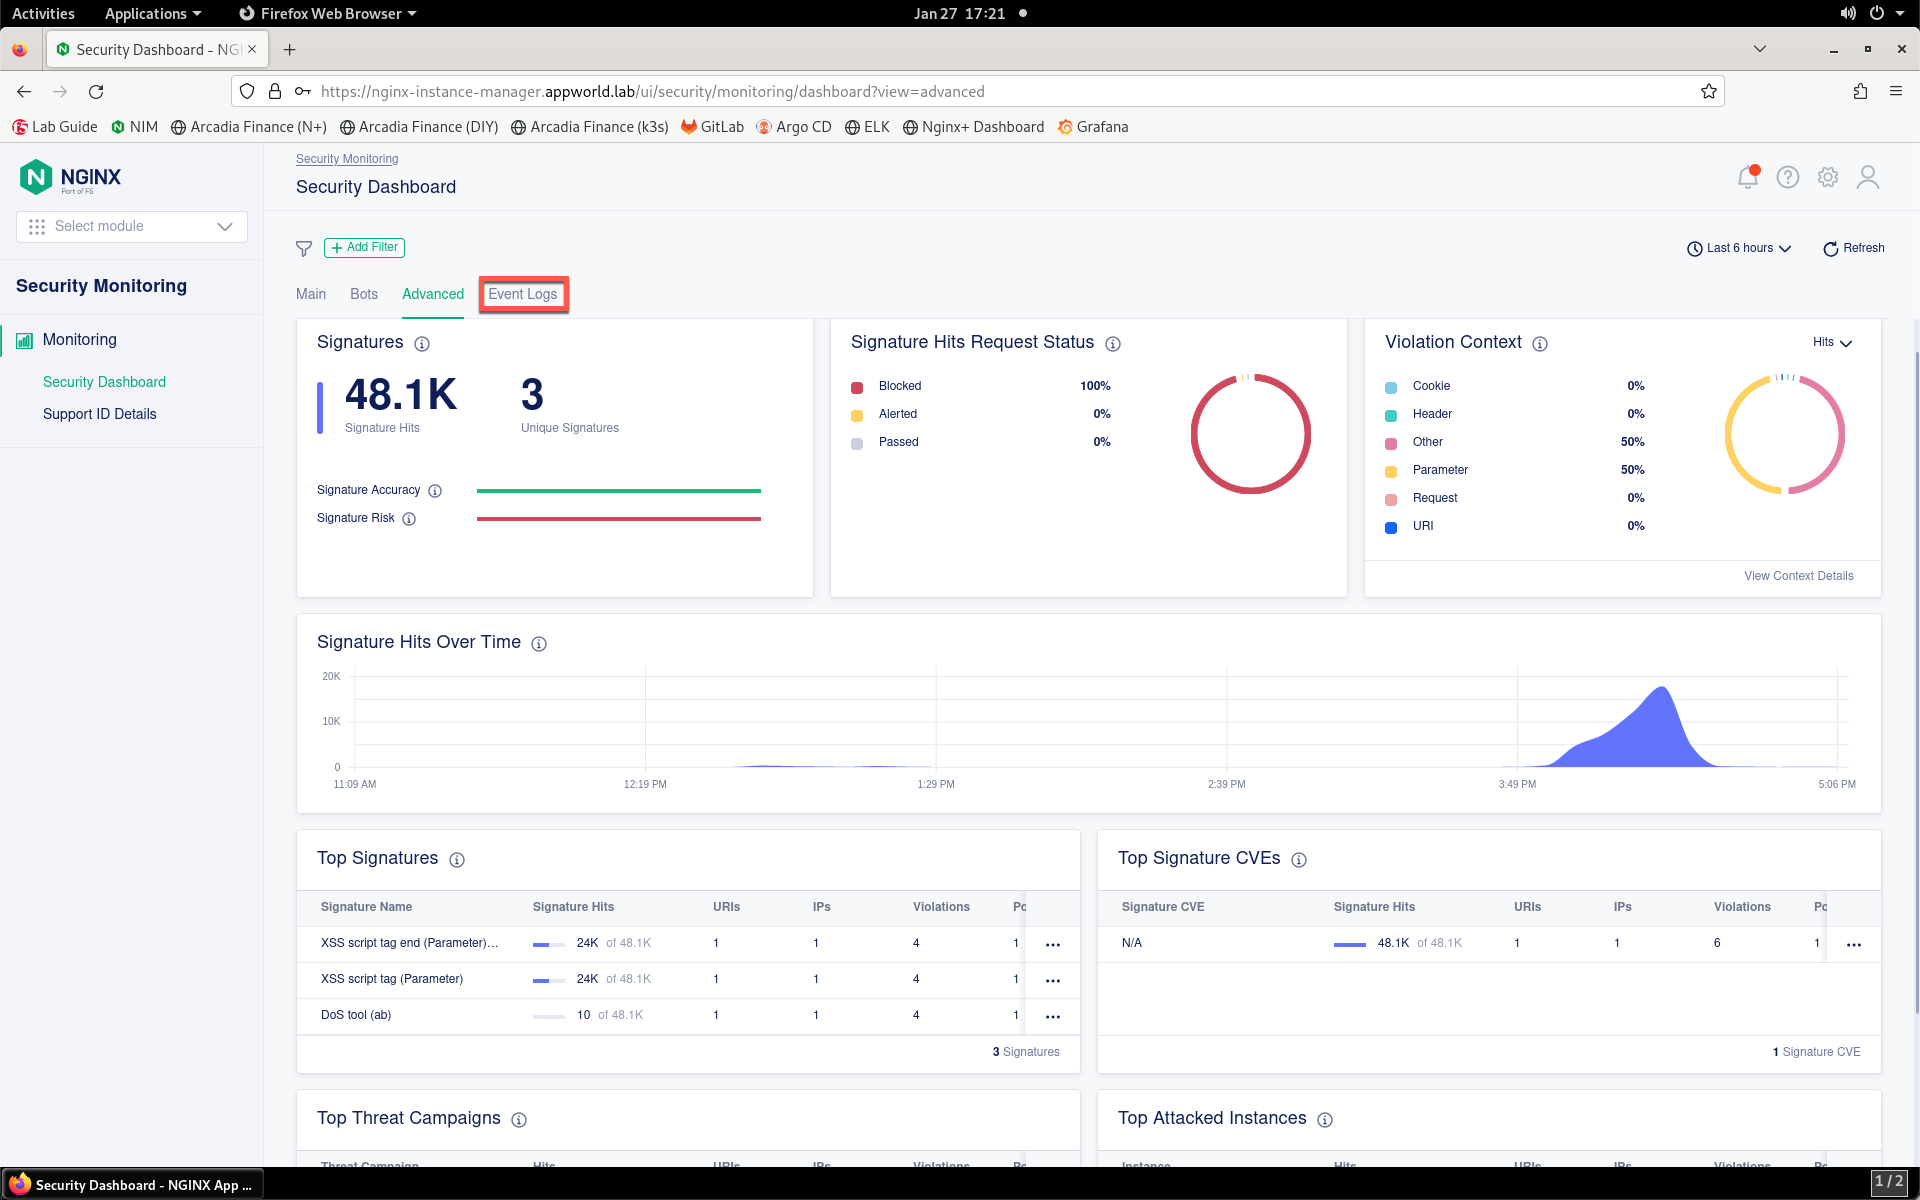
- Finally, click on the Events Log tab to view the historical event list.
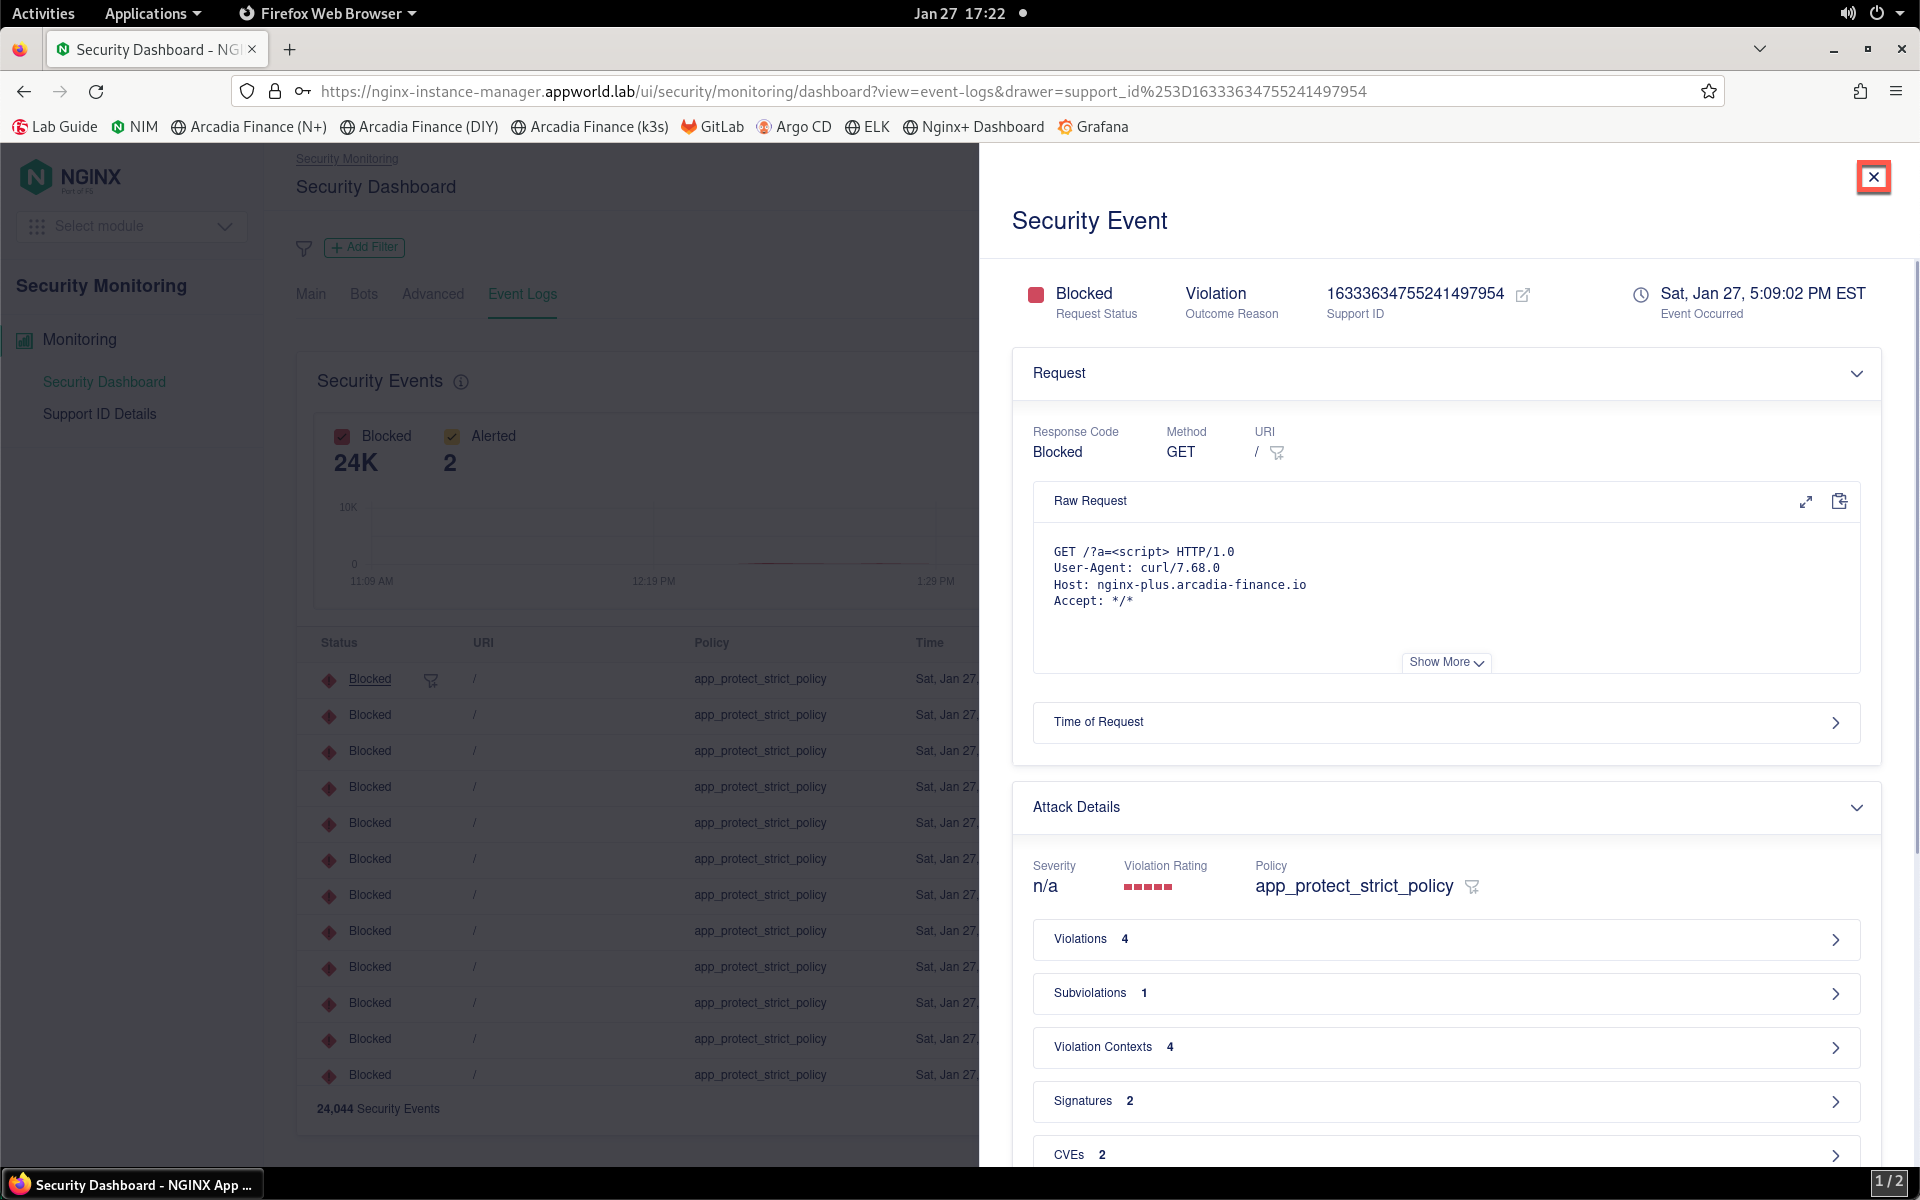
- You can click on any of the events in the list to view more details. Close the details box when finished.
Now that you’ve reviewed where WAF policies exist in NIM, how they are deployed at the application level and how to monitor security statistics and events in NIM, continue to the next section of the lab.