NGINX Modern Apps > Class 1 - Intro to NGINX Plus > Module 2: Introduction to custom NGINX Plus logging Source | Edit on
Custom Access Logs
Introduction
The NGINX logging facility is highly customizable and allows you to add custom variables into your logs for purposes of verbose debugging, troubleshooting or analysis of what unfolds within your applications served by NGINX
See also
Learning Objectives
By the end of the lab you will be able to:
- Configure Access logs using custom log formats
- Configure Server specific Access logs and Error Logs
Exercise 1: Enable virtual server specific Error and Access logs for www.example.com
A best practice is to set up individual log files for each of your virtual servers in order to reduce the size of each log file. This makes troubleshooting easier and log rotation less frequent.
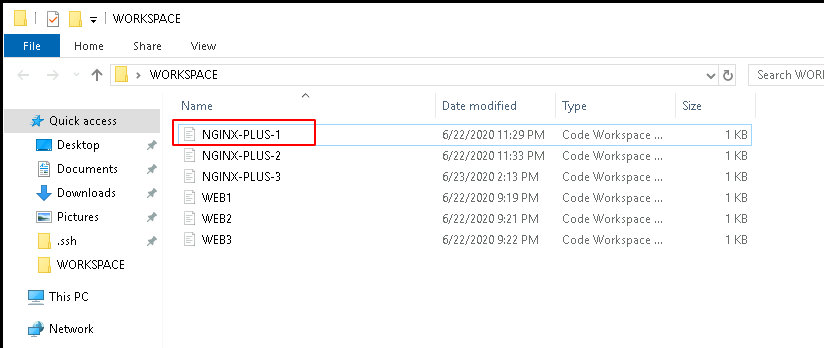
In the WORKSPACE folder found on the desktop, open NGINX-PLUS-1 in Visual Studio Code.
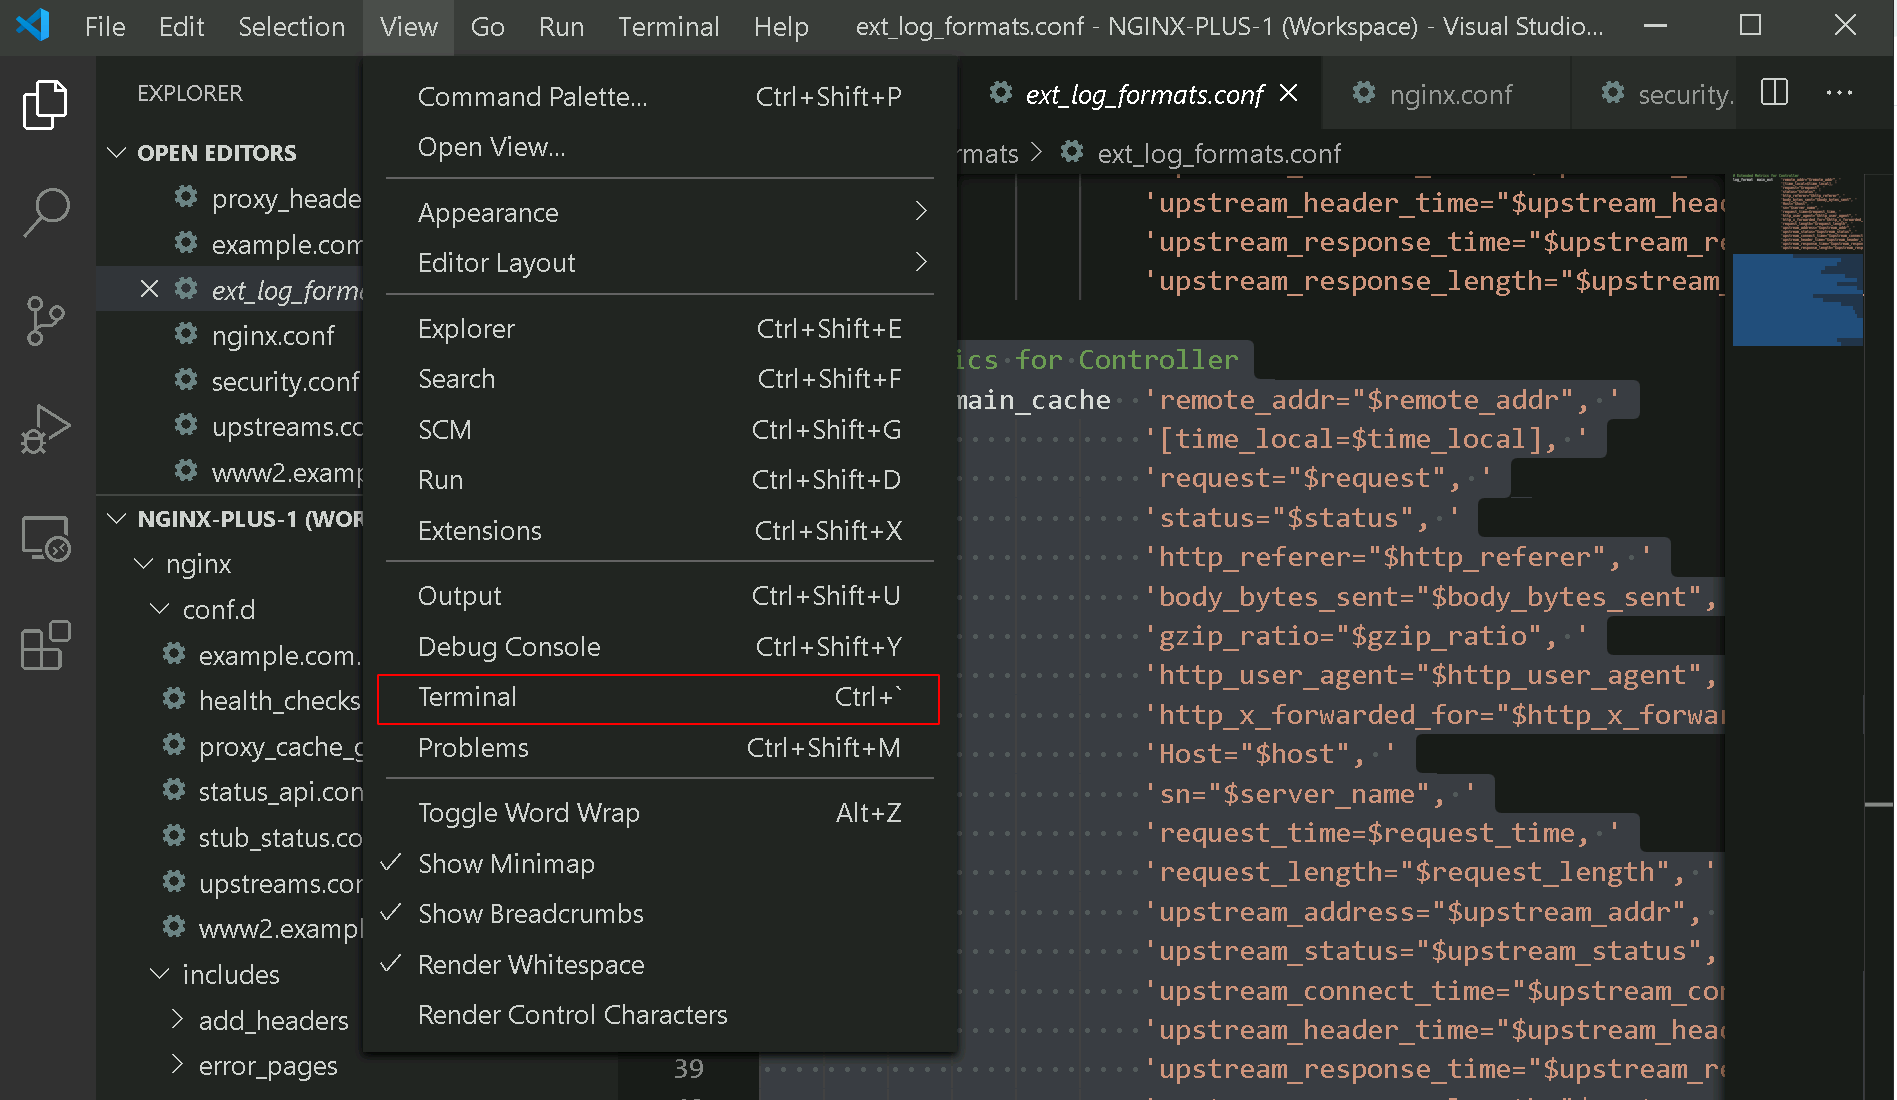
In VSCode, open a terminal window, by selecting View > Terminal menu. You will now be able to both run NGINX commands and edit NGINX Plus configuration files via the VSCode Console and terminal.
Now inspect the /etc/nginx/conf.d/example.com.conf file. Note the specific access_log and error_log definitions in the server block. Access and Error logs are written into their own files:
# Server specific logging
access_log  /var/log/nginx/www.example.com.log  main_cache;
error_log   /var/log/nginx/www.example.com_error.log notice;

Now inspect the custom log format defined as main_cache in /etc/nginx/includes/log_formats/ext_log_formats.conf
# Cache metrics for Controller
log_format  main_cache  'remote_addr="$remote_addr", '
                        '[time_local=$time_local], '
                        'request="$request", '
                        'status="$status", '
                        'http_referer="$http_referer", '
                        'body_bytes_sent="$body_bytes_sent", '
                        'gzip_ratio="$gzip_ratio", '
                        'http_user_agent="$http_user_agent", '
                        'http_x_forwarded_for="$http_x_forwarded_for", '
                        'Host="$host", '
                        'sn="$server_name", '
                        'request_time=$request_time, '
                        'request_length="$request_length", '
                        'upstream_address="$upstream_addr", '
                        'upstream_status="$upstream_status", '
                        'upstream_connect_time="$upstream_connect_time", '
                        'upstream_header_time="$upstream_header_time", '
                        'upstream_response_time="$upstream_response_time", '
                        'upstream_response_length="$upstream_response_length", '
                        'upstream_cache_status="$upstream_cache_status", '
                        'http_range="$http_range", '
                        'slice_range="$slice_range" ';
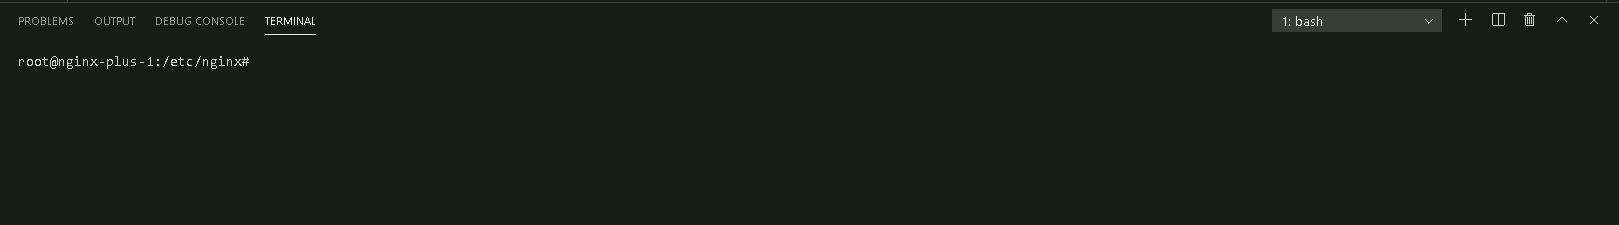
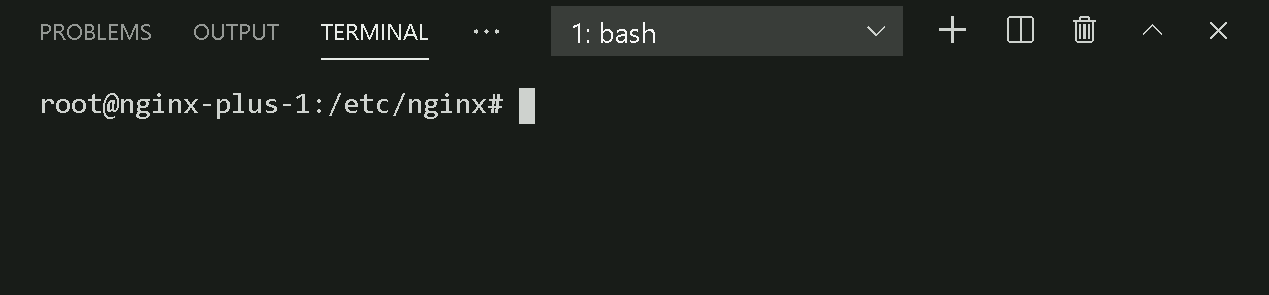
In the VSCode, open a terminal window, by selecting View > Terminal menu.
Note
The terminal window will open at the bottom of the VSCode editor
On the terminal, on the NGINX Plus server, use tail command to output the access logs for www.example.com as they are written:
tail -f /var/log/nginx/www.example.com.log
Run some traffic to http://www.example.com From a web browser, open another Terminal in VSCode by selecting the split terminal icon on the right and run a curl command:
curl http://www.example.com
We now can see our custom access log written to file
tail -f /var/log/nginx/www.example.com.log
Note
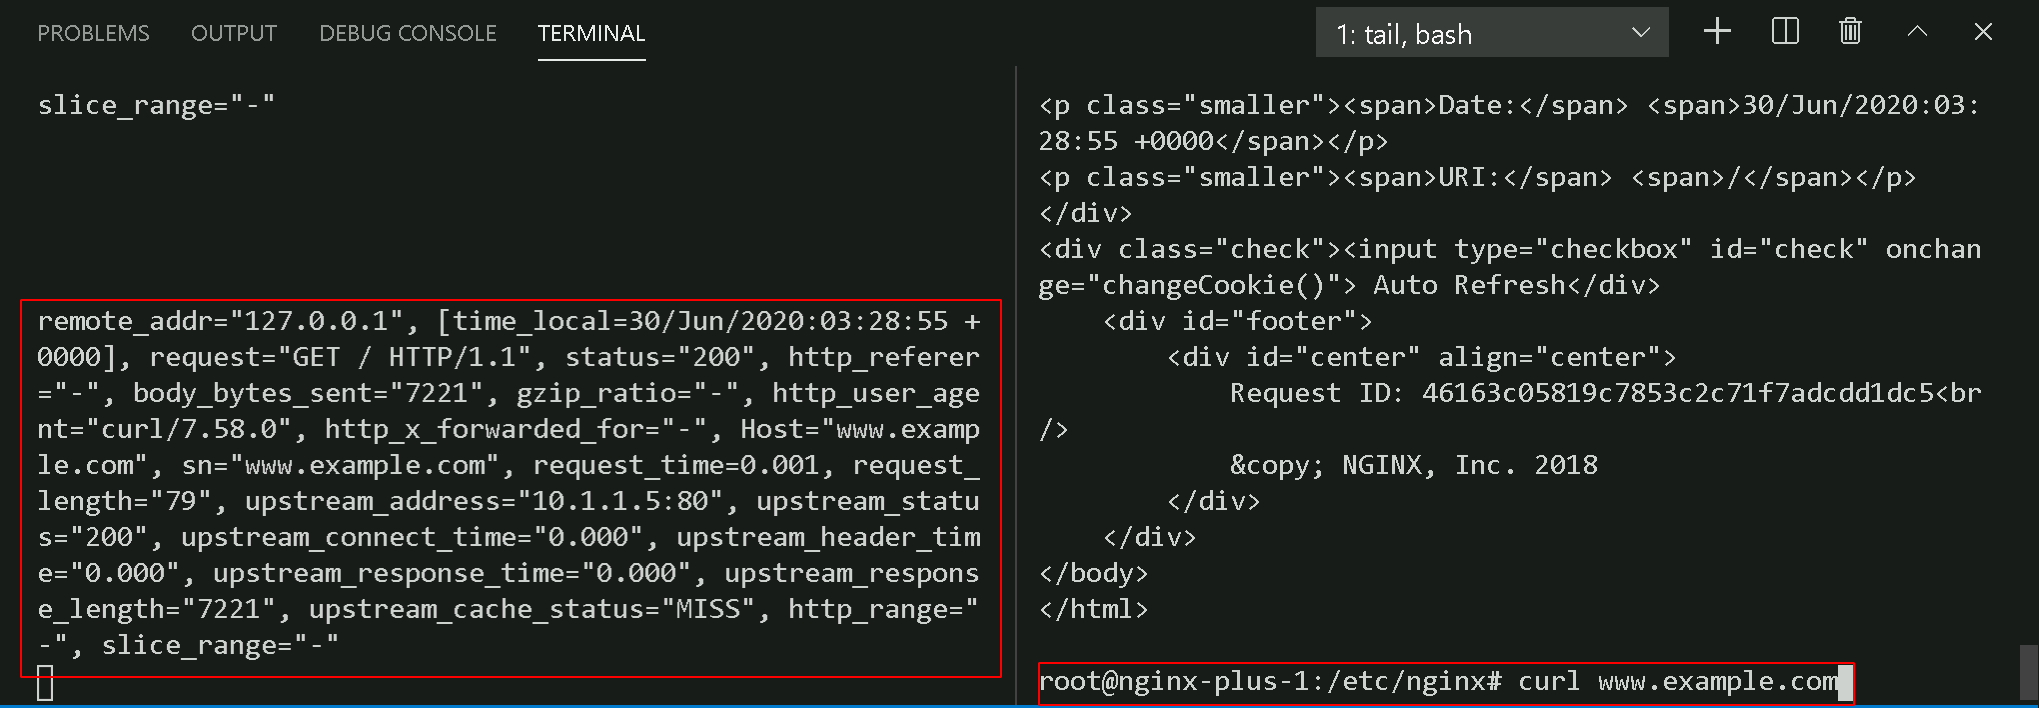
You should see output similar to the following:
remote_addr=”127.0.0.1”, [time_local=30/Jun/2020:03:28:55 +0000], request=”GET / HTTP/1.1”, status=”200”, http_referer=”-“, body_bytes_sent=”7221”, gzip_ratio=”-“, http_user_agent=”curl/7.58.0”, http_x_forwarded_for=”-“, Host=”www.example.com”, sn=”www.example.com”, request_time=0.001, request_length=”79”, upstream_address=”10.1.1.5:80”, upstream_status=”200”, upstream_connect_time=”0.000”, upstream_header_time=”0.000”, upstream_response_time=”0.000”, upstream_response_length=”7221”, upstream_cache_status=”MISS”, http_range=”-“, slice_range=”-“
Exercise 2: Enable JSON format Access logs for www2.example.com
We can also configure NGINX to write logs in JSON format. This may be a requirement or preference for popular log collectors and log servers.
We can use escape=json parameter that sets JSON valid character escaping.
You need to have all non-word characters in JSON escaped with unicode style like
this: \uNNNN.
Inspect the /etc/nginx/conf.d/www2.example.com.conf file. Note the specific access_log and error_log definitions in the server block. Access and Error logs are written into their own files:
# /etc/nginx/conf.d/www2.example.com.conf

# Server specific logging
access_log  /var/log/nginx/www2.example.com.log  json_ext;
error_log   /var/log/nginx/www2.example.com_error.log error;
You can see the custom log format defined as json_ext in /etc/nginx/includes/log_formats/json_log_formats.conf
log_format json_ext escape=json
   '{'
         '"proxy_protocol_addr": "$proxy_protocol_addr",'
         '"remote_user": "$remote_user",'
         '"remote_addr": "$remote_addr",'
         '"time_local": "$time_local",'
         '"request" : "$request",'
         '"status": "$status",'
         '"body_bytes_sent": "$body_bytes_sent",'
         '"http_referer": "$http_referer",'
         '"http_user_agent": "$http_user_agent",'
         '"http_x_forwarded_for": "$http_x_forwarded_for",'
         '"proxy_add_x_forwarded_for": "$proxy_add_x_forwarded_for",'
         '"host": "host",'
         '"server_name": "$server_name",'
         '"request_length" : "$request_length",'
         '"request_time" : "$request_time",'
         '"proxy_host": "$proxy_host",'
         '"upstream_addr": "$upstream_addr",'
         '"upstream_response_length": "$upstream_response_length",'
         '"upstream_response_time": "$upstream_response_time",'
         '"upstream_status": "$upstream_status"'
   '}';
#. In the Terminal window, on the NGINX Plus server, use tail to output the access logs for www2.example.com as they are written:
tail -f /var/log/nginx/www2.example.com.log
Run some traffic to https://www2.example.com From a web browser. You can also open another Terminal in VSCode by selecting the split terminal icon on the right and run a curl command:
curl -sk https://www2.example.com
Note
We are using a self-signed certificate and you may safely ignore the security error for this website
In the Terminal window, We now can see our custom access log written to file
tail -f /var/log/nginx/www2.example.com.log
Note
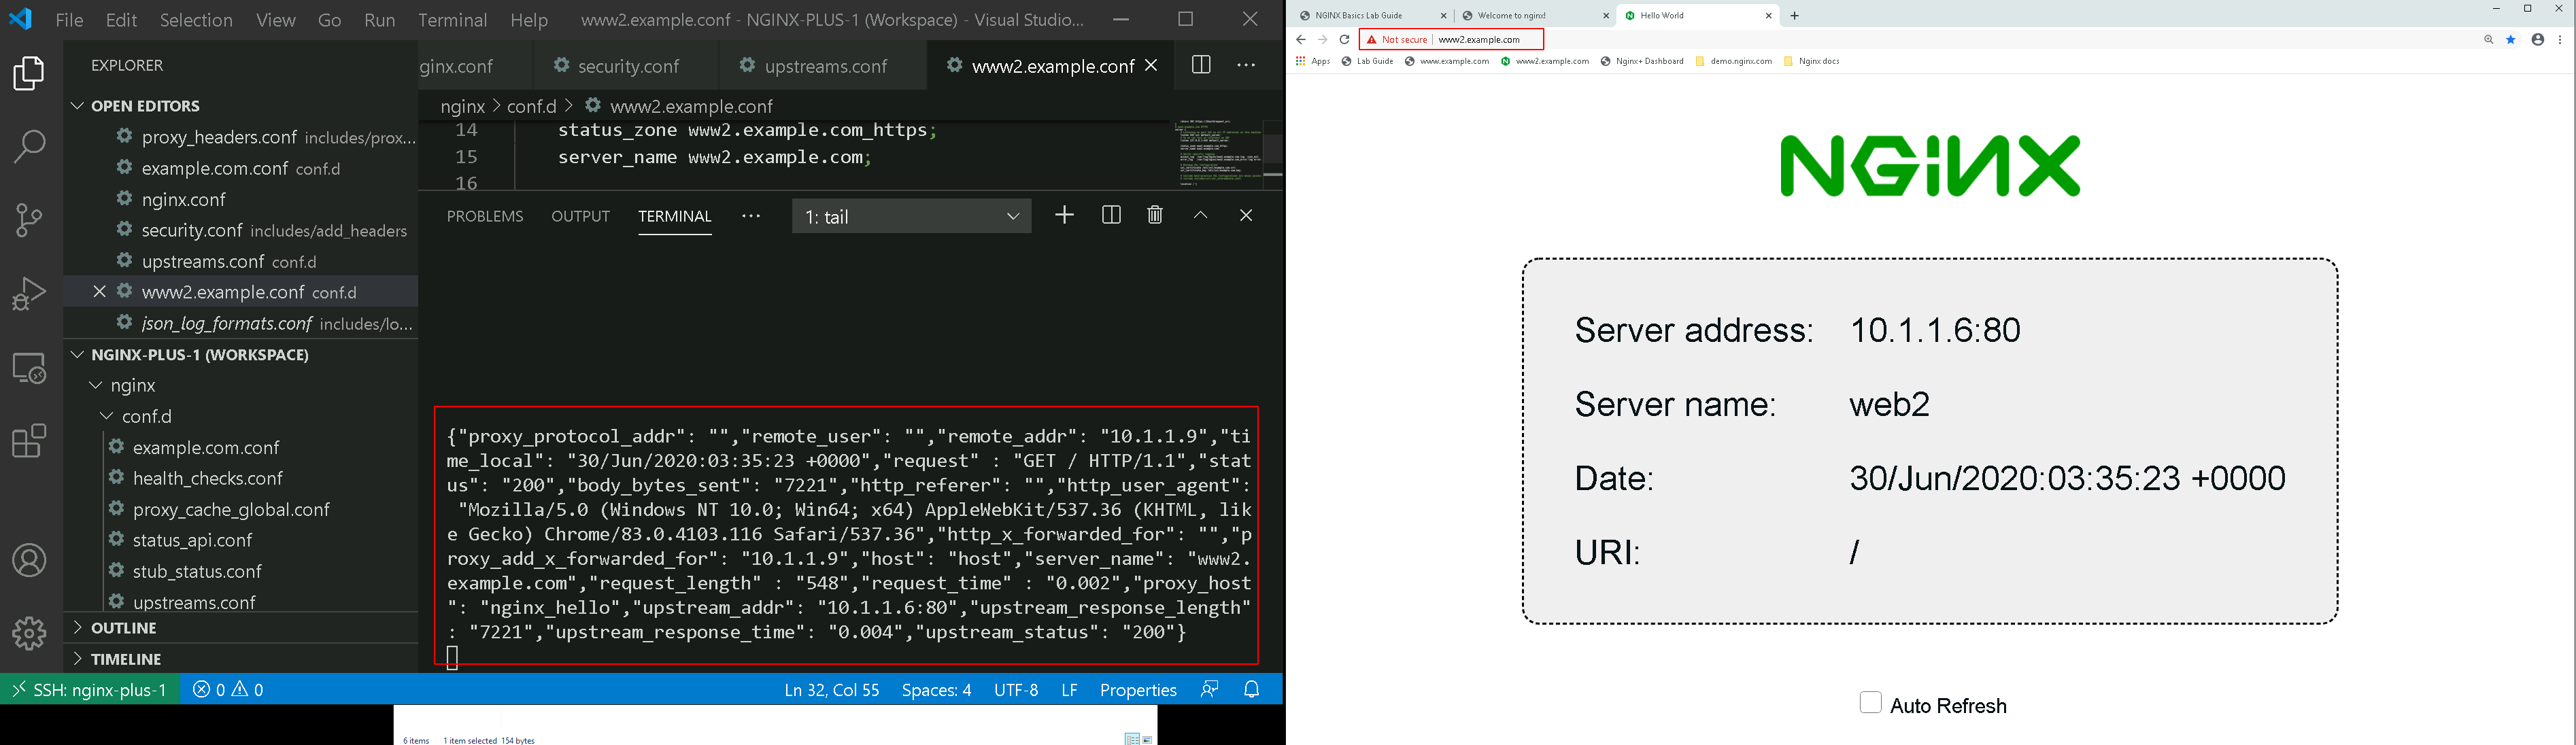
You should see output similar to the following:
{“proxy_protocol_addr”: “”,”remote_user”: “”,”remote_addr”: “10.1.1.9”, “time_local”: “30/Jun/2020:03:38:20 +0000”,”request” : “GET / HTTP/1.1”, “status”: “200”,”body_bytes_sent”: “7221”,”http_referer”: “”, “http_user_agent”: “Mozilla/5.0 (Windows NT 10.0; Win64; x64) AppleWebKit/537.36 (KHTML, like Gecko) Chrome/83.0.4103.116 Safari/537.36” ,”http_x_forwarded_for”: “”,”proxy_add_x_forwarded_for”: “10.1.1.9”, “host”: “host”,”server_name”: “www2.example.com”,”request_length” : “548”, “request_time” : “0.001”,”proxy_host”: “nginx_hello”,”upstream_addr”: “10.1.1.6:80”,”upstream_response_length”: “7221”,”upstream_response_time”: “0.000”,”upstream_status”: “200”}
Alternatively we can tail and pipe the log output into jq for fancy JSON formating. In the Terminal window, Exit the current tail command with a Ctrl+C and run another tail command:
tail -f /var/log/nginx/www2.example.com.log | jq '.'
Note
You should see output similar to the following:
{
   "proxy_protocol_addr": "",
   "remote_user": "",
   "remote_addr": "10.1.1.9",
   "time_local": "30/Jun/2020:03:42:02 +0000",
   "request": "GET / HTTP/1.1",
   "status": "200",
   "body_bytes_sent": "7221",
   "http_referer": "",
   "http_user_agent": "Mozilla/5.0 (Windows NT 10.0; Win64; x64)
   AppleWebKit/537.36 (KHTML, like Gecko) Chrome/83.0.4103.116 Safari/537.36",
   "http_x_forwarded_for": "",
   "proxy_add_x_forwarded_for": "10.1.1.9",
   "host": "host",
   "server_name": "www2.example.com",
   "request_length": "548",
   "request_time": "0.001",
   "proxy_host": "nginx_hello",
   "upstream_addr": "10.1.1.5:80",
   "upstream_response_length": "7221",
   "upstream_response_time": "0.000",
   "upstream_status": "200"
}