NGINX Modern Apps > Class 13 - Maximize ROI with F5 NGINX App Protect(NAP) using Observability > Introduction Source | Edit on
NGINX App Protect WAF Dashboard
Let’s go over the dashboard for NGINX App Protect WAF.
The overall solution uses Logstash to receive logs from NGINX App Protect, process them and finally store them in Elasticsearch indexes. Grafana retrieves the logs from the Elastic indexes and helps us visualize them.
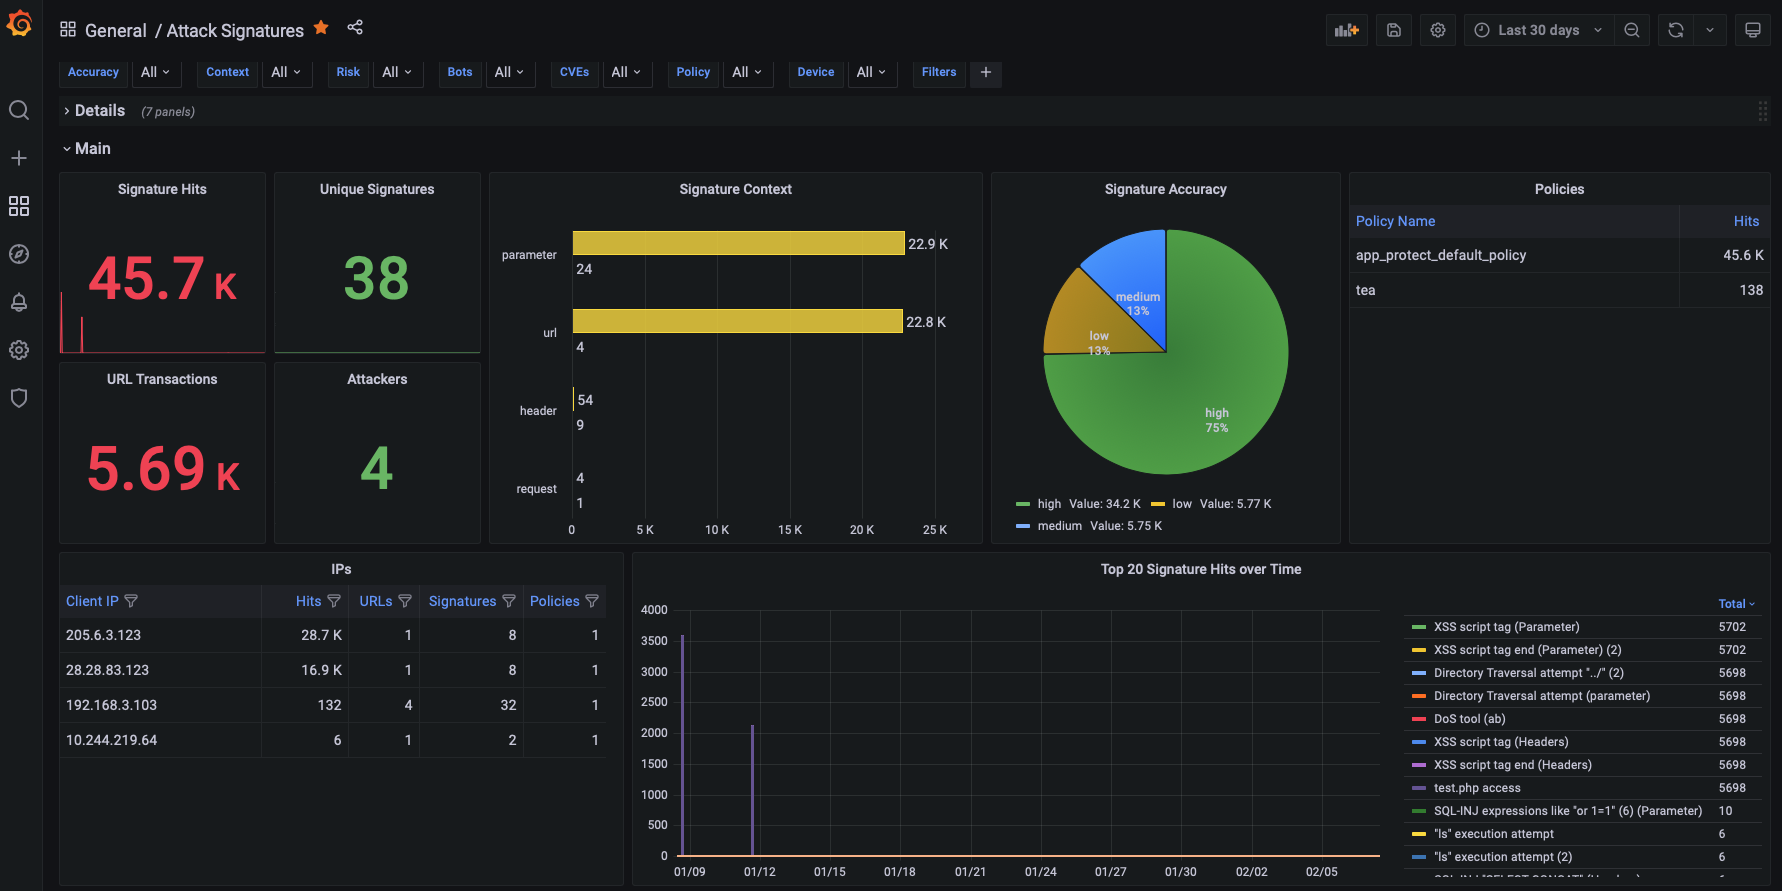
Table of Contents
- [Available Dashboards](#available-dashboards)
- [Generating Attacks](#generating-attacks)
Available Dashboards
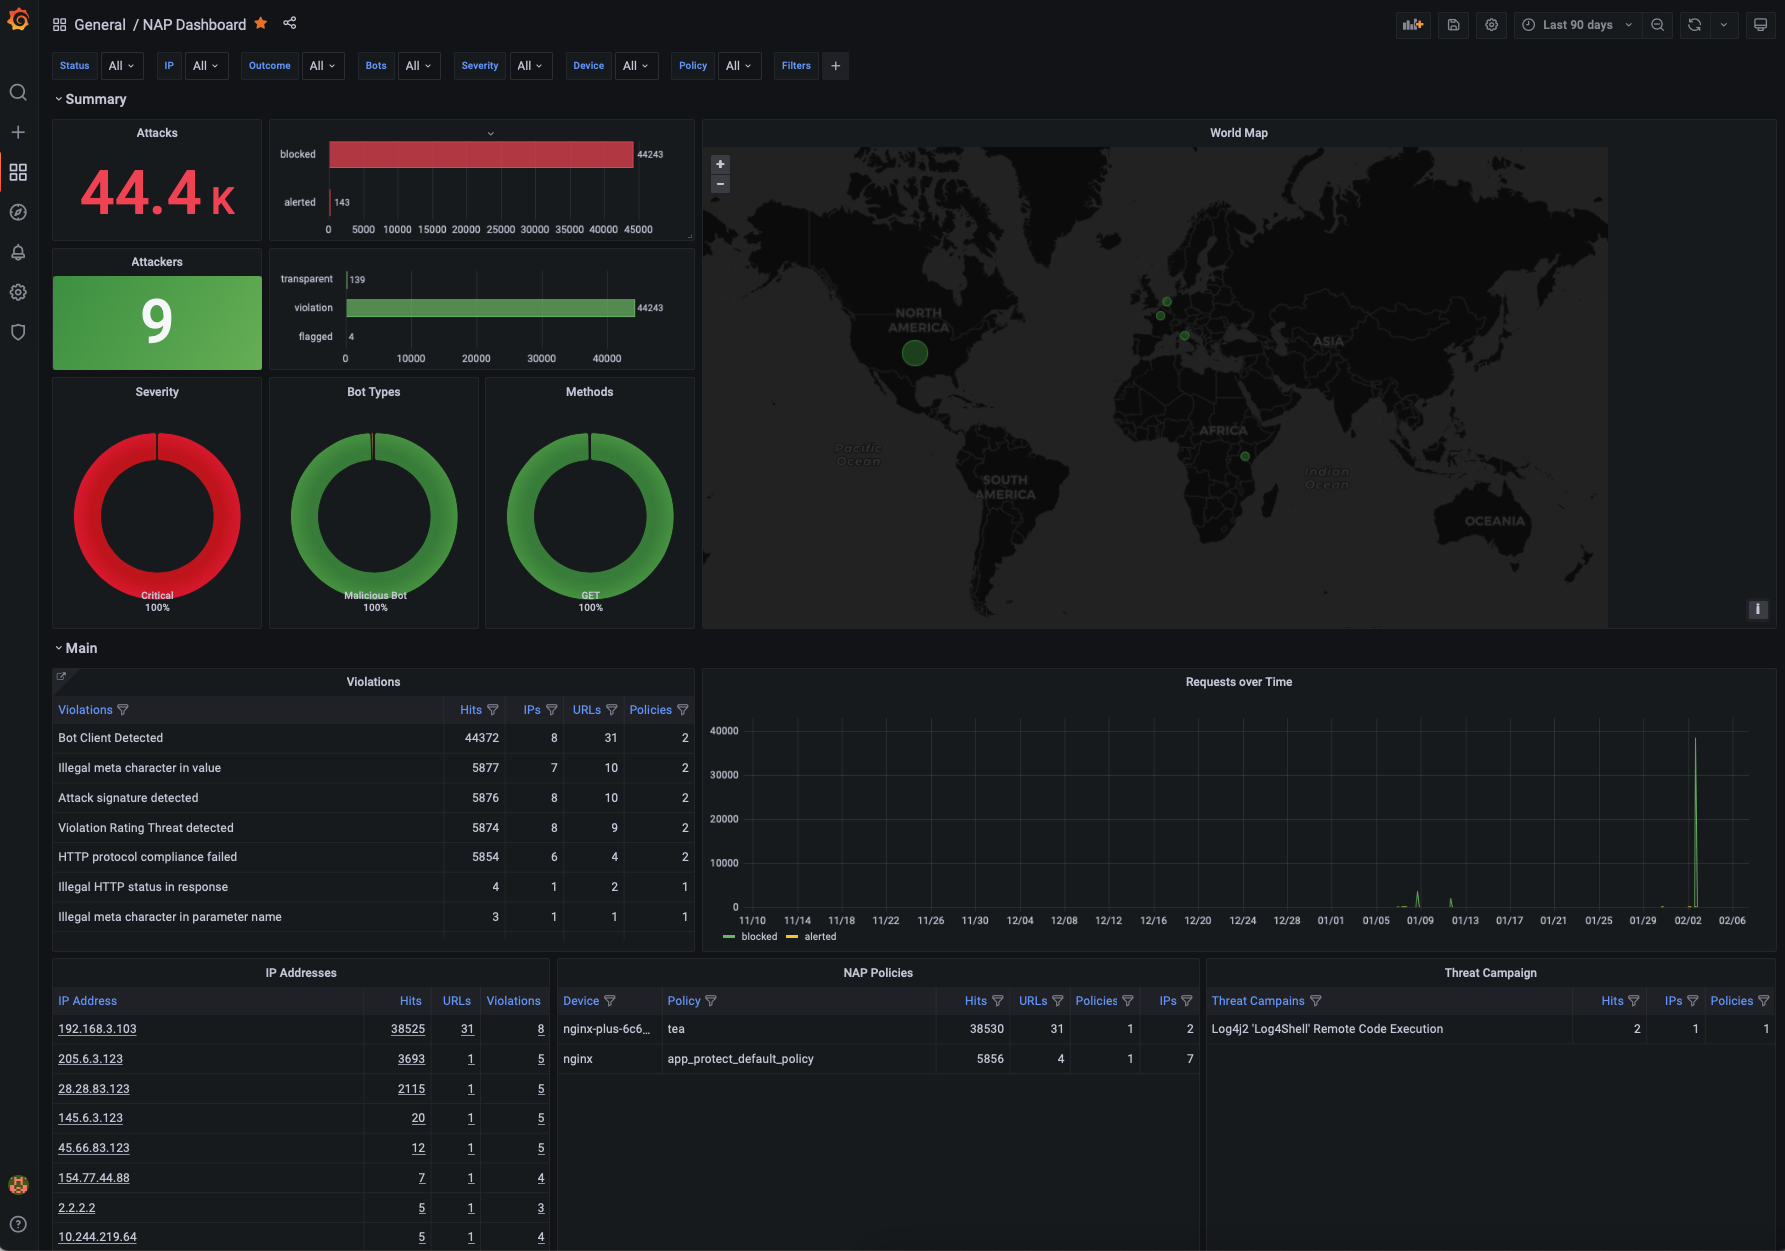
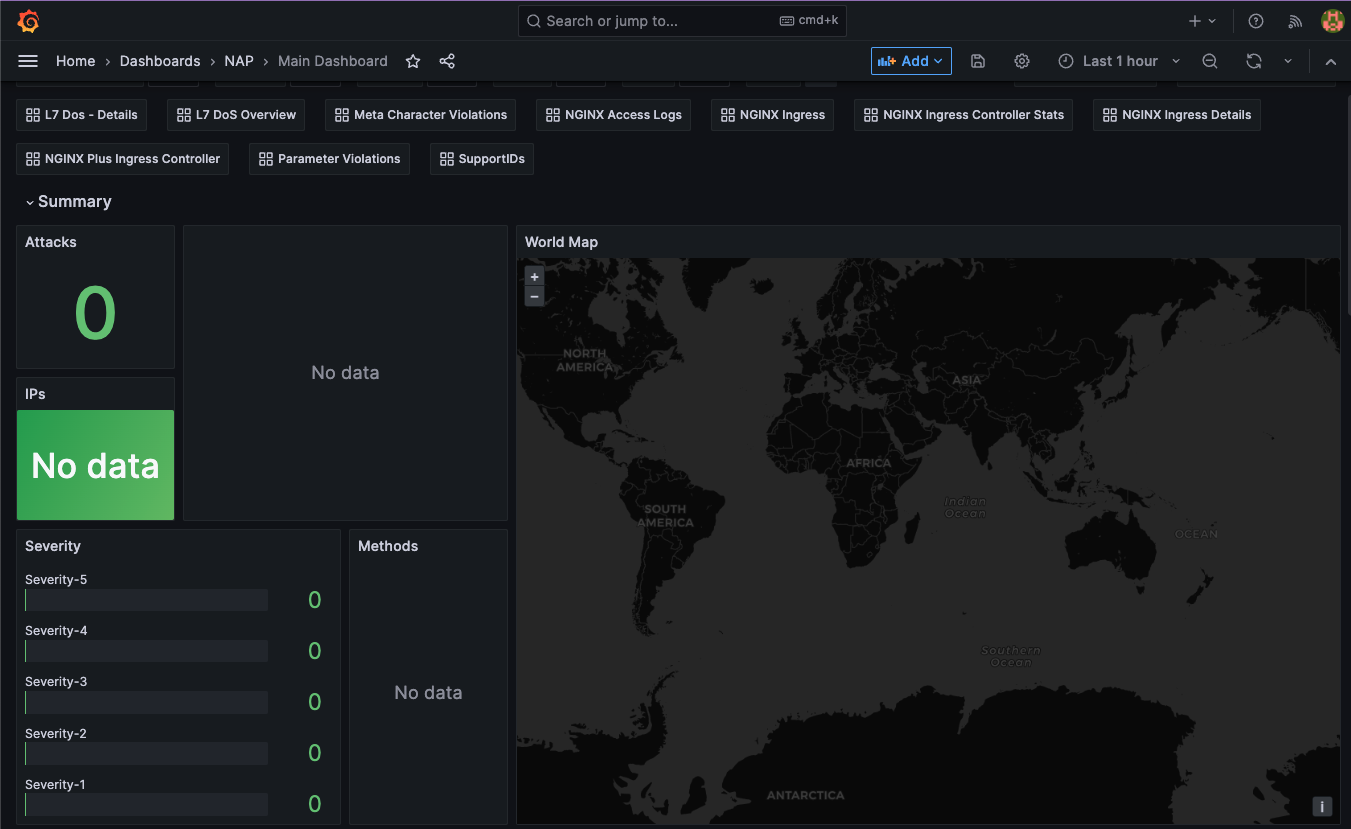
Main Dashboard
The main dashboard that provides an overview of all the violations that have been logged by NGINX App Protect WAF. From this table you can navigate to the other dashboards like SupportID, by clicking on the links. Some of the graphs/tables included in this dashboard are:
- Attacks recorded and mitigated
- Violation categories
- Attacks over time
- Mitigated Bots
- GeoMap
- Attacks per URL
- Attack Signature detected
- Bot activity per IP/Country
- Bot activity per Policy/Device
- CVEs and Threat Campaigns
- Logs
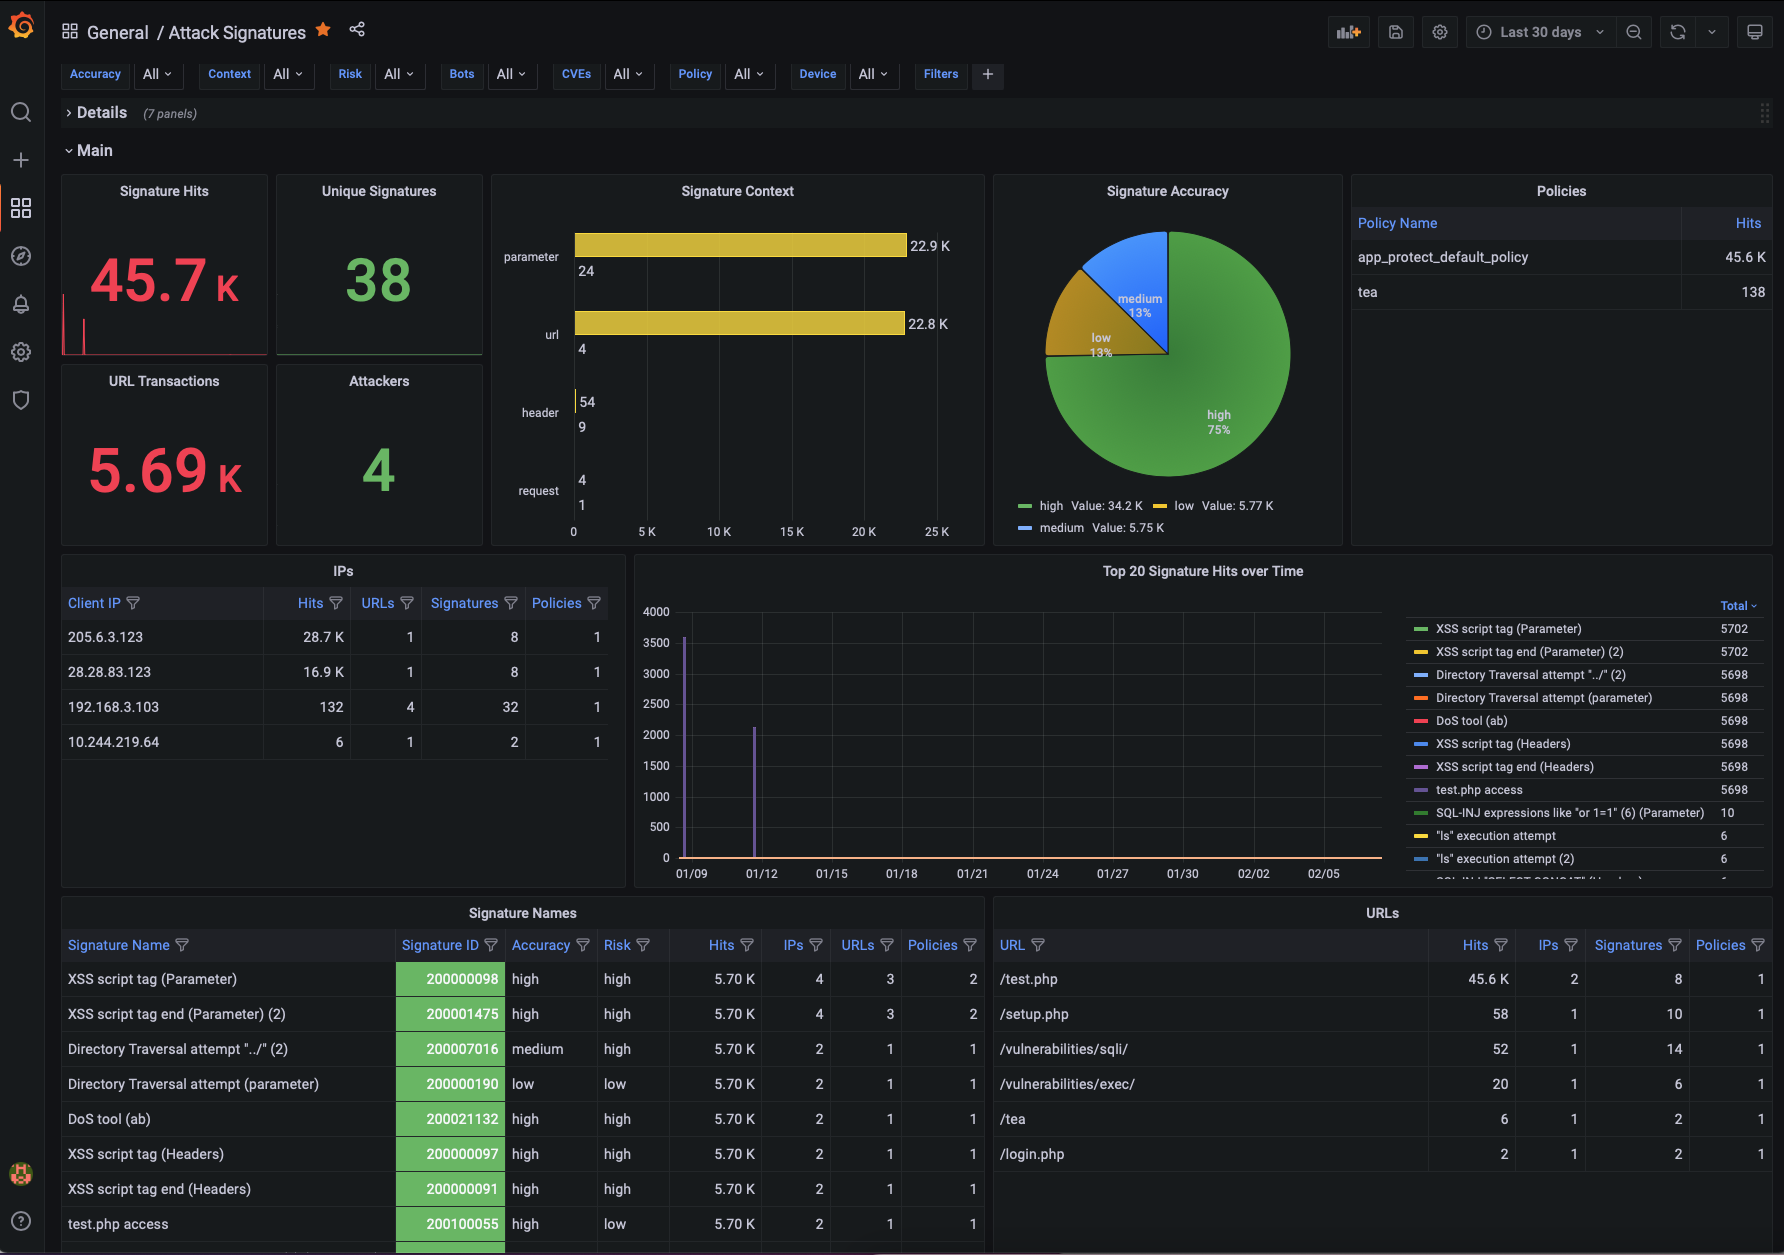
Attack Signature Dashboard
The Attack Signature dashboard provides all details for the signatures that were triggered by NGINX App Protect WAF. Some of the graphs/tables included in this dashboard are:
- Signature Hits
- Signature Accuracy and Risk
- Signatures per Context
- Signature details
- Signatures per URL/IP/Policy
- Parameter Names and Values
- Header Names and Values
- Cookies Names and Values
- Logs
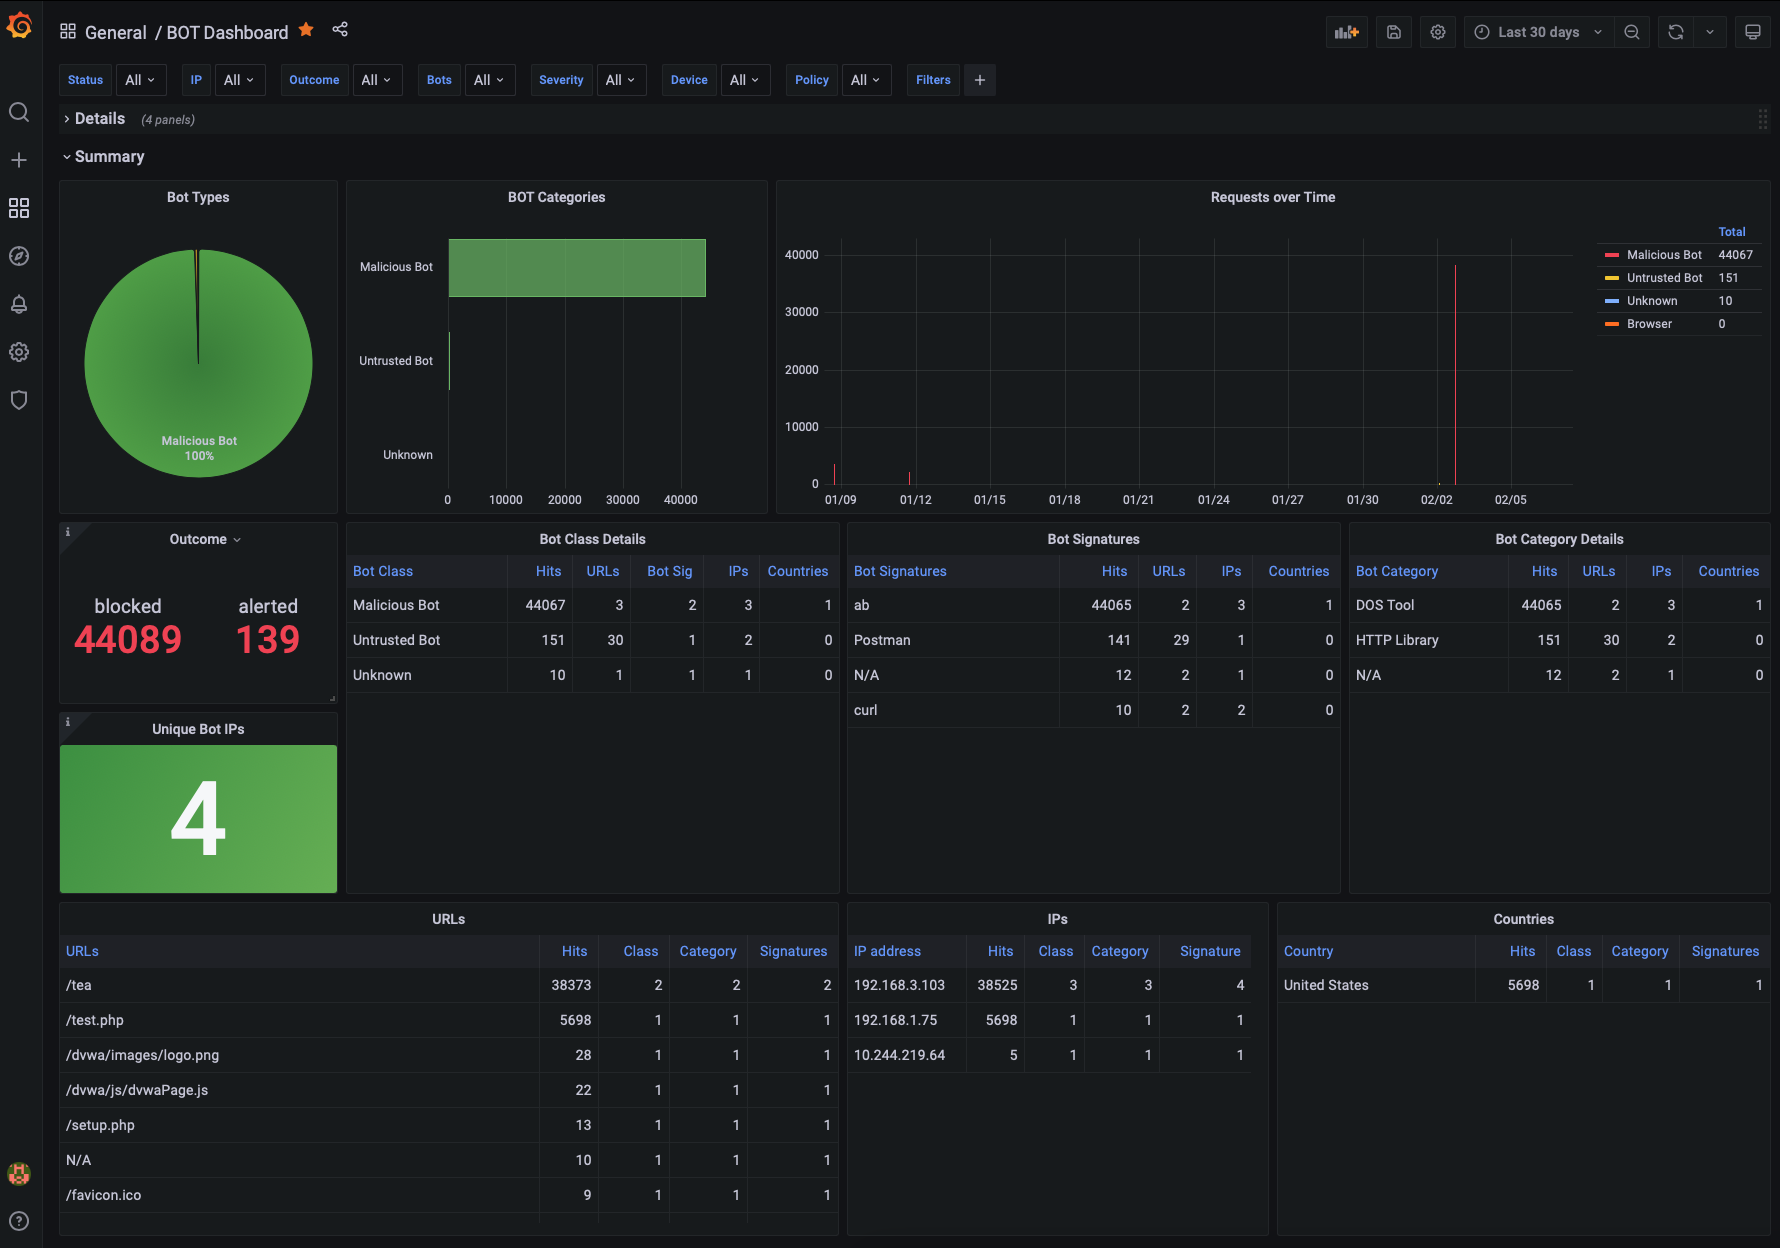
Bot Dashboard
The Bot Dashboard provides all details for the Bot activity that was logged by NGINX App Protect WAF. Some of the graphs/tables included in this dashboard are:
- Bot Types
- Bot Categories
- Bot Activity over time
- Mitigated Bots
- Bot activity per URL
- Bot activity per IP/Country
- Bot activity per Policy/Device
- Logs
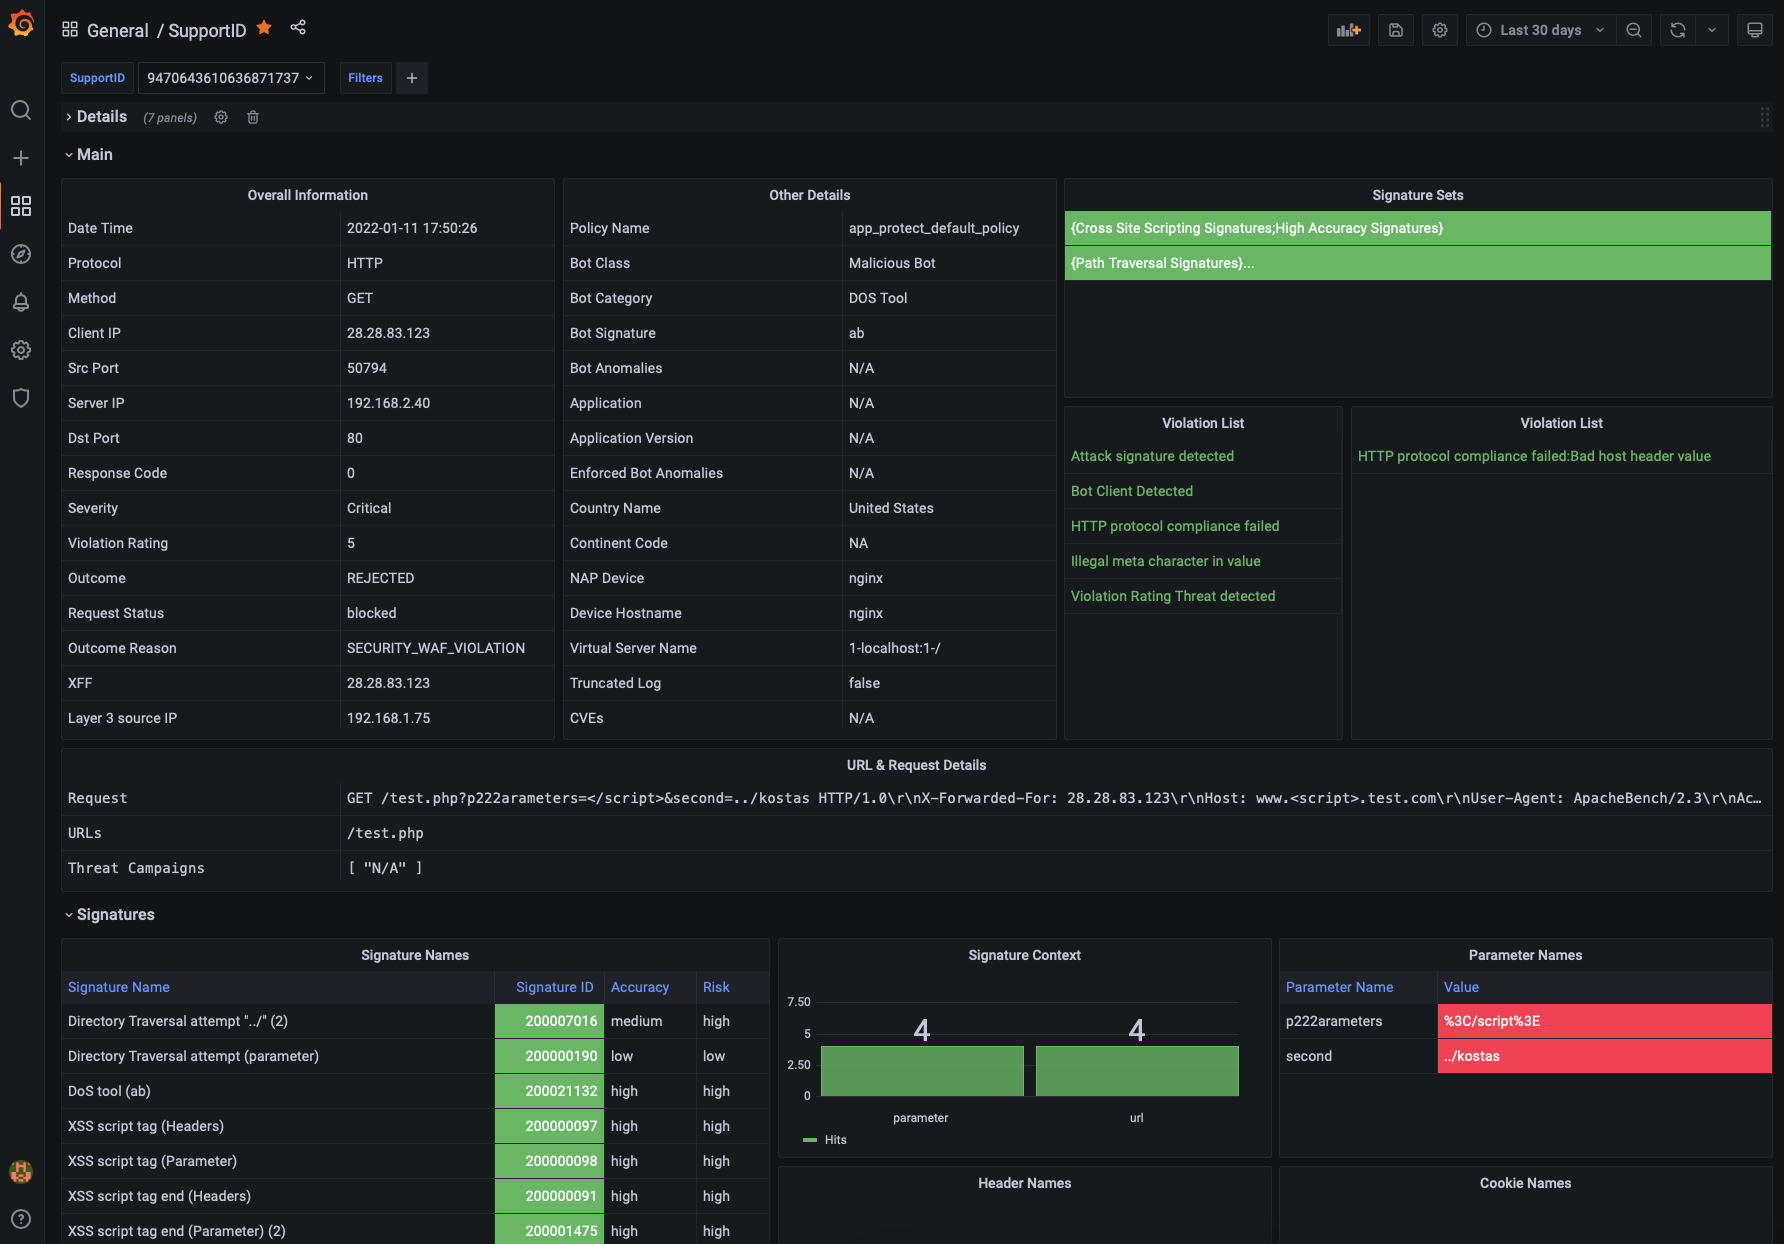
SupportID Dashboard
The SupportID Dashboard provides all details for a specific transaction that was logged by NGINX App Protect WAF. These include the following:
- Client/Server Information (Client IP/Port, Server IP/Port, X-Forwared-For, etc)
- Violation Details (Outcome, Request Status, Outcome Reson, etc)
- Bot Details (Bot Classm Bot Category, Bit Signature, etc)
- Device Details (NAP Device name, Vritual Server Name)
- Signatures Triggered
- Treat Campaign triggered
- Violation list
- Many more
It also includes both the original and decoded Elasticsearch indices for better troubleshooting.
Dashboards under development
The following dashboard are currently under development and should be released shortly:
- File Type Violations
- Header/Cookie Violations
- Parameter Violations
- Evasion Techniques
- HTTP Protocol Compliance
- URL Violations
Generating attacks
In the following section we will generate multiple attacks so that the dashboards get populated with meaningful data that we can review.
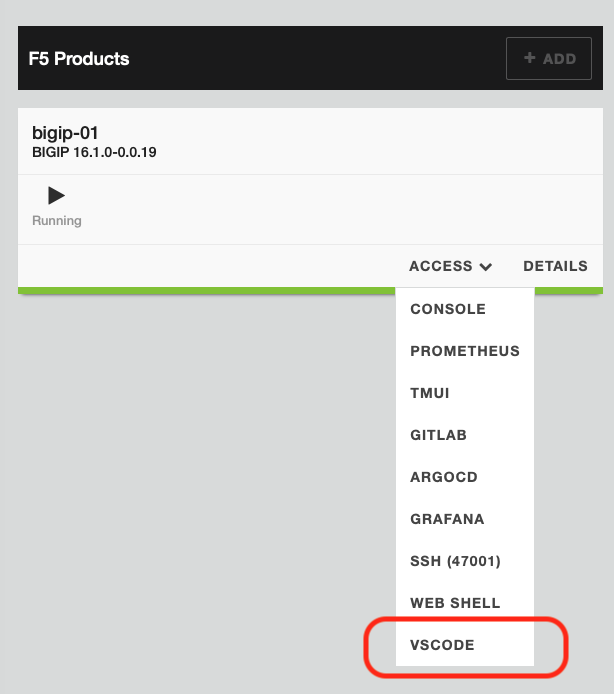
To run the demos, use the terminal on VS Code. VS Code is under the bigip-01 on the Access drop-down menu.

- Change the working directory to monitoring.
cd ~/oltra/use-cases/app-protect/monitoring

Deploy and protect a web application
Create the application deployment and service in namespace nap:
kubectl create namespace nap
kubectl apply -f app.yml
Create the App Protect policy.
kubectl apply -f appolicy.yml
Create log configuration resource:
kubectl apply -f log.yml
Create the policy to reference the AP Policy, the AP Log profile and the log destination.
kubectl apply -f policy.yml
Create the VirtualServer resource:
kubectl apply -f virtual-server.yml
Send a request to the application.
curl http://nap-ingress2.f5k8s.net
#####################  Expected output  #######################
Server address: 10.244.140.109:8080
Server name: nap-monitor-7586895968-r26zn
Date: 12/Sep/2022:14:12:25 +0000
URI: /
Request ID: 0495d6a17797ea9776120d5f4af10c1a
Step 2. Execute malicious requests to the application
Now, let’s try to send a malicious request to the application:
- SQL Injection (encoded)
curl "http://nap-ingress2.f5k8s.netindex.php?password=0%22%20or%201%3D1%20%22%0A"
- SQL Injection
curl "http://nap-ingress2.f5k8s.net/index.php?password==0'%20or%201=1'"
SQL Injection
curl "http://nap-ingress2.f5k8s.net/index.php?id=%'%20or%200=0%20union%20select%20null,%20version()%23"
Cross Site Scripting
curl "http://nap-ingress2.f5k8s.net/index.php?username=<script>"
Command Injection
The expected output for all the previous requests is the following:
` <html><head><title>Request Rejected</title></head><body>The requested URL was rejected........ `
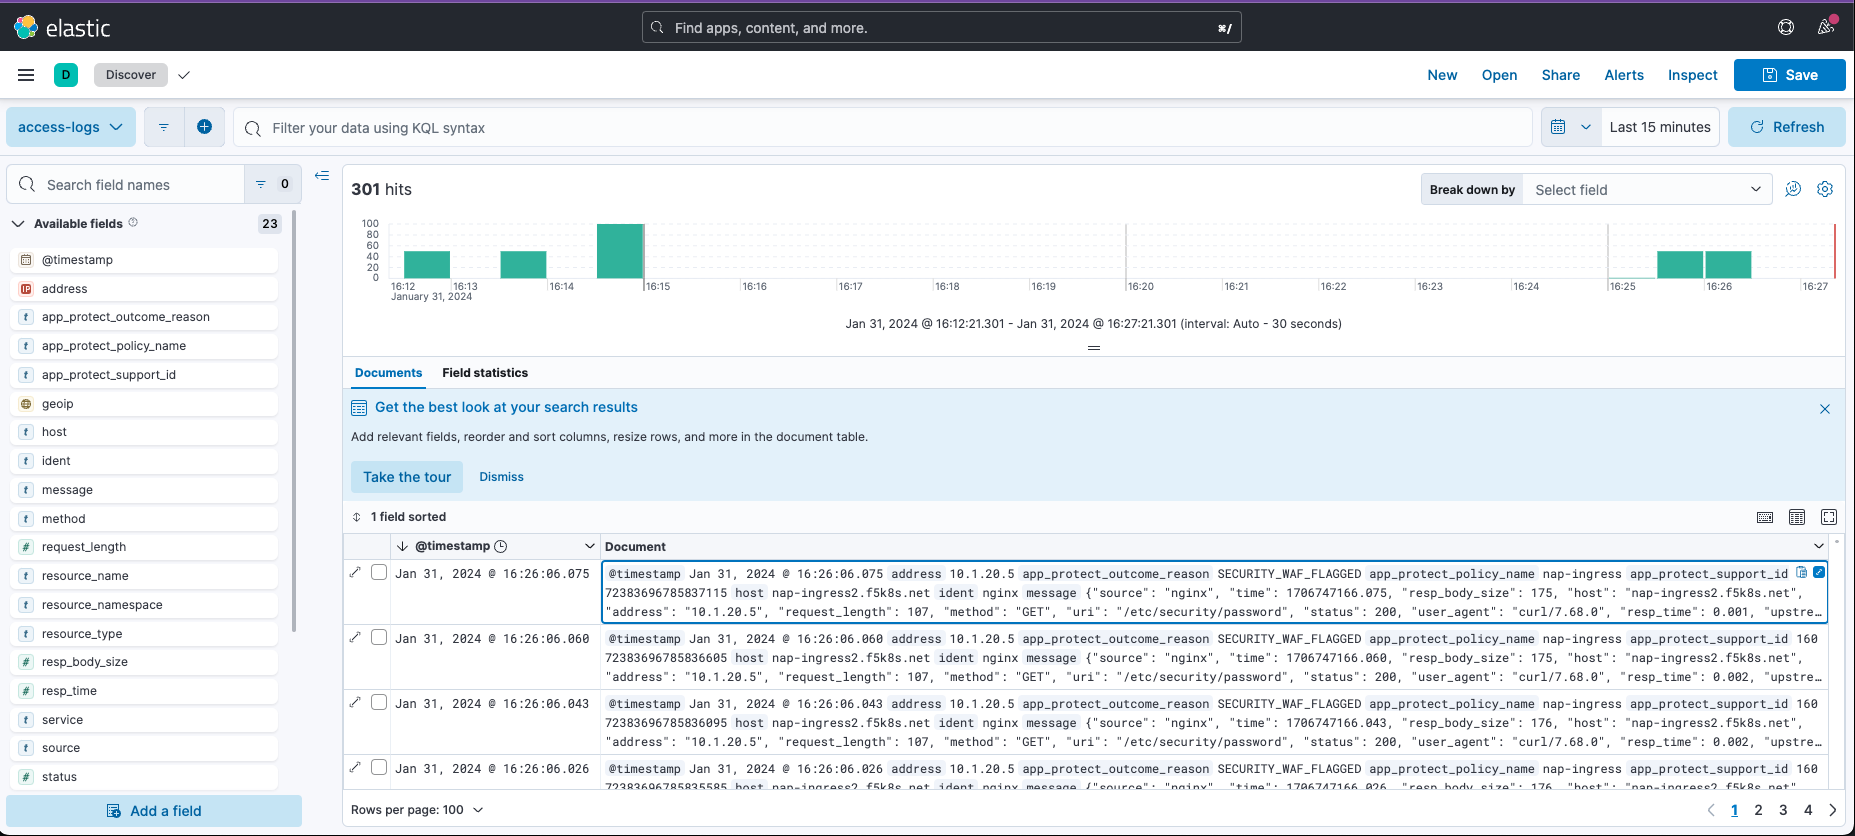
Step 3. Review Logs
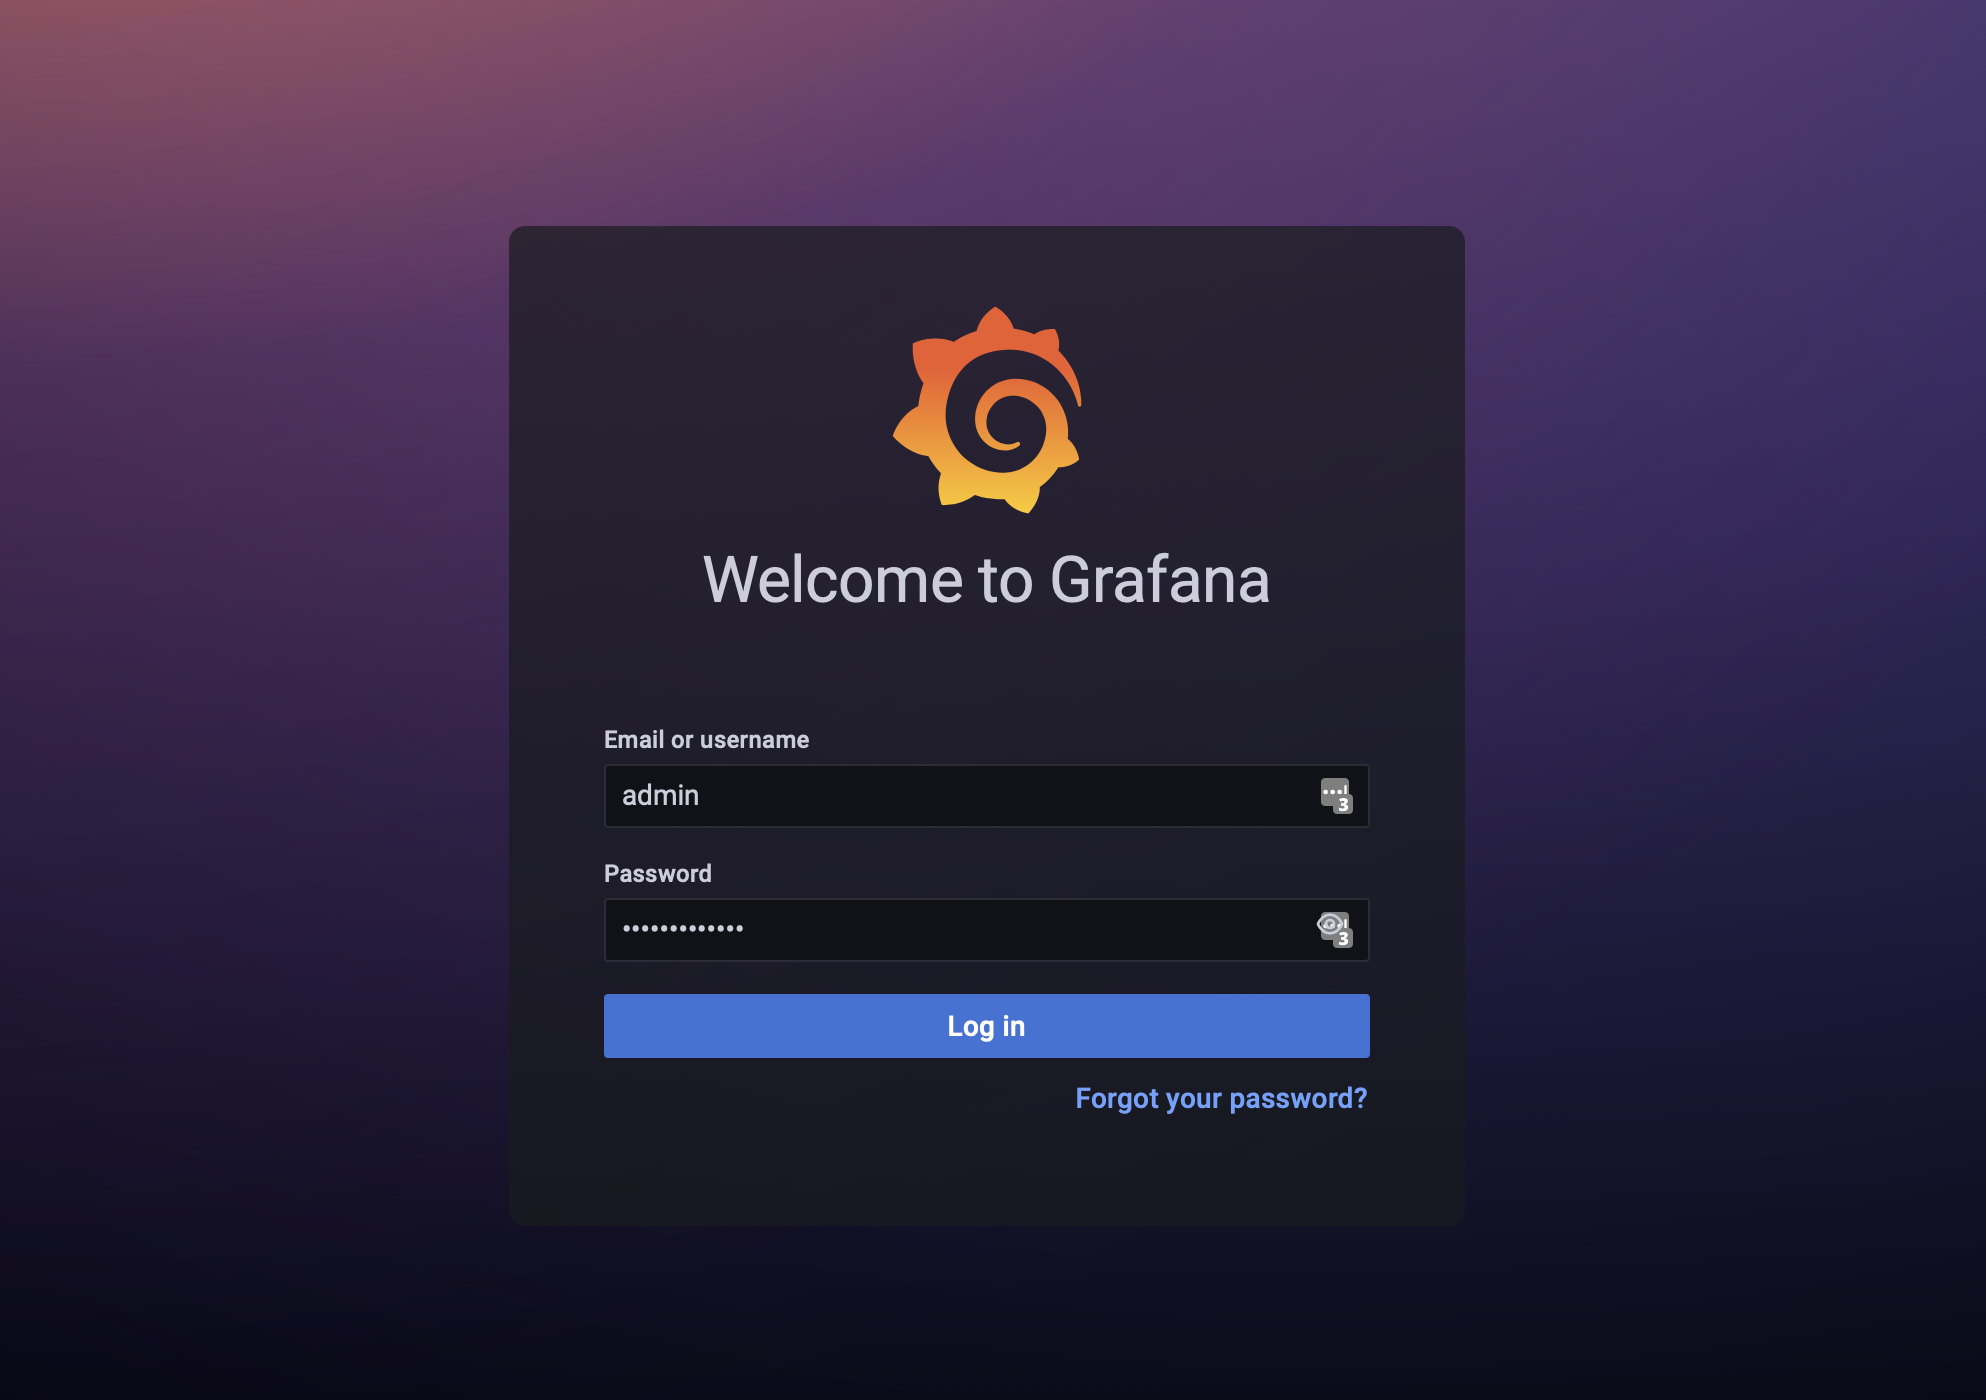
Login to Grafana (credentials admin/Ingresslab123)
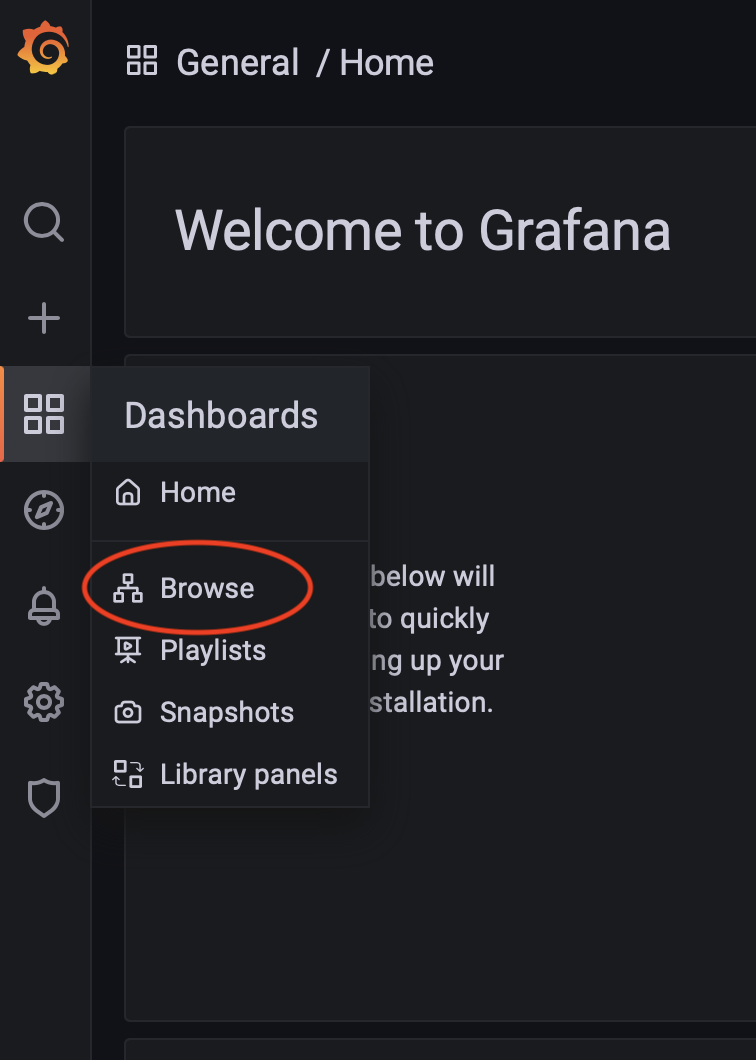
Go to Dashboards->Browse
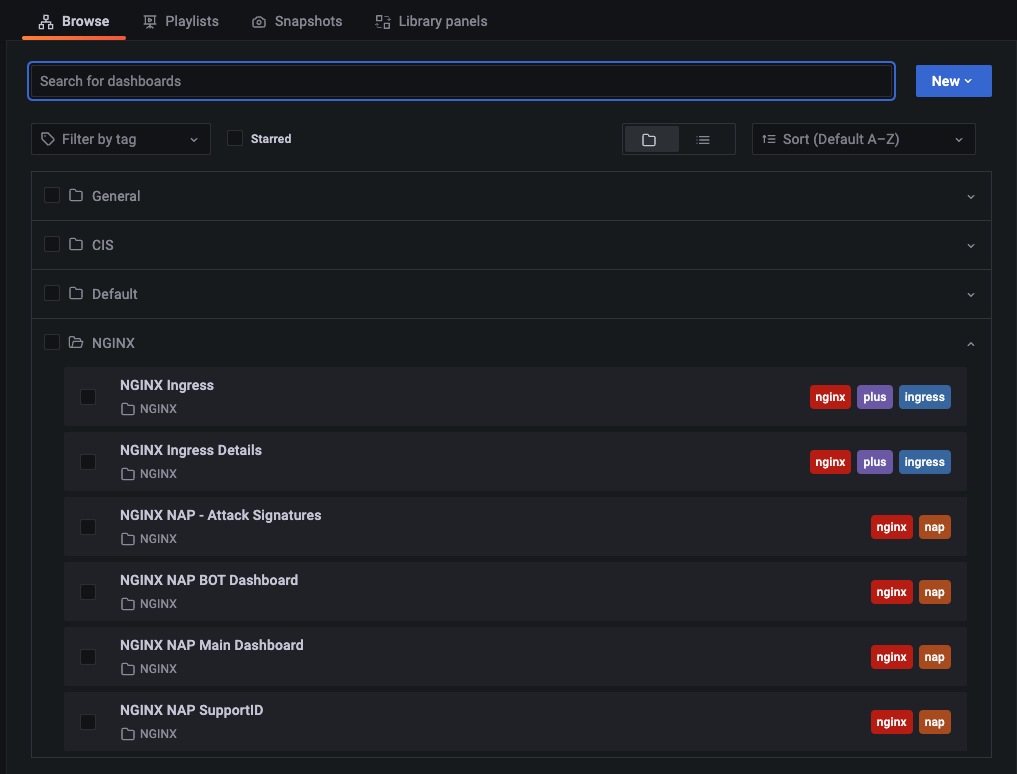
Select the NAP Dashboards that can be located under the NGINX folder
Navigate through the different Dashboards to review the attacks.
Zero to Hero! Maximizing ROI via Ratings Based Templates
Ratings based template policies combine multiple threats to help reduce the operational cost of tuning a WAF policy in order to protect your applications.
In the following section we will generate multiple attacks to understand how the default ratings based templates provide a higher level of efficacy while reducing false positives. This allows you to implement blocking mode early in the application deployment lifecycle and trust that you won’t be buried in sifting through logs.
To run the demos, use the terminal on VS Code. VS Code is under the bigip-01 on the Access drop-down menu. Click <a href=”https://raw.githubusercontent.com/F5EMEA/oltra/main/vscode.png”> here </a> to see how.*
Go to Dashboards->NAP->Main Dashboard
Note the current count in the Severity Box and the number of attacks:
- Return to the working directory to monitoring in Visual Studio Code.
cd ~/oltra/use-cases/app-protect/monitoring
In the terminal window execute the following command and observe the count in the dashboard.
for i in {1..50}; do curl "http://nap-ingress2.f5k8s.net/?a=b=0xF0"; done
Review the main dashboard and note if the number of attacks incremented and which severity level incremented.
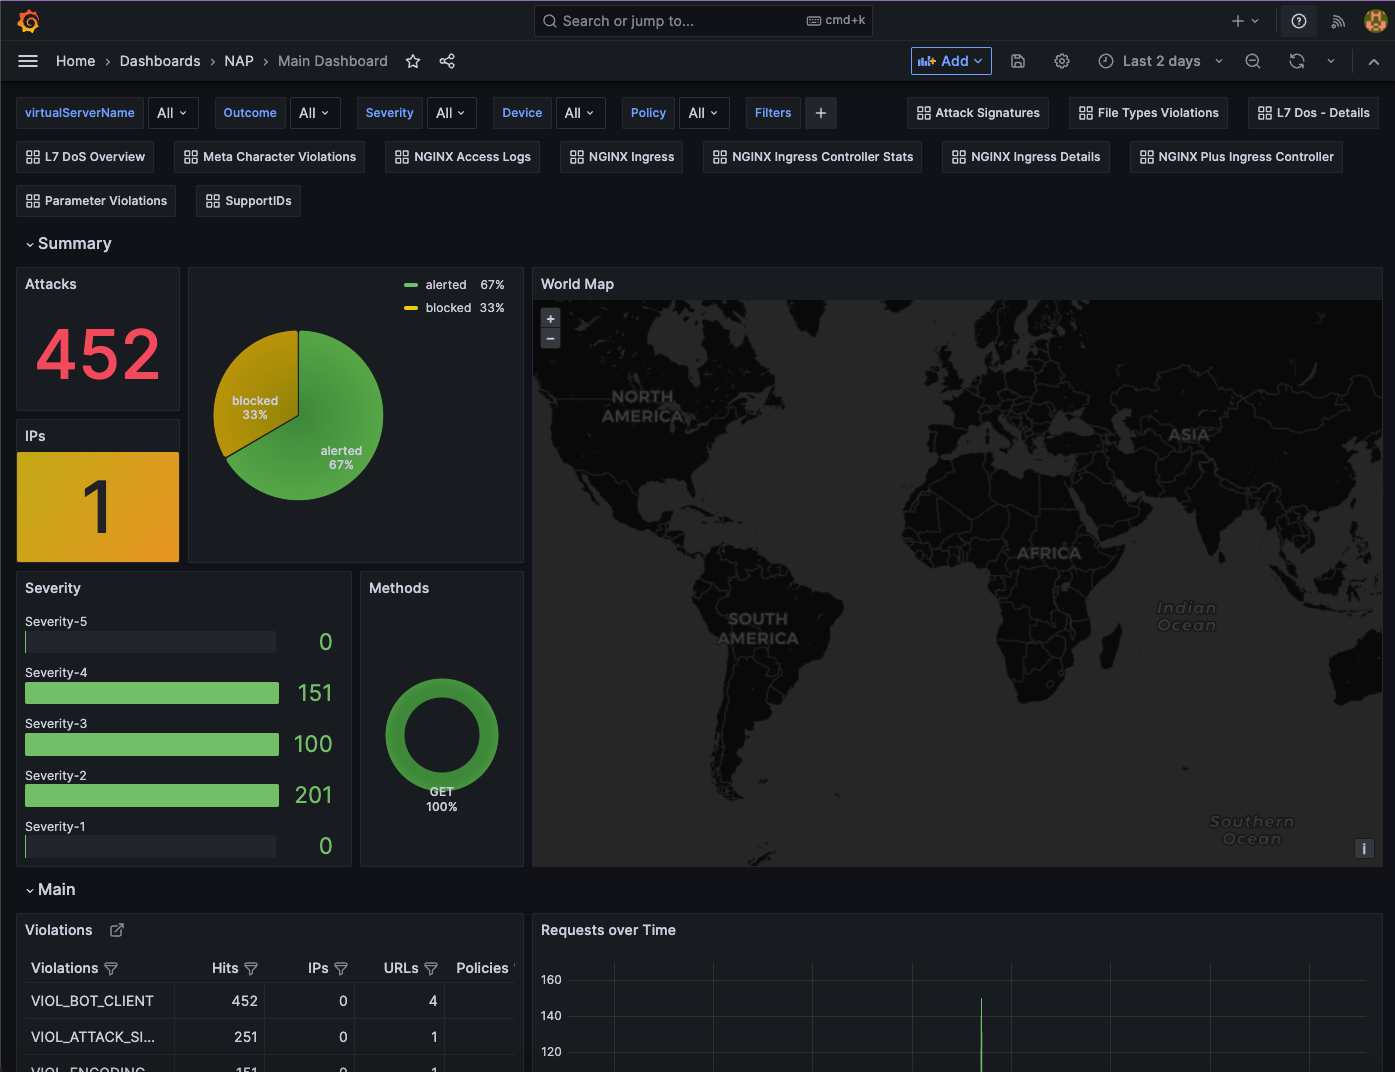
Were the attacks blocked by the WAF? Hint: Did the server response include a support ID?
Examine the dashboard and examine the ‘Main’ Dashboard and notice how the additional 50 requests were categorized. Why was it not blocked?
Next in the terminal window execute the following command.
for i in {1..50}; do curl "http://nap-ingress2.f5k8s.net/intranet/"; done
Were the attacks blocked by the WAF? Hint: See above!
Examine the dashboard and examine the ‘Main’ and the ‘Attack Signatures’ Dashboards and notice how the additional 50 requests were categorized.
If you scroll to the bottom of the ‘Attack Signatures’ Dashboard you can see the ‘URL / Request violations details’
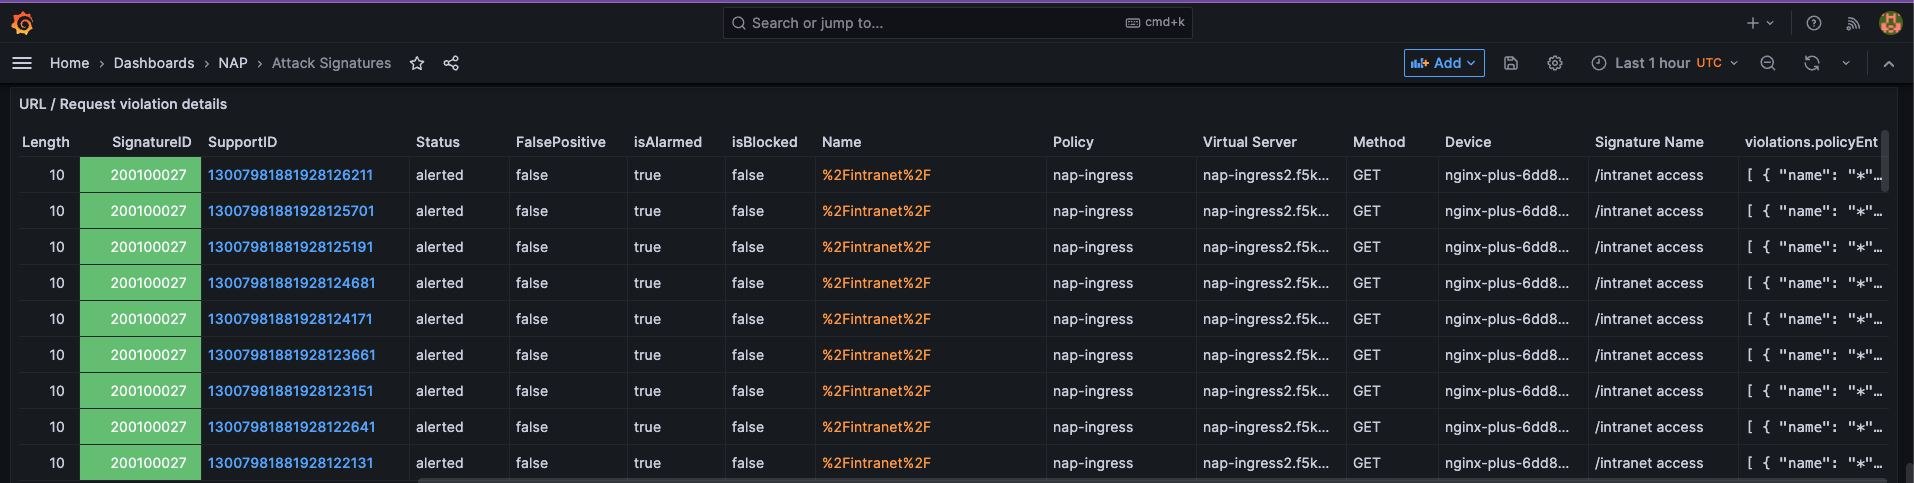
Clicking on a “Support ID” will launch another screen to provide more details.
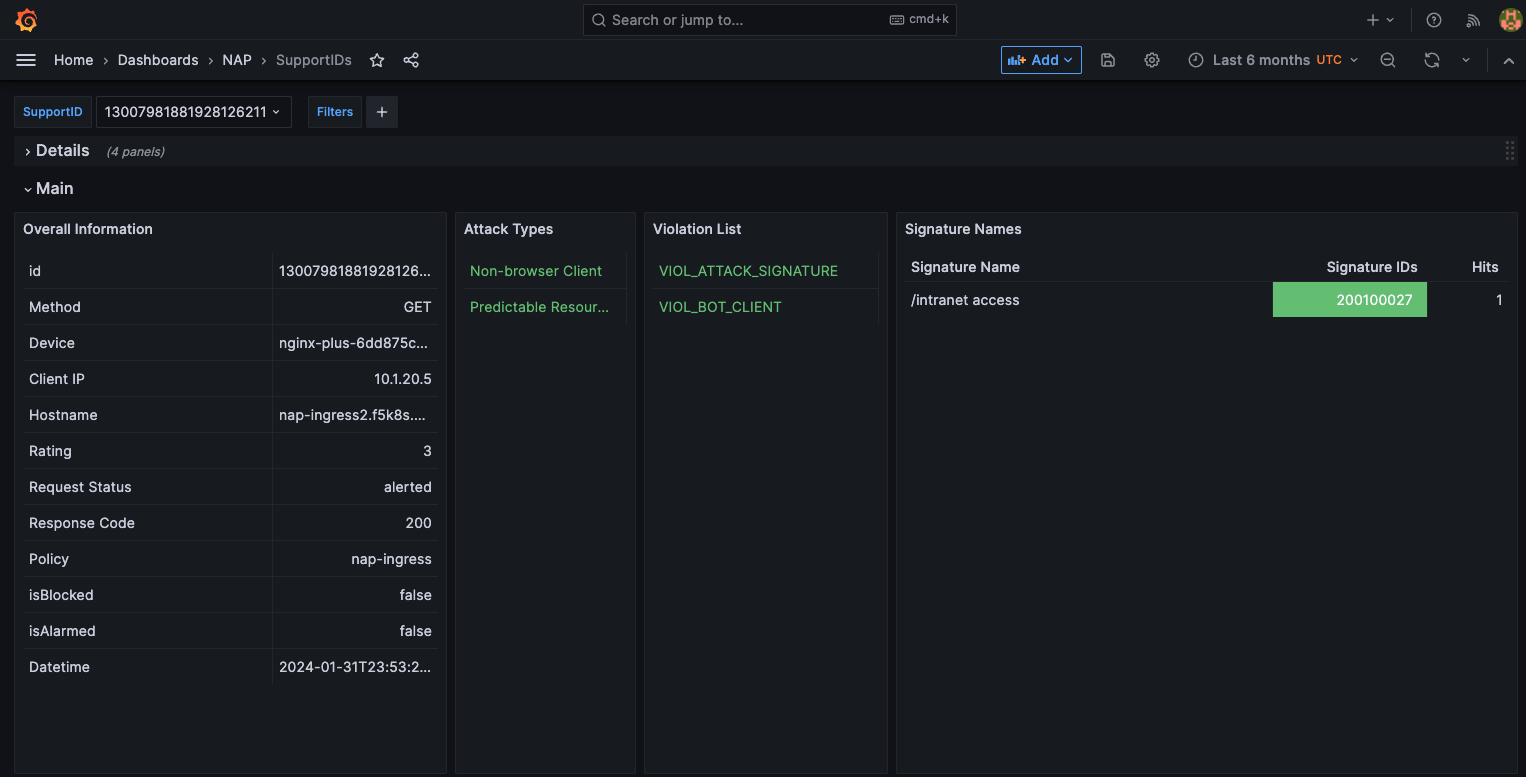
What triggered the violation? What was the violation rating? Why was it blocked or not blocked?
for i in {1..50}; do curl "http://nap-ingress2.f5k8s.net/etc/security/password"; done
Were the attacks blocked by the WAF? Hint: Are you seeing a trend here?
Once again examine the dashboard results.
Now let’s combine all of these requests in to one.
for i in {1..50}; do curl "http://nap-ingress2.f5k8s.net/intranet/?a=/etc/security/passwd&b=%f0"; done
Now examine the results. Were the requests blocked? Discussion.
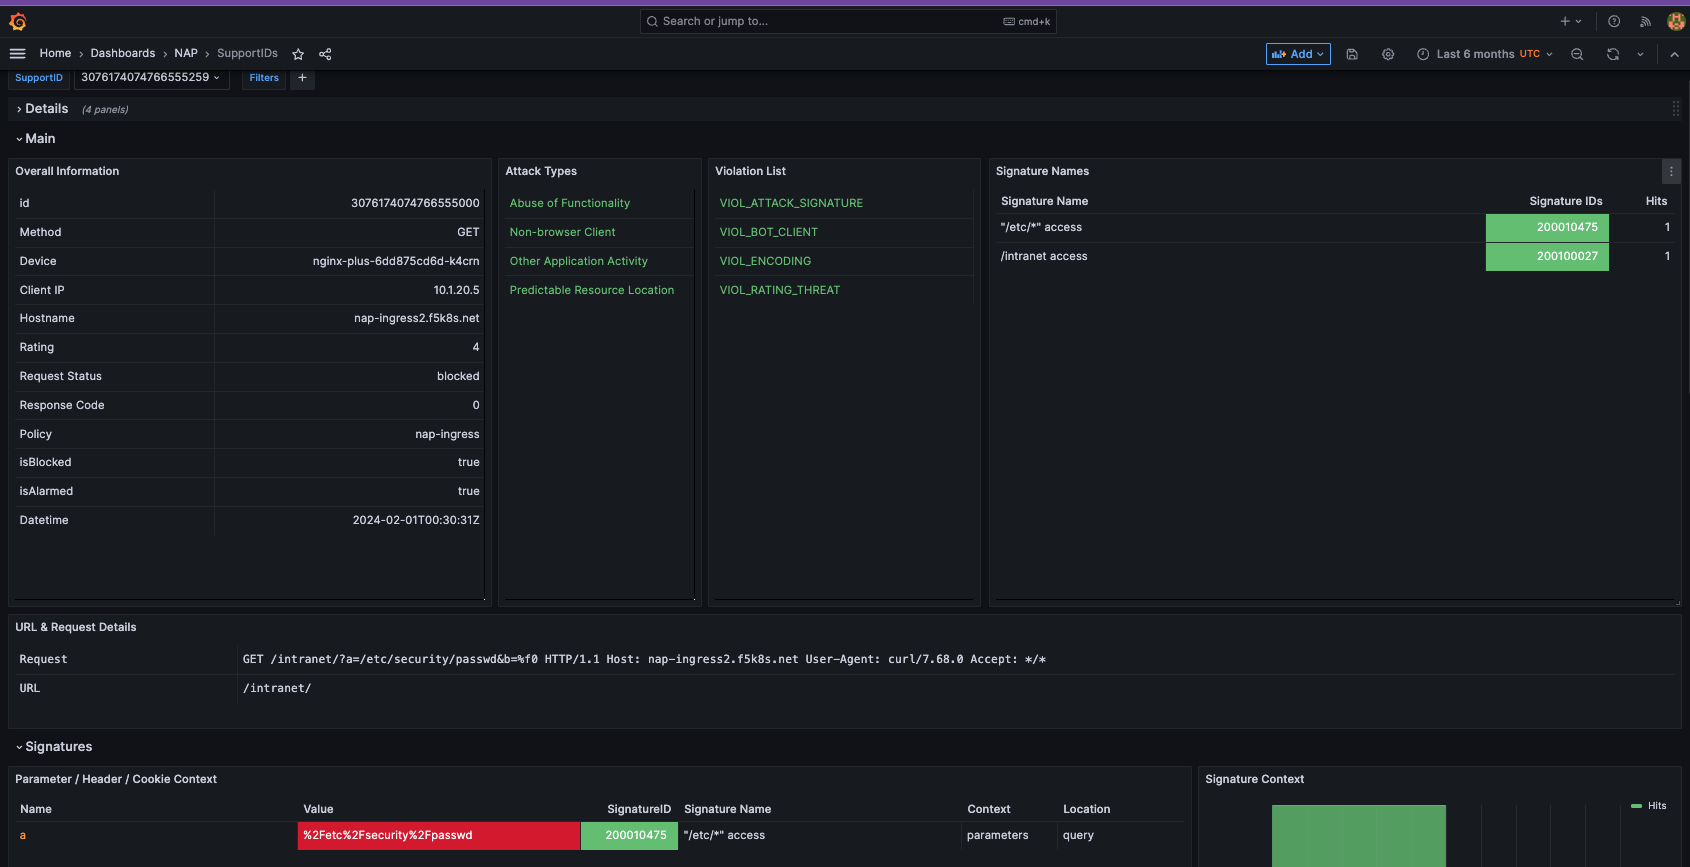
Also note, the VIOL_BOT_CLIENT. How do you think this was detected? Let’s try and fool it by changing the “user-agent” to a regular browser.
for i in {1..50}; do curl -H "user-agent: Mozilla/5.0 (Windows NT 10.0; Win64; x64) AppleWebKit/537.36 (KHTML, like Gecko) Chrome/88.0.4324.182 Safari/537.36" "http://nap-ingress2.f5k8s.net/intranet/?a=/etc/security/passwd&b=%f0"; done
Examine the different violation log details in Kibana.
This completes the lab.