NGINX Modern Apps > Class 8 - Mastering NGINX One: Performance Tuning and Security Hardening Best Practices Source | Edit on
Getting Familiar with the Lab
Welcome to the NGINX Performance Tuning and Security Hardening lab! This lab is divided into several sections:
- Environment setup
- Performance assessment & tuning
- Security assessment & hardening
These sections are further subdivided into modules, accessible via the navigation on the left.
Materials
During this lab, we will be using the following systems, all running in F5’s Unified Demonstration Framework (UDF) cloud environment:
- NGINX Proxy: A reverse proxy / load balancer on which we will be tuning the configuration to achieve better performance and security for our backend applications
- App Server: Our mock backend application server that we will use to serve data and return information to inform our security posture
- Locust Worker: Generates traffic load for our Performance Tuning modules and contains scripts to simulate various security attacks
- Locust Controller: Manages the Locust Worker instance and provides a GUI interface for monitoring load
- NGINX Instance Manager: A web based application for managing NGINX instances. You will use this to update the NGINX Proxy’s configuration file.
System Architecture Diagram
This diagram represents how the individual systems in the lab environment connect:
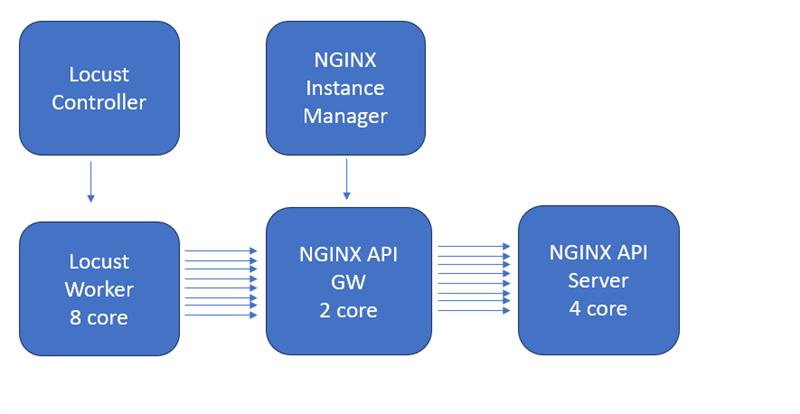
The Locust load generation tool will be retrieving a 1.5MB file from the backend application server.
Get to Know the Environment
Let’s familiarize ourselves with the UDF platform, lab instances and key utilities.
Note
This section will focus on the Performance Tuning portion of the lab. Security hardening systems, concepts and utilities will be covered in a later module.
- Log in to NGINX Proxy
Click on ACCESS and then WEB SHELL

- Review the nginx.conf file and some of the parameters already set
view /etc/nginx/nginx.conf

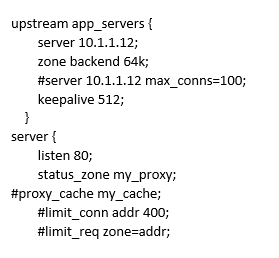
As an example, the upstream app_servers config block includes:
- zone backend 64k: Defines a shared memory zone allowing NGINX worker processes to synchronize information on the backend’s run-time state.
The server config block includes:
- status_zone my_proxy: Defines a shared memory zone allowing NGINX worker processes to collect and synchronize information on the status of the server. This enables us to monitor HTTP server statistics in the NGINX Plus dashboard.
Quit out of the view application by typing :q followed by the Enter/Return key
- Go to NGINX Proxy Dashboard and review
Under ACCESS for the NGINX Proxy, select NGINX+ DASHBOARD

Review the Dashboard and what is included under the tabs across the top of the page
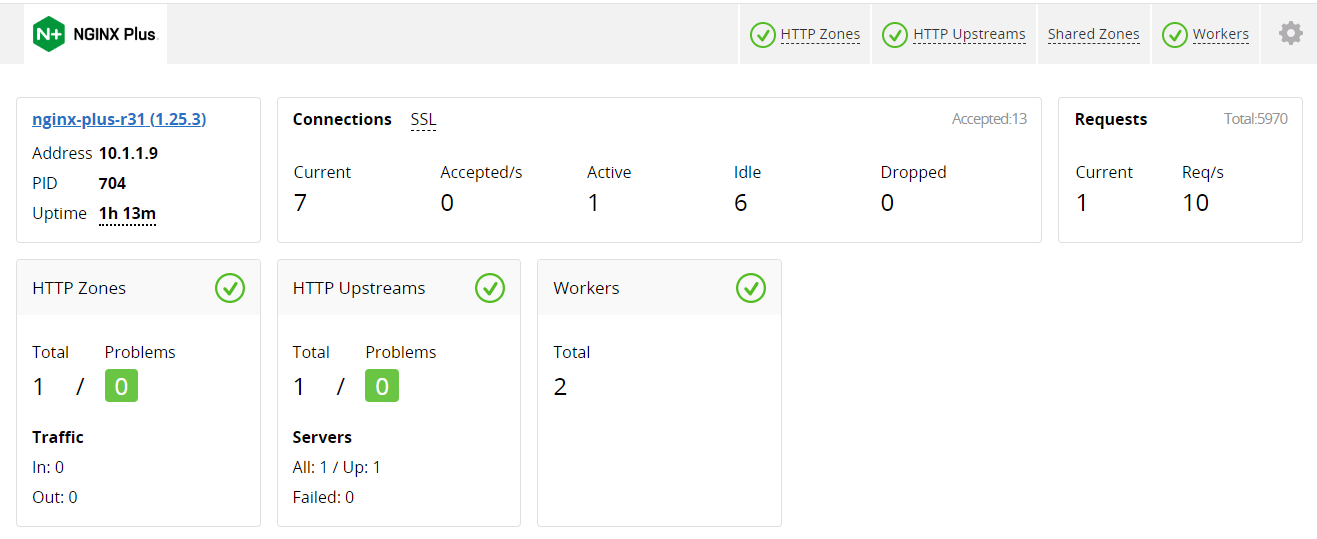
- HTTP Zones: this section contains the zone we defined in the proxy’s server block. It tracks collective requests, responses, traffic and SSL statistics. Note that SSL statistics are missing because for simplicity, we do not use SSL for this lab.
- HTTP Upstreams: this sections contains statistics on the upstreams or backends that we defined in the proxy’s upstream block. It tracks connections, requests, responses, health statistics and other information related to the proxy’s connection to the application server.
- Workers: this section contains statistics that are specific to individual NGINX worker processes.
- Caches: this section is not yet visible. Later in the lab we will turn caching on and this section will display statistics related to the health of our proxy’s cache.
- Start up Locust controller software
Log on to the Locust Controller WEB SHELL

Review the Locust configuration files
cat /home/ubuntu/run_locust_controller.sh
cat /home/ubuntu/locustfile.py
Notice that the Locust load script is configured to get a file called “1.5MB.txt”, effectively putting load on the proxy.
Now start up the Locust Controller and web interface.
/home/ubuntu/run_locust_controller.sh
- Access the Locust Controller Web Interface
Under Locust (Controller) ACCESS click on LOCUST to bring up the Web Interface

- On Locust Worker node
Log on to the Locust (Worker) WEB SHELL

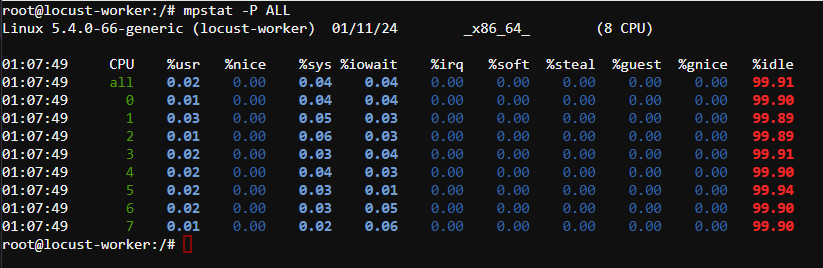
Verify 8-core machine, run this command to verify CPUs and their associated statistics.
mpstat -P ALL
Warning
This command will output average statistics, including CPU %idle, since instance startup. In upcoming steps, we will append a 1 to the end of this command, which will instruct it to show data averaged from the preceding second.
Start up locust workers by running this command:
/home/ubuntu/start_locust_workers.sh
This script with start all 8 workers (1 per CPU) in NOHUP mode, meaning you can close the shell window and they’ll keep running. However, it’s best to keep this window open to monitor the workers, which will log their output to nohup.out.
Tail the nohup.out file to monitor Locust workers
tail -f /home/ubuntu/nohup.out
Sometimes, overloading Locust may cause worker threads to quit. We’ve tuned this lab so that shouldn’t happen, but if it does, you’ll want to terminate the workers and restart them. You can use the previously shown script to restart the workers. To terminate them, we’ve included the following script:
/home/ubuntu/terminate_locust_workers.sh
7. In Locust GUI, start the load generation Let’s begin with a basic test to get a performance baseline with our default settings.
Number of Users: 100
Spawn rate: 10
Host: http://10.1.1.9/
Advanced Options, Run time: 30s
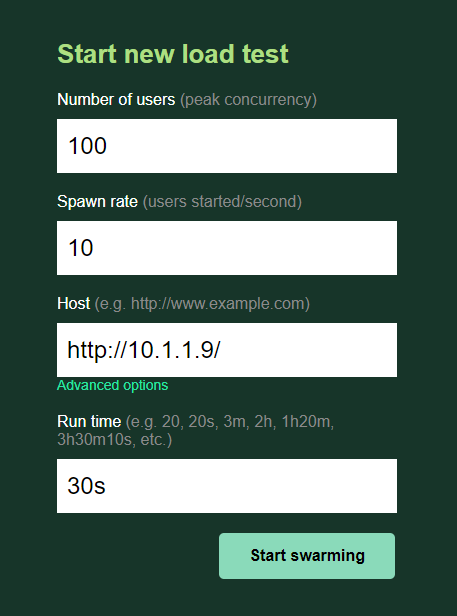
Click the ‘Start swarming’ button
- Review graphs as they are generated
Click the Charts tab to review graphs as they are generated

Note
What is happening with Total Request per Second and Response Time graphs
- Run same test again
Run the same test a 2nd time by clicking ‘New test’ at the top-right under ‘Status STOPPED’. Keep the settings the same as before and click the ‘Start swarming’ button.

Review NGINX Proxy CPUs while test is running. Back on NGINX Proxy WEB SHELL:
mpstat -P ALL 1
Note
How much CPU is being used? Is the system fully saturated?
Review Locust GUI Charts
Note
Even when all test parameters are the same, tests will exhibit different results due to a multitude of external factors influencing system and network resources.
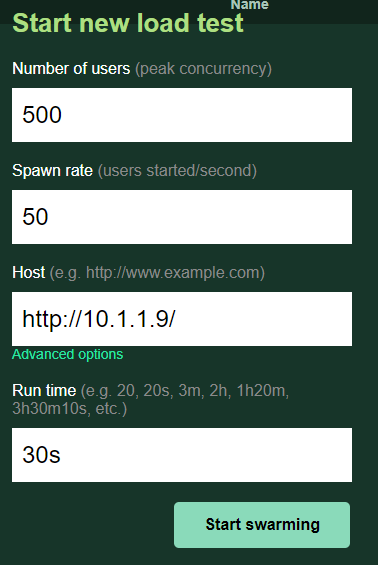
- Run another test but this time with more load
Number of Users: 500
Spawn rate: 50
Host: http://10.1.1.9/
Advanced Options, Run time: 30s
Review NGINX Proxy CPUs and the Locust GUI Charts
Note
How much CPU is being used? Is the system fully saturated? How was Total Request per Second affected by this additional load
- Run same test again and review NGINX Dashboard
How many Active Connections do you see?
Under HTTP Zones, review the total requests and responses count.